A Firm-Level Analysis
Fabrizio Coricelli, Paris School of Economics and CEPR Nigel Driffield, Aston Business School
Sarmistha Pal*, University of Surrey & IZA
Isabelle Roland, London School of Economics 30 March 2012
Abstract: In the wake of the global financial crisis, several macroeconomic contributions have highlighted the risks of excessive credit expansion. In particular, too much finance can have a negative impact on growth. We examine the microeconomic foundations of this argument, positing a non-monotonic relationship between leverage and firm-level productivity growth in the spirit of the trade-off theory of capital structure. A threshold regression model estimated on a sample of Central and Eastern European countries confirms that TFP growth increases with leverage until the latter reaches a critical threshold beyond which leverage lowers TFP growth. This estimate can provide guidance to firms and policy makers on identifying “excessive” leverage. We find a similar non-monotonic relationship between leverage and proxies for firm value. Our results are a first step in bridging the gap between the literature on optimal capital structure and the wider macro literature on the finance-growth nexus.
Keywords: Trade-off theory; optimal leverage; TFP growth; non-linear relationship; threshold regression; Transition economies.
JEL classification: G32, O16
* Corresponding author Sarmishta Pal:[email protected]. An earlier version of the paper has been circulated as ‘Excess Leverage and Productivity Growth in Emerging Economies: Is there a threshold effect? Financial support to Nigel Driffield and Sarmistha Pal from ESRC grant RES-062-23-0986 is gratefully acknowledged. We are much grateful to the Editor and the referee of this Journal for many constructive comments and to Sourafel Girma and Michael Henry for assistance with the estimation of the threshold model. We thank Yama Temouri for research assistance and Erik Berglof, Ralph de Haas, Bruce Hansen, Peter Sanfey, Ilya Strebulaev, Jeffrey Wooldridge, Jeromin Zettelmeyer and seminar participants at Aston Business School, UCL, EBRD and CICM conference, London for helpful comments and suggestions on an earlier draft. The usual disclaimer applies.
When Does Leverage Hurt Performance?
A Firm-Level Analysis
1. Introduction
The global financial crisis has revived interest in the risks of excessive credit expansion at the macroeconomic level. In a recent paper titled “Too much finance”, Arcand et al. (2011) identify a threshold level of domestic credit to the economy beyond which output growth begins to fall. Reinhart and Rogoff (2010) identify a similarly non-monotonic relationship between public debt and growth. In this paper we argue that there can be too much finance at the firm level. Using insights from the macroeconomic and corporate finance literatures, we identify a non-monotonic relationship between leverage and firm-level productivity growth.
Corporate leverage decisions are among the most important decisions made by firm executives and have been the focus of intense scrutiny since Modigliani and Miller (1958). Financial conditions in the corporate sector not only affect firm performance but, as macroeconomists have long recognized, they can have a powerful effect on macroeconomic outcomes. The literature on “financial accelerators” is concerned with the role of financial conditions in amplifying shocks to the economy (see e.g. Bernanke et al. (1999)) while the literature on the finance-growth nexus (e.g., see Ang (2008) for a recent survey) is concerned with their contribution to long-term growth. The present paper aims to provide a first attempt at bridging the gap between the literature on optimal capital structure and the macroeconomic literature on finance-growth linkages. We use threshold regressions to investigate the non-monotonic relationship between leverage and several indices of firm performance, and the extent to which this relationship varies across types of firms.
Among all possible measures of firm performance, our analysis particularly focuses on total factor productivity (TFP) growth for several reasons. Productivity growth is generally considered to be the main driver of growth at the macroeconomic level. A number of studies have demonstrated that TFP growth is more important for income growth than other factors such as capital accumulation, and that TFP differences explain more of the variation in cross-country per capita GDP than
variables like human capital, physical capital or trade1. Productivity has also been used to gauge firm
performance in the corporate finance literature [e.g. Schoar (2002), Maksimovic and Phillips (2002), McGuckin and Nguyen (1995), Imrohoroglu and Tüzel (2011)], the management accounting literature [Kaplan (1983)], and the literature on corporate control [Köke and Renneboog (2005)]. It is an important determinant of how firms react to business cycle fluctuations. In the framework of Imrohoroglu and Tüzel (2011), low TFP firms are more vulnerable to business cycles and hence are riskier than firms with high TFP. Low TFP firms have a higher implied cost of capital (ICC) and both the levels of ICC and the ICC spread between low and high TFP firms are countercyclical. Several papers find that productivity is positively related to firm value2. Intuitively, productivity growth results in the efficient use of the firm’s resources, which
allows the firm to reduce its output prices while maintaining or increasing profit margins. In the long-run, productivity growth enables the firm to remain profitable and survive, which enhances shareholders’ wealth. Therefore, our starting point to understand the link between leverage and productivity growth is the finance literature that relates leverage to firm value. In particular, our hypothesis is inspired by the trade-off theory of optimal capital structure, which explains firms’ choice of leverage by a trade-off between the benefits and costs of debt. The second most influential theory of corporate leverage is the pecking-order theory due to Myers (1984). Therefore, identifying the non-monotonic effects of leverage on productivity gains is relevant both from the perspective of capital structure theory and the macroeconomic perspective of long-term growth and business cycle fluctuations.
We focus on the trade-off theory rather than the pecking order theory for various reasons. From a policy perspective, it is important to identify firms or sectors where leverage may be excessive. Excessiveness must be defined with respect to an optimal capital structure. However, there is no optimal debt ratio in the pecking order theory in the sense that firms do not aim at a particular target debt ratio. Instead, the theory suggests that observed leverage is the cumulative result of hierarchical financing decisions over time (Shyam-Sunder and Myers (1999)). In addition, the US empirical evidence is not very supportive of the pecking order theory [See for example Fama and French (2002a) and Frank and Goyal (2003)]. In a recent comprehensive review of the literature,
1 See for example Klenow and Rodriguez-Clare (1997), Hall and Jones (1999), Easterly and Levine (2001), and Henry et al (2009).
Frank and Goyal (2009) conclude that the empirical evidence is rather consistent with some versions of the trade-off theory. This does not imply that the pecking order theory is irrelevant in our sample and we do not attempt to test it. The trade-off theory is simply the most natural starting point for a study of “excessive” indebtedness.
The trade-off hypothesis (right word?) goes back to Kraus and Litzenberger (1973) who weigh bankruptcy costs against the benefits of interest tax shields. The benefits of debt also include the mitigation of agency problems. In particular, debt has a disciplining role due to the associated reduction in free cash flow (Jensen, 1986). The costs of debt include debt overhang (Myers (1977)), risk-shifting (Jensen and Meckling (1976)), bankruptcy costs (Warner (1977)), and asset fire sales (Schleifer and Vishny (1992)). Trade-off theory predicts that net benefits to debt financing rise for companies with low debt but decrease as leverage becomes high, implying that net benefits are a non-monotonic function of leverage. The empirical literature tests this hypothesis (against the competing pecking order theory) by typically running cross-sectional or panel regressions of leverage on various firm-level, industry-level and market characteristics that determine optimal leverage3. While the literature has explored the relationship between leverage and firm value or
performance (e.g., McConnell and Servaes (1995); Berger and di Patti (2006); Driffield, Mahambare and Pal (2007)), it has remained silent on the relationship between leverage and productivity. With both benefits and costs to leverage, we posit a hump-shaped relationship between leverage and productivity growth at the firm level4. At low levels of leverage, higher
leverage is likely to be associated with higher TFP growth as the benefits to leverage outweigh the costs and debt is used to finance productive investment. As leverage increases, the costs of debt become larger and erode the net benefits to leverage. Highly-levered firms not only suffer from a debt overhang problem, which reduces their incentives to invest in productive investment, their attention is also diverted from productivity improvements by the need to generate cash flow in order to service their debts. While our hypothesis is clearly inspired by the trade-off theory, its testing does not constitute a test this. Trade-off theory relates the cost of capital of the firm (or its market value) to its market-value-based debt-to-equity ratio. In this paper, we relate TFP growth
3 See Frank and Goyal (2009) for a review of the literature.
4 A similar relationship can be posited between leverage and any index of firm value. While our focus is on TFP growth, we also provide evidence of a non-monotonic relationship between leverage and two proxies for firm value, namely return on assets and return on equity (see section 3).
to the book value of leverage. The use of book values is dictated by the lack of market data for our sample countries where equity markets remain rather underdeveloped.
Our sample consists of Central and Eastern European countries. Transition economies are an interesting sample for several reasons. First, the transition experience has long been described as a “natural experiment” (see for example, Eicher and Schreiber (2010)). While transition countries started the transition process from similar (though not identical) positions in terms of liberalisation, institutional reform has progressed in varying ways and to different degrees. Even after more than a decade of financial sector reforms, there is a growing feeling that the latter have failed to spur adequately the development of corporate financing opportunities. There is a striking proportion of firms in our sample with zero outstanding debt, including both short- and long-term debt. The “mystery of zero-leverage firms” (Strebulaev and Yang (2006)) is very pronounced in transition countries. Second, this puzzle is augmented by another one: among those firms with outstanding debt, many tend to have very high, potentially excessive leverage. Unlike much of the literature on developed countries, the literature on capital structure in developing and transition countries has highlighted the importance of excessive leverage (e.g. see Driffield and Pal (2010)). Many CEE countries have experienced rapid credit growth in recent years, in particular the Baltic States, Southern Eastern Europe and Ukraine. While the benefits of rapid credit growth have been recognized, the risks related to credit booms have been highlighted by the recent financial crisis, which has severely hit many CEE countries. Assessing the sustainability of firm-level credit growth and developing appropriate policy tools remains one of the priorities of policymakers and international organizations active in this region. In addition, the continued practice of soft budget constraints in this region may contribute to the negative impact of excessive leverage on TFP growth5 in our sample. Soft budget constraints (SBCs) imply that government or financial
institutions are willing to provide additional financing to firms with negative NPV projects (see e.g. Dewatripont and Maskin (1995)). If firms take advantage of SBCs, borrowed funds may be used inefficiently rather than for productive investment. Research has indeed shown that one of the detrimental impacts of SBCs on the economy is a lack of R&D (Kornai (2001) and Brücker et al. (2005)).
5
Konings et al. (2003) for example demonstrate that soft budget constraints remain into later stages of transition. (e.g.)).
Our estimates confirm that TFP growth increases with leverage until the latter reaches a critical threshold beyond which leverage becomes “excessive” and lowers TFP growth. We confirm the robustness of this result by estimating an alternative threshold model using lagged leverage. All the results point to the existence of an optimal leverage ratio where the net benefits of debt in terms of productivity gains are exhausted. Our paper reaches some qualitatively similar conclusions to Korteweg (2010). Using a different methodology and a market-based assessment of the net benefits to leverage, the author finds that as leverage increases, net benefits to leverage first increase and then decrease, and finally turn negative for distressed firms. In addition, our analysis sheds light on how optimal leverage varies with firm characteristics, particularly profitability and size. Unlike existing studies that use traditional cross-sectional or panel regressions using observed leverage ratios6, the threshold model allows us to determine optimal leverage despite firms’ temporary
deviations from the optimum. Again, we reach conclusions similar to those of Korteweg (2010). Since our conceptual starting point is the trade-off theory, we attempted to gauge its relevance in our sample. Data limitations permit only an indirect test of thetraditional trade-off theory. We employ two indices of firm value based on earnings (return on assets defined as EBIT to total assets and return on equity defined as EBIT to book value of equity) and related these to the book value of leverage using a threshold regression. While the exact values of the thresholds are somewhat higher, the qualitative results regarding the non-monotonic relationship described above hold when the dependent variable is a proxy for firm value rather than TFP growth (see further discussion in section 3).
Finally, our paper also contributes to the burgeoning macro literature on the finance-growth nexus. Best practice in the recent literature on finance and growth uses industry-level data to overcome endogeneity problems typical of analyses that rely on aggregate data and identify the channel through which finance affects growth. In their seminal contribution, Rajan and Zingales (1998) find that industries that are relatively more dependent on external finance grow disproportionately faster in countries with more developed financial markets. Our paper provides an alternative firm-level approach for studying the finance-growth nexus by directly linking firms’ financial structure to
6
TFP growth. In addition, our paper is related to the literature on the macroeconomic risks associated with lending booms. Kiyotaki and Moore (1997) show how increases in corporate leverage lead to higher costs of external financing due to a higher default probability. This could lower investment and therefore output. Kiyotaki and Moore (1997) and Bernanke et al. (1999) show how high indebtedness in the corporate sector can induce severe slowdowns by amplifying and propagating adverse shocks to the economy. Our analysis provides a tool to identify the point at which corporate sector indebtedness becomes a cause for concern. Indeed, whether a firm is below or above the threshold can be seen as a measure of “sustainability” of a firm’s leverage. The recent financial crisis has highlighted the risks of lending booms and the associated buildup of excessive indebtedness. Policy makers need to be able to assess the sustainability of leverage, both in order to prevent similar crises in the future and to identify those firms or sectors of the economy that need to go through a deleveraging process following a crisis. The empirical literature on lending booms has generally focused on various aggregate measures of indebtedness such as various debt-to-GDP ratios (e.g. see Gourinchas et al. (2001)), or the growth rate of the domestic credit to GDP ratio as in the literature on banking and currency crises (e.g. see Kaminsky and Reinhart (1999)). Our paper extends this literature by looking at the sustainability of credit at the firm level.
The remainder of the paper is structured as follows. In Section 2, we describe the data set and the variables used in the empirical analysis. In Section 3, we discuss the empirical methodology and present our results. Section 4 summarizes our main results and concludes.
2. Data set and descriptive statistics
2.1. Sample and sources
The empirical test of our central hypothesis is based on firm-level data for a group of Central and Eastern European (CEE) countries. Data used for the analysis is primarily taken from Orbis, a rich firm-level dataset, which is provided by Bureau van Dijk electronic publishing. Firm-level data have been supplemented by country-level institutional data from the European Bank for Reconstruction and Development (EBRD). Our sample consists of manufacturing firms from sixteen transition countries, namely, Bosnia and Herzegovina, Bulgaria, Croatia, the Czech Republic, Estonia,
Hungary, Latvia, Lithuania, Poland, Republic of Moldova, Romania, Russia, Serbia, the Slovak Republic, Slovenia and Ukraine over the period 1999-2008. As can be seen from Figure 1, all these countries have on average experienced strong growth of domestic credit between 1998 and 2008. The effects of the Russian crisis, the bursting of the dotcom bubble and the financial crisis starting in 2007 visibly translated into a slowdown.
[Insert Figure 1 here]
2.2. Leverage measures and descriptive statistics
Since we do not have data on market values for our sample firms, we consider two alternative definitions of book leverage: debt to total assets and total liabilities to total assets. These are accepted measures of leverage; especially in emerging markets where the size of equity markets is rather limited (e.g., see Booth et al. 2001; Driffield and Pal, 2010). First, we use the ratio of total debt (sum of long-term debt in non-current liabilities and loans included in current liabilities) to total assets (abbreviated as TDTA). Second, we use the ratio of total liabilities (sum of total current liabilities and total non-current liabilities) to total assets (abbreviated as TLTA)7. As can be seen
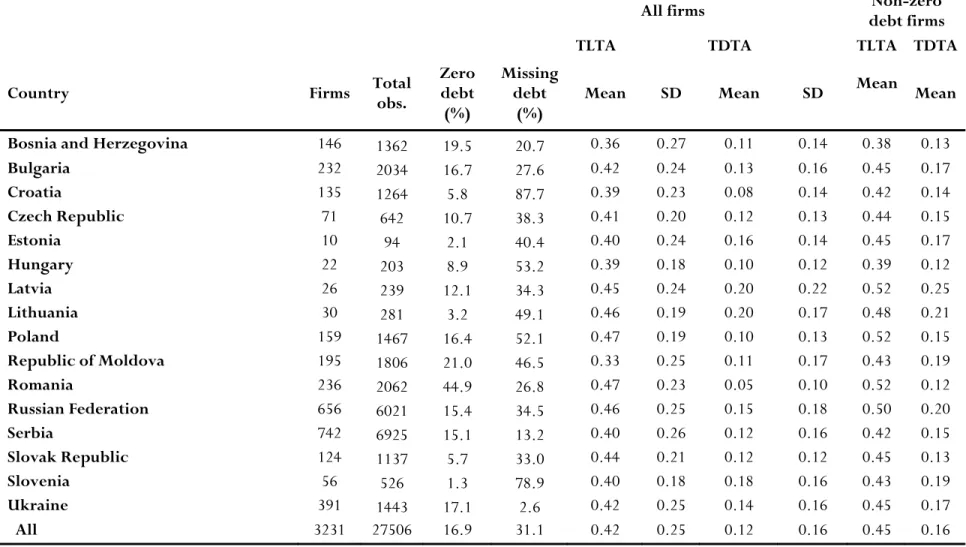
from Table 1, there is a significant proportion of zero-leverage firms, without any outstanding debt, as well as a significant proportion of firms for which debt data is missing. This reflects the fact that many firms still do not have access to debt markets in these economies and instead make heavy use of internal finance, trade credit and other kinds of liabilities. Accordingly, the sample size is larger when leverage is measured by TLTA.
[Insert Table 1 here]
Table 1 shows the average leverage ratios for two subsamples, “all firms”, including zero-leverage firms, and “non-zero debt firms”, excluding zero-leverage firms. Among all firms, the average ratios of total liabilities to total assets range between 0.33 (Moldova) and 0.47 (Poland and Romania), while average debt ratios range between 0.05 (Romania) and 0.20 (Latvia and
7 Data on the book value of equity of our sample firms is limited.We use the book value of total assets rather than the book value of equity in order to maximize the sample size.
Lithuania). Among non-zero debt firms, the average debt ratios are unsurprisingly higher in all the sample countries, ranging from 0.12 in Romania to 0.25 in Latvia8. Table 2 shows the percentile
distribution of debt ratios in each country. Debt ratios among the top 1% firms tend to be significantly higher than those for the median firms. Debt ratios for this group of firms exceed 50% in all but one country (Estonia). The maximum average leverage for this group is 89% in Croatia, closely followed by 85% in Latvia.
[Insert Table 2 here]
Table 2 also summarizes the distribution of debt by firm size. We split the sample between “small” and “large” firms, where small firms are defined as those in the first two quartiles of the distribution of total assets. The correlation between firm size and the debt ratio is mostly positive, although it is quite small in some cases. A large positive correlation is found in Bulgaria, Croatia, Moldova, Serbia, which is in line with the US and international cross-sectional evidence that large firms tend to have higher leverage ratios than small firms9.
As mentioned earlier, institutional reforms in the financial sector have progressed at varying speeds across countries in our sample. Table 3 summarizes the average values of the EBRD banking sector reform index and stock market capitalization to GDP for the period 1999-2008. The extent of stock market capitalization as a share of GDP is generally limited in most of the sample countries, especially in Bulgaria, Latvia, Romania and the Slovak Republic. Therefore, firms’ external financing opportunities may depend crucially on the size and efficiency of the banking sector. The extent of banking sector reforms varies widely across countries as can be seen from Table 3.
[Insert Table 3 here]
A more efficient banking sector is better able to screen out bad loans while a better developed stock market not only offers an alternative source of external finance, but also contributes to improved corporate governance practices. Given the variation in the extent of institutional reforms across our
8 We have also experimented with alternative leverage measures, namely, debt and liability ratios net of cash-flow, which yield comparable results to those presented here.
sample countries, it may be important to control for the quality of financial institutions when assessing the effect of leverage on TFP growth.
3. Empirical model of leverage and productivity growth
We use the threshold regression framework of Hansen (2000) in order to test the hypothesis of a non-monotonic relationship between leverage and productivity growth10. In our attempt to bridge
the gap between the trade-off theory and the finance-growth theory, we also examine if a similar non-monotonic relationship exists between leverage and selected measures of firm value. In the absence of data on the market value of our sample firms, the analysis relies on two earnings-based proxies of firm value, namely earnings before interest and taxes (EBIT) as a share of total assets and as a share of book value of equity. We examine the robustness of our estimates in several ways. First, we address the potential simultaneity between leverage and TFP growth by “instrumenting” leverage with lagged leverage and the predicted values of leverage based on firm characteristics. Second, we examine the relationship between the identified threshold and firm characteristics, namely profitability and size. Finally, we estimate our model on the 2000-2006 subsample.
3.1. Total factor productivity estimates
TFP estimates are generated using the well-known Levinsohn-Petrin method (Levinsohn and Petrin (2003)). This method allows us to address a potential endogeneity problem which arises because firms anticipate shocks to productivity and accordingly adjust inputs throughout the production process. Appendix 1 explains how the Levinsohn-Petrin method addresses this problem.
3.2. A threshold regression model
The current approach to threshold analysis was pioneered by Hansen (2000). The method
10
In order to identify the non-monotonic effects of leverage on total factor productivity growth, one could use a fixed-effects regression of total factor productivity growth on leverage and its non-linear terms, after controlling for other covariates. However this conventional method does not allow one to endogenously determine the existence and significance of a threshold beyond which TFP growth is negatively affected by further increases in debt.
endogenously determines the existence and significance of one or more thresholds that split the sample into “regimes”, and allows the regression coefficients on the threshold variable to vary depending on the regime. In particular, we endogenously identify three regimes of leverage (low, intermediate and high) and show that leverage has a different impact on TFP growth depending on the regime. This method allows us to obtain a direct estimate of optimal leverage while allowing for firm’s temporary deviations from the optimum. Denoting the leverage of the i-th firm in year t by Lit, the simplest threshold model of TFP growth for the period [t, t+1] is given by
ΔTFPit+1 = α1 Lit + β’Xit+ νit if Lit ≤γ (3a) ΔTFPit+1 = α2 Lit + β’Xit+ νit if Lit >γ (3b)
where νit is an error term and
is the threshold parameter to be estimated. Xit is a set of laggedexplanatory variables, including: firm size (dummy for small and medium firms that includes firms in the first two quartiles of total assets), age (dummy for young firms established in or after 1995), the share of intangible assets in total assets (IFATA), foreign ownership (a dummy indicating whether the firm is foreign-owned), lagged TFP to account for convergence effects (Barro (1998)), and sectoral dummies. As mentioned above, we also include two variables that capture the quality of financial market institutions: the EBRD index of banking sector reforms and stock market capitalization as a share of GDP. In order to minimize the potential endogeneity bias, if any, of our threshold estimates using current debt ratio, we also experiment with lagged and fitted leverage ratios and compare these alternative estimates (see further discussion in section 3.6).
Combining (3a) and (3b), we can write:
ΔTFPit+1 = β’ Xit +α1 Lit I(Lit≤γ) + α2 Lit I(Lit >γ)+ νit (4)
I(.) is an indicator function, indicating whether the leverage of the i-th firm at time t is less than, equal to, or greater than the threshold parameter
. The errors νit are assumed to be independentand identically distributed with mean zero and finite variance. Depending on whether the actual leverage is smaller, equal to, or larger than the threshold value ( ) to be estimated, observations are divided into two “regimes” where the regimes are distinguished by different regression slopes,
1
sample size. Given that the parameters α depend on the threshold parameter
, we denote them by α(
). Because of this dependence, Sn(.) is not linear in the parameters but rather a step functionwhere steps appear at some distinct values of the threshold variable
. However, conditional on a given threshold value, say
=
0, Sn(.) is linear in β and α. Accordingly, Sn(β, α(
0)) can be minimised to yield the conditional OLS estimates βˆ(
0) and αˆ(
0). Among all possible values for the leverage threshold, the estimate of the threshold corresponds to that value of α, which minimises the sum of squared errors Sn(β,α(
0)) for
=
0. This minimisation problem is solved by a grid search over 393 leverage quantiles {1%, 1.25%, 1.50% … 98.75%, 99%}. Once the sample splitting value of
is identified, the estimates of the slope parameters are readily available. If a threshold is identified, i.e. α1 ≠ α2, one can form a confidence interval for the particularthreshold value
. This amounts to testing the following null hypothesis: H0: γ= γ0Under the normality assumption, the likelihood ratio test statistic is routinely used in standard econometric applications to test for particular parametric values. But Hansen (2000) shows that LRn(γ) does not have a standard chi-square distribution in the threshold model. The correct
distribution function and the appropriate asymptotic critical values need to be obtained from the bootstrapped standard errors (see Girma (2005) for further details).
On the basis of the trade-off theory of capital structure, we expect a single threshold, which is equivalent to an optimal level of leverage where TFP growth is maximized. However, the confidence interval around the point estimate allows us to identify three bands of leverage. Suppose that the limits of the confidence interval around γ0 are given by
1 (lower limit) and 2 (upper limit). The first band corresponds to a leverage ratio below the lower limit (i.e. leverage ≤
1), the second to an intermediate leverage ratio (i.e.
1< leverage ≤
2), and the third to “excessive”leverage (i.e. leverage >
2). Accordingly, we modify equation (4) as followsΔTFPit+1 = α1 Lit I(Lit≤γ1) + α2 Lit I(
1<Lit≤
2) +α3 Lit I(Lit >
2)+ β’ Xit +νit (5)coefficients. Although these parameters depend on the estimated threshold limits
1 and
2, Hansen (2000) demonstrates that this dependence is not of first-order asymptotic importance. Consequently, the usual distribution theory (i.e. asymptotically normal) can be applied to the estimated slope coefficients so that one can use the asymptotic p-values to test whether there is a significant threshold effect, i.e. whether α1= α2= α3=0. Rejection of this null hypothesis would confirm the presence of a significant threshold effect11.3.3. Baseline threshold estimates
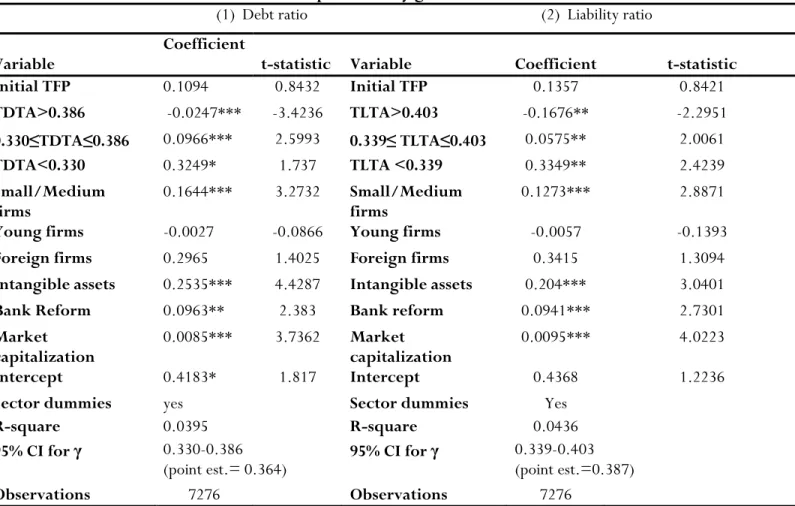
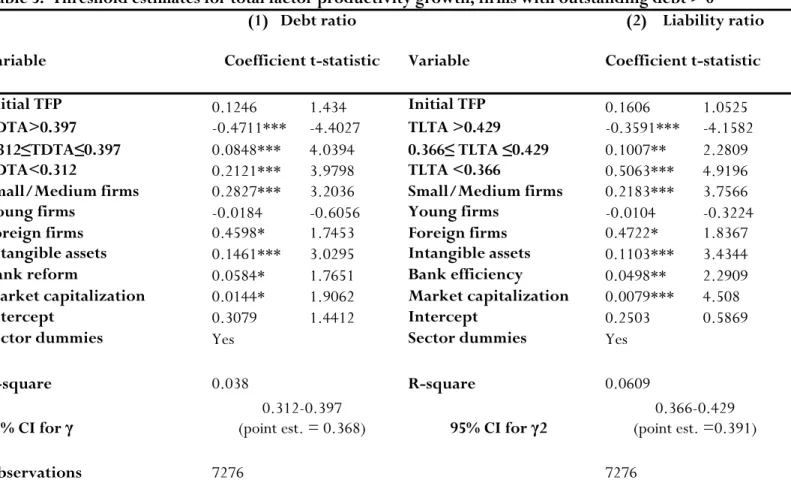
The threshold estimates of model (5) are summarized in Tables 4 and 5 for all firms and non-zero debt firms respectively. The tables report the coefficient estimates for all the explanatory variables (except sectoral dummies), including the slope coefficients for the three bands of leverage identified by the 95% confidence interval around the threshold (we also show the corresponding point estimates). Despite some variation depending on the sample and the measure of leverage, the confidence interval estimates seem quite robust. The upper threshold limits are 0.386 for the debt ratio and 0.403 for the liability ratio for all firms. For indebted firms, the corresponding ratios are 0.397 and 0.429 for the debt and liability ratios respectively. The initial value of TFP is insignificant, indicating the absence of convergence effects.
[Insert Tables 4 and 5 here]
Although average observed TLTA is higher than average observed TDTA (see Table 1), the upper threshold level for the liability ratio is only slightly higher than that for the debt ratio. This result suggests that non-bank liabilities, of which trade credit constitutes a large part, do not significantly contribute to productivity growth in our sample countries. There is a debate in the literature regarding the impact of trade credit on productivity in transition countries. On the one hand, Schaffer (1998) argues that the use of trade credit may soften the budget constraint and therefore delay or prevent the efficient restructuring of companies in transition countries. By contrast, Coricelli (1996) argues that trade credit favours growth by providing access to private credit markets to newly established firms in the region. The positive and negative effects of trade credit
on productivity may offset each other, at least to some extent, so that the net effect of trade credit on productivity growth is small in our sample.
More importantly, the slope coefficients for the three endogenously identified bands of leverage are all significant, irrespective of the sample and measure of leverage used. The slope coefficients provide evidence that moderate leverage (leverage ≤
2) boosts TFP growth (α1and α2 are positive), while excessive leverage (leverage>
2) lowers it (α3 is negative), after controlling for firm-level,sector and market characteristics. The marginal effect of leverage on TFP growth decreases as leverage increases from the lower band through the intermediate one to the upper band where the effect finally becomes negative. In other words, at low levels of leverage an increase in leverage has a large positive impact on TFP growth. This impact diminishes as leverage increases and ultimately turns negative. Based on the estimates of Table 5, a firm with a debt ratio (liability ratio) of 0.2 (i.e. below the lower threshold), for example, reaps net benefits from leverage in the form of 4.24% (10.13%) extra TFP growth compared with an unlevered firm. For a firm with a debt ratio (liability ratio) of 0.37 (in the mid-range), the net benefits amount to 3.14% (3.73%) of extra TFP growth. Finally, a firm with a debt ratio (liability ratio) of 0.5 (i.e. an overlevered firm) has negative net benefits amounting to 23.56% (17.96%) of forgone TFP growth compared with an unlevered firm.
Clearly leverage is not the only factor affecting TFP growth. Among the firm-specific factors, firm size, share of intangible assets and ownership are significant determinants of TFP growth. In general, TFP growth is significantly higher for small and medium sized firms, foreign firms (this is significant at 10% level for indebted firms only) and firms with large intangible assets. The role of institutional factors is also worth highlighting here. A higher efficiency of the banking sector (as captured by a higher index of banking sector reforms) significantly increases TFP growth. The marginal effect of banking sector reforms is about 10% for all firms and 5-6% for indebted firms. In comparison, the marginal effect of market capitalization is small (about 1% for both samples), but positive and statistically significant too. These estimates confirm the beneficial role of better financial institutions on TFP growth in our sample.
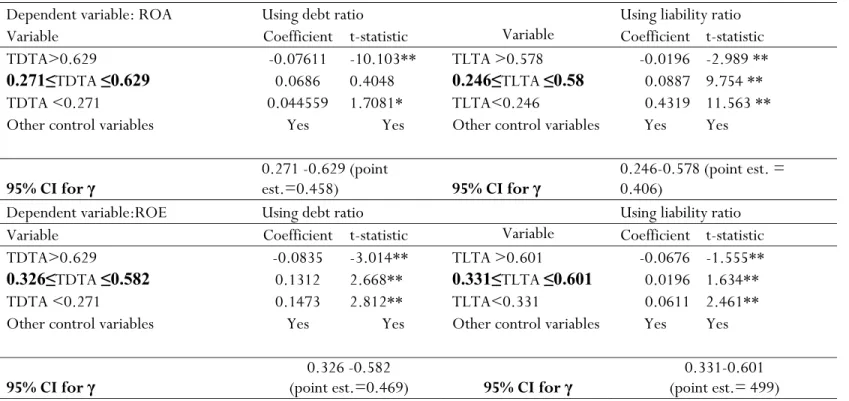
Since our conceptual starting point is the trade-off theory, we attempted to check for its relevance in our sample. However, we were unable to investigate the relationship between market-based measures of leverage and firm value or the cost of capital due to lack of data. Instead, we examine whether a non-linear relationship exists between book leverage and alternative measures of firm value. Since earnings growth is a primary determinant of equity value12, we consider two proxies
for firm value based on earnings, namely return on assets (ROA, defined as the EBIT/total assets) and return on equity (ROE, defined as EBIT/book equity)13. The results are shown in Table 6.
They support the existence of a leverage level that maximizes ROA as well as ROE. [Insert Table 6 here]
Bearing in mind the fact that our results are not a formal test of the trade-off theory due to data issues, this suggests that the optimal leverage level from a firm-value perspective is higher than the optimal level from a productivity perspective. This is likely due to the fact that value creation does not only result from productivity improvements but also increases in the capital base that supports earnings growth14. More importantly, the qualitative results are very similar. The thresholds exist
and the effects of leverage within the three different bands are as for TFP growth: first positive and large, then positive but small, and finally negative. Again bearing in mind the caveats of our analysis, these results can add value to the study of capital structure. In particular, it would be interesting to apply our approach to a sample of firms for which market values are available (e.g. US data).
3.4. Firm characteristics and optimal leverage
We test the robustness of our estimates by splitting the sample between more and less profitable firms and subsequently focusing on a subsample of large firms. In addition to confirming the robustness of the threshold, these robustness checks allow us to investigate the relationship
12
Examples of valuation models which incorporate earnings growth are Campbell and Shiller (2001) and Fama and French (2002b).
13
The availability and quality of data on the book value of equity is limited. We had to exclude about 15% of observations as outliers for the threshold model to converge.
14
The upper threshold level of leverage is smaller for ROE than for ROA. However, given the limited availability and quality of equity data, we refrain from drawing quantitative conclusions from this result.
between optimal leverage and firm characteristics. The trade-off theory predicts a positive relation between optimal leverage and profitability. An increase in earnings increases the tax advantage to debt and reduces the expected costs of distress and bankruptcy, and hence results in an increase in leverage (Strebulaev (2007)). In addition, the trade-off theory predicts a negative relation between optimal leverage and size (e.g. Kurshev and Strebulaev (2006)). However, previous studies using cross-sectional or panel regressions tend to find a negative (positive) relation between profitability and leverage (size) (see e.g. Frank and Goyal (2009)). These conflicting results may be driven by the fact that studies typically rely on the implicit assumption that firms are always at their optimal level of capital structures. By contrast, the threshold model allows us to determine optimalleverage despite firms’ temporary deviations from the optimum and may therefore enable us to examine the empirical validity of the theoretical relationships.
We use two alternative measures of profitability, namely, a firm’s return on assets (ROA, defined as EBIT/total assets) and return on capital employed (ROCE15). We split the sample based on the
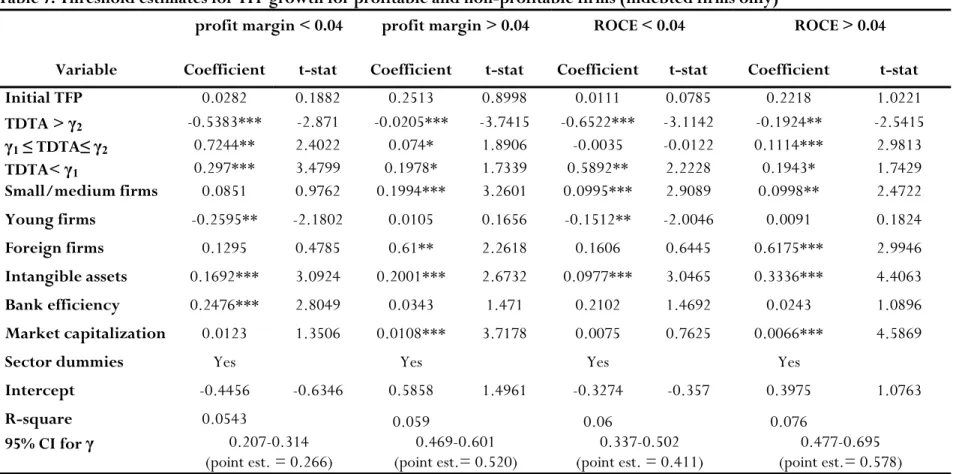
median values of those two profitability measures, i.e. a less (more) profitable firm is defined as one with a profit margin or ROCE below (above) the median ROA or ROCE (approx. 0.04 for both measures). The threshold estimates for more and less profitable firms (indebted firms only) are presented in Table 7.
[Insert Table 7 here]
These estimates confirm the significant adverse effect of excessive leverage (beyond the upper threshold limit) on TFP growth and the positive benefits to leverage below that point. Interestingly, the estimated threshold parameters differ significantly for more or less profitable firms. The upper and lower threshold values of the debt and liability ratios are significantly higher for more profitable firms. For example, the upper (lower) threshold limit is approximately 60% (47%) for more profitable firms as opposed to approximately 30% (20%) for less profitable firms when profitability is measured by the profit margin. Similarly, the point estimates of leverage threshold is higher for more profitable firms irrespective of the measure chosen. In addition, Table 7 shows that the negative effect of excessive leverage on TFP growth is significantly higher in absolute value for less
profitable firms. In other words, more profitable firms are able to sustain significantly higher level of debts without hurting their productivity growth. The latter may highlight the higher cash flows of more profitable firms, which are taken into account in the trade-off theory. This suggests a positive relationship between profitability and optimal leverage. Bearing in mind that this result is not a formal test of the trade-off theory, the conclusion is nevertheless qualitatively similar to the theoretical prediction of the trade-off theory and the empirical results of Korteweg (2010). Previous studies using cross-sectional or panel regressions tend to find a negative relation between profitability and leverage (see e.g. Frank and Goyal (2009)). This is because high profits mechanically lower observed leverage ratios and previous studies rely on the implicit assumption that firms are always optimally levered. Strebulaev (2007) shows formally that cross-sectional regressions will produce misleading results on the relation between leverage and profitability. Specifically, he shows that even if firms in simulated economies follow the prescriptions of the dynamic trade-off theory, higher profitability lowers the current leverage of a firm unless it refinances in that period. Hence, the presence of frictions that result in firms diverging from their optimal capital structures may complicate empirical work on the trade-off theory. By contrast, the threshold model allows us to determine optimalleverage despite firms’ temporary deviations from the optimum.
Finally, we focus on the subsample of relatively larger firms, defined as firms with total assets above the sample median (see Table 10). Again, we restrict our attention to non-zero debt firms. The confidence interval for the debt ratio is 0.263-0.44616, against 0.312-0.397 for all non-zero debt
firms. As before, there is evidence that TFP falls if the leverage is above the upper threshold limit and this holds not only for larger firms, but also for all firms taken together. More interestingly, the point estimate of leverage threshold is 0.355 for larger firms (as against 0.361 for all firms taken together). In other words, there is evidence from our sample that the threshold level of leverage (beyond which productivity deteriorates) is somewhat smaller for larger firms than that for all firms. This is consistent with available empirical evidence that not only will larger firms be likely to have more debt, but also the marginal benefit of this debt is likely to be lower. This is an argument that goes back to the work of Titman and Wessels (1988) in a static framework and is also
16
For brevity, we do not report the full results. There was no significant threshold for smaller firms, i.e. firms with total assets below the median.
consistent with the more recent work of Strebulaev (2007) in a dynamic setting. As a result of this, one would expect that the threshold leverage for large firms to be smaller than all firms, as the beneficial effects of debt for firms who find it easy to raise debt, will be lower than for firms who find it more costly. Further, agency problems between firms and lenders are inherently different for large firms. Large firms are less likely to experience the constraints of long term debt, as banks are less likely to default, and more likely to be able to restructure debt rather than default (Gilson et al., 1990), such that the detrimental effects of debt on productivity will occur later for large firms than average.
3.5. Incidence of excess leverage
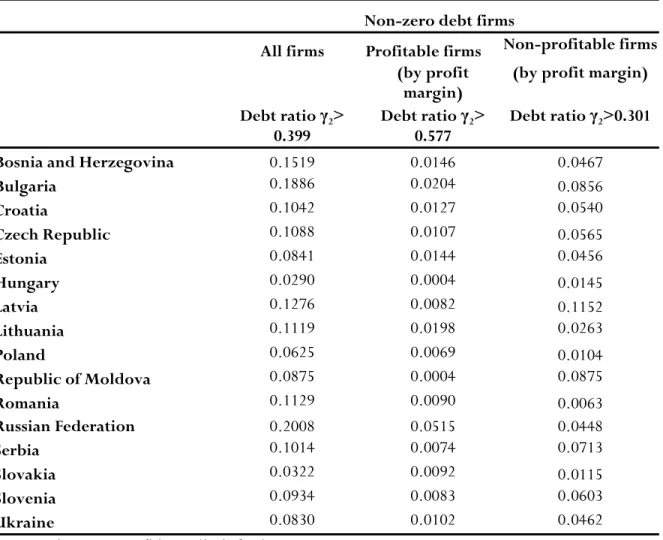
We use the leverage threshold estimates to calculate the percentage of firms above the upper threshold for the debt ratio (TDTA) in each of our sample countries. We obtain these estimates for all non-zero debt firms, but also for more and less profitable non-zero debt firms (where profitability is based on the profit margin). The results are summarized in Table 8.
[Insert Table 8 here]
There is evidence of a significant proportion of firms in most of our sample countries with debt ratios in excess of the upper debt threshold. There is also pronounced inter-country variation: considering all non-zero debt firms, the proportion of firms with excessive leverage is the highest in Russia (above 20% of firms), closely followed by Bulgaria (about 19% of firms). In contrast, the proportion of non-zero debt firms with excessive leverage is the lowest in Hungary (little less than 3%), closely followed by Slovakia (little above 3%). These results combined with the finding that many firms have zero leverage (see section 2.2) highlight the presence of a double puzzle, the puzzle of zero-leverage firms and the puzzle of overlevered firms. In columns 2 and 3 of Table 8, we split the sample to focus on more and less profitable firms. The figures suggest that the proportion of firms with excessive leverage is higher among relatively less profitable firms in most sample countries. However, Korteweg (2010) finds that the degree of overleverage is higher for
low-profit firms in a US sample, so this may not be a phenomenon that is limited to transition countries.
3.6. Robustness of threshold estimates
One criticism of the Hansen (2000) approach is that the variable of interest is often subject to the decision making process of the firm, and is therefore endogenous. Hence, the threshold estimates may be biased or inconsistent. In order to check the robustness of our original estimates, we replace the current debt ratio by instrumental variables and re-estimate the threshold model. This methodology requires one to identify appropriate instruments, in this case variables that are correlated with the current debt ratio, but uncorrelated with current productivity growth. Typically the literature has resorted to employing lags to resolve endogeneity issues (e.g., see Arellano and Bond, 1991). Accordingly we replace the current debt ratio by its lag. In addition, we employ a two-stage method where we first obtain the fitted value of the current debt ratio using the standard cross-sectional approach (See equation (A2) in Appendix 217) and then replace the current
debt ratio by its fitted value.
Clearly, both lagged and fitted debt ratios are strongly correlated with the actual debt ratios. In particular, the correlation between the current firm-level debt ratio and its lagged value is 0.2188 while that between current debt ratio and fitted debt ratio is 0.8091. In addition, both lagged and fitted debt ratios are uncorrelated with the error term in the TFP growth equation. This can be seen from the low correlation between these alternative leverage measures and the estimated error from the TFP growth equation (5). In particular, the correlation between the lagged debt ratio and the estimated residual is 0.035 and the correlation between the fitted debt ratio and the residual is 0.0945 in the sample of all firms.
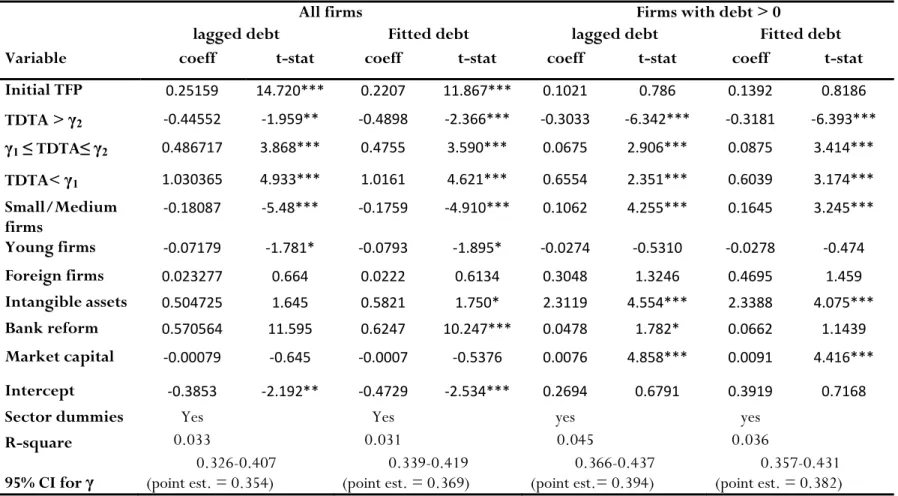
These alternative threshold estimates for the debt ratio (TDTA) are summarised in Table 9 for all
17
Note that the variables that explain the debt ratio in equation (A2) are not exactly the same as those determining TFP growth in equation (5). In particular, the log of total assets and the inflation rate are included in equation (A2), but not in equation (5). In addition, equation (5) includes initial TFP and also different bands of leverage depending on the two threshold limits obtained from the estimation of the threshold model. See further discussion in Appendix 2.
firms and indebted firms. Again they confirm the non-linear effects of leverage on TFP growth: while moderate leverage boosts productivity growth, excessive leverage (beyond the upper threshold limit) hampers productivity growth. The estimated confidence interval for lagged debt ratio is 0.326-0.407 for all firms and 0.366-0.437 for indebted firms. Similar threshold estimates are obtained when we replace current debt ratio by its fitted value. These are 0.339-0.419 and 0.357-0.431 respectively for all firms and all indebted firms. The corresponding estimates from the original threshold model were 0.330-0.386 and 0.312-0.397 respectively for all firms and indebted firms. In other words, these alternative threshold estimates for debt ratio for all firms and all indebted firms are within less than 5 percentage points of the estimates (0.386 and 0.397) using current debt ratio.
[Insert Table 9 here]
When leverage is instrumented using lagged leverage (fitted leverage), ceteris paribus, a firm with a debt ratio of 0.2 (i.e. below the lower threshold) reaps net benefits from leverage in the form of 13.1% (12.1%) extra TFP growth compared with an unlevered firm. For a firm with a debt ratio of 0.37 (in the mid-range), the net benefits amount to 2.5% (3.23%) of extra TFP growth. Finally, a firm with a debt ratio of 0.5 (i.e. an over-levered firm) has negative net benefits amounting to 15.2% (16%) of forgone TFP growth compared with an unlevered firm.
Table 10 provides an overview of all the debt ratio threshold estimates (both interval and point estimates) that we have obtained so far. All the results point to the existence of a non-linear relationship between leverage and TFP growth. The presence of a single threshold in each case is compatible with the theory of optimal capital structure, where the threshold is associated with maximum TFP growth. The estimates are robust to alternative leverage measures used in our analysis. The threshold estimates vary somewhat with firm characteristics, in particular profitability and size, in a way consistent with the trade-off theory of capital structure.
3.7. Threshold estimates for 2000-2006
and the recent financial crisis of 2007, which both had an impact on the CEE region, we estimate the threshold model for the subsample of “normal years” 2000-2006. The estimates for 2000-2006 are summarized in Table 10.
[Insert Table 10 here]
2000-2006 threshold estimates appear to be in line with those for the full sample 1999-2008 irrespective of whether we consider all firms or only indebted firms. For example, the lower threshold estimate is 0.336 in the full sample of all firms as opposed to 0.342 in the corresponding 2000-2006 sample. Similarly, the estimate of the upper threshold is 0.386 in the full sample of all firms compared to 0.377 in the 2000-2006 sample. In conclusion, the results do not appear to be driven by the choice of sample period.
4. Conclusions
The paper aims to bridge the gap between the literature on optimal capital structure and the wider macroeconomic literature on finance-growth nexus. On the basis of the trade-off theory of capital structure, we posit a non-monotonic relationship between leverage and productivity growth at the firm level. TFP growth is not only the most important metric in the macroeconomic growth literature; it has attracted increasing interest from the finance literature. We provide evidence supporting our hypothesis using a threshold regression model (Hansen, 2000). Estimates for a sample of Central and Eastern European countries confirm that TFP growth increases with book leverage until the latter reaches a critical threshold beyond which leverage becomes “excessive” and lowers TFP growth. This result points to the existence of an optimal leverage ratio where the net benefits of debt in terms of productivity gains are exhausted. Despite some variation depending on the sample and the measure of leverage, the estimates seem quite robust. The estimates of the slope coefficients for the three bands of leverage (low, intermediate and excessive) suggest that the productivity gains (costs) to leverage are substantial for underlevered (overlevered) firms. Book leverage is found to have similar non-monotonic effects on return on assets and return on equity.
Due to data limitations, our results are not a formal test of the trade-off theory. However, they suggest that the threshold regression approach is a promising methodology for the study of optimal capital structure and how the latter varies with firm characteristics. In contrast to existing empirical evidence based on observed leverage ratios, the threshold model allows us to endogenously determine optimal leverage despite firms’ temporary deviations from the optimum. Our results highlight a positive (negative) relationship between profitability (size) and optimal leverage, unlike existing studies that use traditional cross-sectional or panel regressions.
Using the leverage threshold estimates, we find evidence of a significant proportion of firms with debt ratios in excess of the upper debt threshold in our sample. Our results suggest that the proportion of firms with excessive leverage is higher among relatively less profitable firms in most sample countries. Korteweg (2010) finds that the degree of overleverage is higher for low-profit firms in a US sample, so this may not be a phenomenon that is limited to transition countries alone. Finally, we confirm the robustness of our estimates by using two instruments for the debt ratio, namely the lagged debt ratio and a fitted value of the debt ratio. Our results suggest that the baseline estimates only slightly underestimate the upper thresholds. Our results are also robust to the exclusion from our sample of two crisis episodes that significantly affected the CEE region.
References
Ang, J. B., 2008, A survey of recent developments in the literature of finance and growth, Journal of Economic Surveys, 22, 536–576.
Arcand, J.L., E. Berkes and U.Panizza, 2011, “Too Much Finance?”, mimeo.
Arellano, M. and Bond, S., 1991, Some Tests of Specification for Panel Data: Monte Carlo Evidence and an Application to Employment Equations, Review of Economic Studies 58 (2): 277-297.
Balasubramanyan, L. and R. Mohan, 2010, How well is productivity being priced?, Journal of Economics and Finance, Vol.34, 415–429
Bao, Ben-Hsienb and Da-Hsienb Bao (1989), An empirical investigation of the association between productivity and firm value, Journal of Business Finance and Accounting, Vol.16, pp.699-717. Barro, Robert, 1998, Determinants of Economic Growth: A Cross-Country Analysis, MIT Press. Berger, A. and di Patti, E. B., 2006, Capital structure and firm performance: a new approach to
testing agency theory and an application to the banking industry, Journal of Banking and Finance, 30, 1065-1102.
Bernanke, Ben S., Mark Gertler, and Simon Gilchrist, 1999, The financial accelerator in a quantitative business cycle framework, Handbook of Macroeconomics, in: J. B. Taylor & M. Woodford (ed.), Handbook of Macroeconomics, edition 1, volume 1, chapter 21, pages 1341-1393
Brücker, H. Schröder, P.J.H. and Weise C., 2005, Can EU conditionality remedy soft budget constraints in transition countries?, Journal of Comparative Economics, 33, 371-386.
Booth, L.V., Demirgüc-Kunt, A. and Maksimovic, V. (2001) Capital structure in developing countries. Journal of Finance 56, 87–130.
Campbell, John Y., and Robert J. Shiller, 2001, Valuation Ratios and the Long-Run Stock Market Outlook: An Update, Cowles Foundation Discussion Paper No. 1295.
Coricelli F. (1996), “Finance and growth in economies in transition ”, European Economic Review, 40 (3-5), pp.645-653.
Driffield, N. and S. Pal., 2010, ‘Evolution of Capital Structure in East Asia: Corporate Inertia or Endeavours?, Journal of the Royal Statistical Society (Series A), 173, 1–29.
Dewatripont, Mathias and Eric Maskin, 1995, Credit and Efficiency in Centralized and Decentralized Economies, The Review of Economic Studies, 62, 541-55.
Dwyer Douglas W, 2001, Plant-Level Productivity and the Market Value of a Firm, Working Papers 01-03, Center for Economic Studies, U.S. Census Bureau.
Easterly, W., and Levine, R., 2001, It’s Not Factor Accumulation: Stylized Facts and Growth Models, World Bank Economic Review, 15 (2): 177-219.
Eicher, T.S. and T. Schreiber, 2010, Structural policies and growth: Time series evidence from a natural experiment, Journal of Development Economics, 91, 169-179.
Fama, E. and K.R. French, 2002a, Testing Trade-Off and Pecking Order Predictions about Dividends and Debt, Review of Financial Studies, 15, 1-33.
Fama, Eugene F., and Kenneth R. French, 2002b, “The Equity Premium,” Journal of Finance 57, 637-659
Flannery, M.J. and K. Rangan, 2006, Partial adjustment toward target capital structures, Journal of Financial Economics, 79, 469-506.
Frank, M.Z. and V.K. Goyal, 2003, Testing the Pecking Order Theory of Capital Structure, Journal of Financial Economics, 67, 217-248.
Frank, Murray Z., and Vidhan K. Goyal, 2009, Capital Structure Decisions: Which Factors are Reliably Important? Financial Management,38, 1-37.
Girma, Sourafel, 2005, Absorptive Capacity and Productivity Spillovers from FDI: A Threshold Regression Analysis, Oxford Bulletin of Economics and Statistics, 67, 281-306.
Henry, M., R. Kneller, C. Milner and S. Girma, 2012, Do Natural Barriers Affect the Relationship between Trade Openness and Growth? Oxford Bulletin of Economics and Statistics, 74, 1-19. Gilson, S. C., Kose John, Larry H.P. Lang, Troubled debt restructurings: An empirical study of
private reorganization of firms in default, Journal of Financial Economics, Volume 27, Issue 2, October 1990, Pages 315-353
Gourinchas, Pierre-Olivier, Rodrigo Valdes, and Oscar Landerretche, 2001, Lending Booms: Latin America and the World, Economia, Spring, 1, 47-99.
Griffith, R., 1999, Using the ARD establishment level data to look at foreign ownership and productivity in the United Kingdom, Economic Journal, 109, 416-42.
Hall, R. E. and Jones, C. I, 1999, Why Do Some Countries Produce So Much More Output per Worker than Others?, Quarterly Journal of Economics, 114: 83-116.
Hansen, Bruce E., 2000, Sample splitting and threshold estimation, Econometrica, 68, 575–603. Henry, Michael & Kneller, Richard & Milner, Chris, 2009, Trade, technology transfer and
national efficiency in developing countries, European Economic Review, Elsevier, vol. 53(2), 237-254.
Imrohoroglu, A. and S. Tüzel, 2011, Firm Level Productivity, Risk, and Return (February 25, 2011). Available at SSRN: http://ssrn.com/abstract=1770264 or doi:10.2139/ssrn.1770264 Jensen, Michael C., 1986, Agency costs of free cash flow, corporate financing, and takeovers,
American Economic Review 76, 323-329.
Jensen, Michael C., and William H. and Mecklin, 1976, Theory of the firm: Managerial behavior, agency costs, and ownership structure, Journal of Financial Economics, 3, 305-360.
Kaminsky, G. and C. Reinhart, 1999, The Twin Crises: The Causes of Banking and Balance-of-Payments Problems, American Economic Review, 89, 473-500.
Kaplan, R.S., 1983, ‘Measuring Manufacturing Performance: A New Challenge for Managerial Accounting Research’, The Accounling Review, October, 685-705.
Kiyotaki, N. and J. Moore, 1997, Credit Cycles, Journal of Political Economy, 105, 211-248
Klenow, P., and Rodriguez-Clare, A, 1997, The Neo-Classical Revival In Growth Economics: Has It Gone Too Far?, NBER Macroeconomics Annual 1997, 12: 73-103.
Köke, J. and L. Renneboog, 2005, Do corporate control and product market competition lead to stronger productivity growth? Evidence from market-oriented and blockholder-based governance regimes, Journal of Law and Economics 48, 475-516.
Konings, J., Rizov, M and Vandenbussche, H., 2003, Investment and financial constraints in transition economies: micro evidence from Poland, the Czech Republic, Bulgaria and Romania, Economics Letters, 78, 253-258.
Korajczyk, Robert A., and Amnon Levy, 2003, Capital structure choice: Macroeconomic conditions and financial constraints, Journal of Financial Economics, 68, 75–109.
Kornai, J. ‘Economics of Shortage’, North-Holland, Amsterdam, 1980
Korteweg, Arthur, 2010, The Net Benefits to Leverage, Journal of Finance, 65, 2137-2170.
Kourtellos, A., T. Stengos and C. Tan, 2009, THRET: Threshold Regression with Endogenous Threshold Variables, Journal of Econometrics (forthcoming)
Kraus, Alan, and R. Litzenberger, 1973, A state-preference model of optimal financial leverage,
Journal of Finance 28, 911-922.
Kurshev, Alexander, and Ilya A. Strebulaev, 2006, Firm size and leverage, Working paper, Stanford University.
Levinsohn, J. and Petrin, A., 2003, Estimating production functions using inputs to control for unobservables, Review of Economic Studies, 70, 317-341.
McGuckin, R. H. and Nguyen, S. V., 1995, On Productivity and Plant Ownership Change: New Evidence from the LRD, RAND Journal of Economics 26, 257-76.
Maksimovic, V. and Phillips, G., 2002, Do Conglomerate Firms Allocate Resources Inefficiently? Evidence from Plant-Level Data, Journal of Finance 57, 721-767.
McKinsey Global Institute, 2010, Beyond Austerity: A path to economic growth and renewal in
Europe, October.
Modigliani, F. and Miller, M. H., 1958, The Cost of Capital, Corporate Finance and the Theory of Investment, American Economic Review, 48, 261-97.
Myers, Stewart C., 1977, Determinants of Corporate Borrowing, Journal of Financial Economics, 5,147-75
Myers, S.C., 1984, The capital structure puzzle, Journal of Finance, 39, 575–592. Olley, S. and A. Pakes, 1996, The Dynamics of Productivity in the Telecommunications Equipment Industry, Econometrica, 64, 1263-98.
Rajan, Raghuram and Luigi Zingales, 1995, What Do We Know About Capital Structure? Some evidence from international data, Journal of Finance, 50, 1421-1460.
Rajan, Raghuram and Luigi Zingales, 1998, Financial dependence and growth, American Economic Review, 88, 559-586.
Reinhart, C. M. and K. S. Rogoff, 2010, "Growth in a Time of Debt," NBER Working Papers 15639
Riahi-Belkaoui, Ahmed, 1999, Productivity, Profitability, and Firm Value, Journal of International Financial Management and Accounting, Vol.10, 188-201.
Schleifer, Andrei, and Robert W. Vishny, 1992, Liquidation values and debt capacity: A market equilibrium approach, Journal of Finance, 47, 1343-1366.
Schoar, A., 2002, Effects of Corporate Diversification on Productivity, Journal of Finance, Vol.57, 2379-2403
Shyam-Sunder, L., and S.C. Myers, 1999, Testing static tradeoff against pecking order models of capital structure, Journal of Financial Economics, 51, 219–244.
Strebulaev, Ilya, and Baozhong Yang, 2006, The Mystery of Zero-Leverage Firms, Working Paper, Stanford Graduate School of Business, Stanford University
Strebulaev, Ilya, 2007, Do Tests of Capital Structure Theory Mean What They Say?, Journal of Finance, 62, 1747-1788.
Titman, S. and Wessels, R. (1988) The Determinants of Capital Structure Choice The Journal of Finance, Vol. 43, No. 1. pp. 1-19.
Table 1: Cross-country variation in leverage 1999-2008
All firms debt firms Non-zero
TLTA TDTA TLTA TDTA
Country Firms Total obs. Zero debt (%)
Missing debt
(%) Mean SD Mean SD Mean Mean Bosnia and Herzegovina 146 1362 19.5 20.7 0.36 0.27 0.11 0.14 0.38 0.13
Bulgaria 232 2034 16.7 27.6 0.42 0.24 0.13 0.16 0.45 0.17 Croatia 135 1264 5.8 87.7 0.39 0.23 0.08 0.14 0.42 0.14 Czech Republic 71 642 10.7 38.3 0.41 0.20 0.12 0.13 0.44 0.15 Estonia 10 94 2.1 40.4 0.40 0.24 0.16 0.14 0.45 0.17 Hungary 22 203 8.9 53.2 0.39 0.18 0.10 0.12 0.39 0.12 Latvia 26 239 12.1 34.3 0.45 0.24 0.20 0.22 0.52 0.25 Lithuania 30 281 3.2 49.1 0.46 0.19 0.20 0.17 0.48 0.21 Poland 159 1467 16.4 52.1 0.47 0.19 0.10 0.13 0.52 0.15 Republic of Moldova 195 1806 21.0 46.5 0.33 0.25 0.11 0.17 0.43 0.19 Romania 236 2062 44.9 26.8 0.47 0.23 0.05 0.10 0.52 0.12 Russian Federation 656 6021 15.4 34.5 0.46 0.25 0.15 0.18 0.50 0.20 Serbia 742 6925 15.1 13.2 0.40 0.26 0.12 0.16 0.42 0.15 Slovak Republic 124 1137 5.7 33.0 0.44 0.21 0.12 0.12 0.45 0.13 Slovenia 56 526 1.3 78.9 0.40 0.18 0.18 0.16 0.43 0.19 Ukraine 391 1443 17.1 2.6 0.42 0.25 0.14 0.16 0.45 0.17 All 3231 27506 16.9 31.1 0.42 0.25 0.12 0.16 0.45 0.16
Table 2: Distribution of debt among firms with positive debt 1999-2008 in our sample
Leverage percentiles Average leverage by size
Country 25% 50% 75% 90% 95% 99% Small Large Corr(size, leverage) Bosnia and Herzegovina 0.03 0.07 0.19 0.32 0.42 0.61 0.11 0.12 0.02
Bulgaria 0.04 0.12 0.24 0.42 0.51 0.68 0.08 0.19 0.13 Croatia 0.03 0.11 0.19 0.33 0.46 0.89 0.04 0.15 0.20 Czech Republic 0.04 0.12 0.21 0.32 0.39 0.62 0.11 0.13 0.02 Estonia 0.02 0.18 0.28 0.36 0.44 0.48 0.16 0.20 0.09 Hungary 0.01 0.07 0.17 0.29 0.44 0.54 0.09 0.10 0.01 Latvia 0.07 0.19 0.35 0.62 0.71 0.85 0.22 0.15 -0.17 Lithuania 0.07 0.19 0.32 0.45 0.53 0.66 0.20 0.20 0.05 Poland 0.05 0.12 0.22 0.33 0.40 0.59 0.11 0.11 0.03 Republic of Moldova 0.04 0.13 0.30 0.46 0.56 0.72 0.06 0.18 0.21 Romania 0.04 0.08 0.17 0.28 0.34 0.55 0.04 0.06 0.12 Russian Federation 0.05 0.13 0.29 0.47 0.58 0.75 0.14 0.17 0.01 Serbia 0.03 0.09 0.21 0.38 0.49 0.69 0.09 0.17 0.17 Slovak Republic 0.04 0.10 0.18 0.29 0.35 0.58 0.10 0.16 -0.01 Slovenia 0.05 0.16 0.32 0.42 0.47 0.73 0.21 0.18 -0.13 Ukraine 0.03 0.11 0.25 0.41 0.51 0.71 0.13 0.12 -0.01
Table 3: Quality of Financial Institutions, 1999-2008
Country Stock market capitalization Banking reform index Bosnia & Herzegovina 44.54 2.53 Bulgaria 15.74 3.38 Croatia 32.62 3.70 Czech Republic 23.97 3.74 Estonia 30.03 3.85 Hungary 25.10 4.00 Latvia 9.40 3.58 Lithuania 18.18 3.34 Poland 23.87 3.46 Moldova 26.92 2.56 Romania 13.04 2.91 Russia 59.49 2.15 Serbia 23.21 2.09 Slovakia 7.09 3.41 Slovenia 26.17 3.30 Ukraine 21.54 2.46 All 31.08 2.65
Note: Banking reform index: Average EBRD index of banking sector reform (1 to 4.3, with a higher number indicating a better score); Stock market
Table 4: Threshold estimates for total factor productivity growth, all firms
(1) Debt ratio (2) Liability ratio
Variable Coefficient t-statistic Variable Coefficient t-statistic
Initial TFP 0.1094 0.8432 Initial TFP 0.1357 0.8421
TDTA>0.386 -0.0247*** -3.4236 TLTA>0.403 -0.1676** -2.2951
0.330≤TDTA≤0.386 0.0966*** 2.5993 0.339≤ TLTA≤0.403 0.0575** 2.0061
TDTA<0.330 0.3249* 1.737 TLTA <0.339 0.3349** 2.4239
Small/Medium
firms 0.1644*** 3.2732 Small/Medium firms 0.1273*** 2.8871 Young firms -0.0027 -0.0866 Young firms -0.0057 -0.1393
Foreign firms 0.2965 1.4025 Foreign firms 0.3415 1.3094
Intangible assets 0.2535*** 4.4287 Intangible assets 0.204*** 3.0401
Bank Reform 0.0963** 2.383 Bank reform 0.0941*** 2.7301
Market capitalization 0.0085*** 3.7362 Market capitalization 0.0095*** 4.0223 Intercept 0.4183* 1.817 Intercept 0.4368 1.2236
Sector dummies yes Sector dummies Yes
R-square 0.0395 R-square 0.0436
95% CI for γ 0.330-0.386
(point est.= 0.364) 95% CI for
γ 0.339-0.403
(point est.=0.387)
Observations 7276 Observations 7276
Table 5: Threshold estimates for total factor productivity growth, firms with outstanding debt > 0 Variable
(1) Debt ratio
Coefficient t-statistic Variable
(2) Liability ratio Coefficient t-statistic Initial TFP 0.1246 1.434 Initial TFP 0.1606 1.0525 TDTA>0.397 -0.4711*** -4.4027 TLTA >0.429 -0.3591*** -4.1582 0.312≤TDTA≤0.397 0.0848*** 4.0394 0.366≤ TLTA ≤0.429 0.1007** 2.2809 TDTA<0.312 0.2121*** 3.9798 TLTA <0.366 0.5063*** 4.9196
Small/Medium firms 0.2827*** 3.2036 Small/Medium firms 0.2183*** 3.7566
Young firms -0.0184 -0.6056 Young firms -0.0104 -0.3224
Foreign firms 0.4598* 1.7453 Foreign firms 0.4722* 1.8367
Intangible assets 0.1461*** 3.0295 Intangible assets 0.1103*** 3.4344
Bank reform 0.0584* 1.7651 Bank efficiency 0.0498** 2.2909
Market capitalization 0.0144* 1.9062 Market capitalization 0.0079*** 4.508
Intercept 0.3079 1.4412 Intercept 0.2503 0.5869
Sector dummies Yes Sector dummies Yes
R-square 0.038 R-square 0.0609
95% CI for γ (point est. = 0.368) 0.312-0.397 95% CI for γ2 (point est. =0.391) 0.366-0.429
Observations 7276 7276
Table 6. Threshold estimates of ROA and ROE for indebted firms
Dependent variable: ROA Using debt ratio Using liability ratio
Variable Coefficient t-statistic Variable Coefficient t-statistic
TDTA>0.629 -0.07611 -10.103** TLTA >0.578 -0.0196 -2.989 **
0.271≤TDTA ≤0.629 0.0686 0.4048 0.246≤TLTA ≤0.58 0.0887 9.754 **
TDTA <0.271 0.044559 1.7081* TLTA<0.246 0.4319 11.563 **
Other control variables Yes Yes Other control variables Yes Yes
95% CI for γ 0.271 -0.629 (point est.=0.458) 95% CI for γ 0.246-0.578 (point est. = 0.406)
Dependent variable:ROE Using debt ratio Using liability ratio
Variable Coefficient t-statistic Variable Coefficient t-statistic
TDTA>0.629 -0.0835 -3.014** TLTA >0.601 -0.0676 -1.555**
0.326≤TDTA ≤0.582 0.1312 2.668** 0.331≤TLTA ≤0.601 0.0196 1.634**
TDTA <0.271 0.1473 2.812** TLTA<0.331 0.0611 2.461**
Other control variables Yes Yes Other control variables Yes Yes
95% CI for γ (point est.=0.469) 0.326 -0.582 95% CI for γ (point est.= 499) 0.331-0.601
Table 7: Threshold estimates for TFP growth for profitable and non-profitable firms (indebted firms only)
profit margin < 0.04 profit margin > 0.04 ROCE < 0.04 ROCE > 0.04
Variable Coefficient t-stat Coefficient t-stat Coefficient t-stat Coefficient t-stat Initial TFP 0.0282 0.1882 0.2513 0.8998 0.0111 0.0785 0.2218 1.0221 TDTA > γ2 -0.5383*** -2.871 -0.0205*** -3.7415 -0.6522*** -3.1142 -0.1924** -2.5415 γ1≤ TDTA≤γ2 0.7244** 2.4022 0.074* 1.8906 -0.0035 -0.0122 0.1114*** 2.9813 TDTA< γ1 0.297*** 3.4799 0.1978* 1.7339 0.5892** 2.2228 0.1943* 1.7429 Small/medium firms 0.0851 0.9762 0.1994*** 3.2601 0.0995*** 2.9089 0.0998** 2.4722 Young firms -0.2595** -2.1802 0.0105 0.1656 -0.1512** -2.0046 0.0091 0.1824 Foreign firms 0.1295 0.4785 0.61** 2.2618 0.1606 0.6445 0.6175*** 2.9946 Intangible assets 0.1692*** 3.0924 0.2001*** 2.6732 0.0977*** 3.0465 0.3336*** 4.4063 Bank efficiency 0.2476*** 2.8049 0.0343 1.471 0.2102 1.4692 0.0243 1.0896 Market capitalization 0.0123 1.3506 0.0108*** 3.7178 0.0075 0.7625 0.0066*** 4.5869
Sector dummies Yes Yes Yes Yes
Intercept -0.4456 -0.6346 0.5858 1.4961 -0.3274 -0.357 0.3975 1.0763
R-square 0.0543 0.059 0.06 0.076
95% CI for γ 0.207-0.314
(point est. = 0.266) (point est.= 0.520) 0.469-0.601 (point est. = 0.411) 0.337-0.502 (point est.= 0.578) 0.477-0.695
Note: *** p-value<0.01, ** p-value<0.05, * p-value<0.1; γ1 , γ2 are respectively the lower and upper confidence limits for leverage. See