EVALUATION AND ASSIGNMENT OF SIGNIFICANCE LEVELS TO PEPTIDE IDENTIFICATIONS FROM THE DATABASE SEARCH PROGRAMS USING
RESAMPLING APPROACH
BY
MALIK NADEEM AKHTAR
DISSERTATION
Submitted in partial fulfillment of the requirements for the degree of Doctor of Philosophy in Animal Sciences
in the Graduate College of the
University of Illinois at Urbana-Champaign, 2014
Urbana, Illinois
Doctoral Committee:
Professor Sandra L. Rodriguez-Zas, Chair Professor Jonathan V. Sweedler
Assistant Professor Maria B. Villamil Professor Gustavo Caetano-Anolles
ii ABSTRACT
A novel application of Monte Carlo permutation testing that improves the calculation of the peptide match significance levels and detection rate in database search programs is demonstrated. Novel k-permuted decoy databases (where k denotes the type and number of permutations) were evaluated for accurate computation of match significance levels. K-permuted decoy databases were generated by: (a) complete permutations of peptide sequences (Whole), (b) permutation of terminal positions of peptide sequences (End), and (c) permuted peptides that fall within a certain mass tolerance of the tandem mass spectra (Mass-based). The ‘Whole’ and ‘End’ based permutation tests were performed using various indicators of peptide match quality in OMSSA, Crux, and X! Tandem on manually annotated neuropeptide tandem mass spectrometry spectra. Permutation p-values were calculated as the fraction of the permutations in the k-permuted databases with match indicator score as extreme as the original spectra match in the target database. The ‘Whole’ k-permuted decoy databases identified most (up to 100%) neuropeptides, while the ‘End’ k-k-permuted decoy databases provided better discrimination of the performance between the match indicators. The permutation test based p-values using the hyperscore (X! Tandem), E-value (OMSSA) and Sp score (Crux) match indicators outperformed the other match indicators in the database search programs. The simple indicator of match “the number of matched ions” provided performance comparable to the best match indicators in the OMSSA, X! Tandem, and Crux. Databases of least 105 k-permuted decoy peptides per spectra provided accurate p-values. Overall, the ‘Whole’ and ‘End’ k-permuted decoy databases improved the consensus among the database search programs.
iii
The ability of the k-permuted decoy databases to improve the classifications among correct and incorrect peptide matches was evaluated with ‘Mass-based’ k-permuted decoy database using best match indicator in the OMSSA (i.e., E-value). The evaluation was performed by searching 5806 tryptic tandem mass spectra (671 with annotated peptide entries) against the standard target and combined target-decoy databases. False discovery rate estimates based on the target-decoy approach and known identities of the annotated spectra were used to filter the peptide-spectrum matches. The k-permuted decoy database approach enabled the detection of up to 89% and 87% annotated peptides relative to the OMSSA’s E-value with 82% and 84% identifications in the target database and target-decoy database, respectively. Improvements in performance was due to better performance of the k-permutation decoy database on small and large peptides with less than 13 matched fragment ions and large (insignificant) OMSSA E-values.
iv
ACKNOWLEDGEMENTS
I owe my deepest gratitude to GOD Almighty who bestowed me with his blessings. I am very thankful to many people for their continuous support and inspiration throughout my graduate studies. I would like to thank my adviser Dr. Sandra L. Rodriguez-Zas, for her support, insightful comments and guidance, encouragement, patience, and her dedication during my entire Masters and Doctoral studies. I would like to thank Dr. Bruce R. Southey, whose passion, patience, support, advice, and humor made things easy for me more than I can even remember. I would like to thank my doctoral committee members, Dr. Jonathan V. Sweedler, Dr. Maria B. Villamil, and Dr. Gustavo Caetano-Anolles for their crucial advice, support, encouragement, and feedback during my preliminary and final examinations. I would like to thank Dr. Alfred Roca, for being always helpful, for being on my preliminary committee, and for acting as my research adviser in the Department of Animal Sciences during the annual graduate student evaluations. I would like to thank my lab members, Dianelys Gonzalez, Scott Nixon, Cynthia Zavala, Kelsey Caetano-Anolles, Kristin Delfino, and Robmay Garcia for their continuous support and friendship. I would like to thank my family and friends, for their love and support throughout the graduate studies. I would like to thank NIH (Grant Numbers: R21 DA027548, P30 DA018310 and R21 MH096030) for their support. I would like to thank COMSATS Institute of Information Technology (CIIT), for providing me an opportunity to become a part of international community of graduate students at University of Illinois Urbana-Champaign.
v
TABLE OF CONTENTS
LIST OF FIGURES ... VII LIST OF TABLES ... VIII
CHAPTER I: LITERATURE REVIEW ... 1
1.1 NEUROPEPTIDES ... 1
1.2 MASS SPECTROMETRY BASED PROTEOMICS AND PEPTIDOMICS ... 3
1.3 DATABASES OF PROHORMONES AND NEUROPEPTIDES SEQUENCE AND SPECTRAL DATA ... 7
1.4 PEPTIDE IDENTIFICATION BY TANDEM MASS SPECTROMETRY ... 14
1.5 OVERVIEW OF THE DATABASE SEARCH APPROACH ... 16
1.6 REVIEW OF SELECTED DATABASE SEARCH PROGRAMS ... 20
1.7 FACTORS AFFECTING PEPTIDE IDENTIFICATION ... 27
1.8 FDR VIA TARGET-DECOY APPROACH ... 32
1.9 GENERATION OF DECOY PEPTIDES ... 33
1.10 PERMUTATION TEST ... 35
1.11 FIGURES ... 38
CHAPTER II: ACCURATE ASSIGNMENT OF SIGNIFICANCE TO NEUROPEPTIDE IDENTIFICATIONS USING MONTE CARLO K-PERMUTED DECOY DATABASES ... 42
2.1 NOTES AND ACKNOWLEDGMENTS ... 43
2.2 ABSTRACT ... 44
2.3 INTRODUCTION ... 45
2.4 MATERIALS AND METHODS ... 48
2.5 RESULTS AND DISCUSSION ... 53
2.6 CONCLUSIONS ... 64
2.7 FIGURES ... 66
2.8 TABLES ... 68
CHAPTER III: IDENTIFICATION OF BEST INDICATORS OF PEPTIDE-SPECTRUM MATCH USING A PERMUTATION RESAMPLING APPROACH ... 74
3.1 NOTES AND ACKNOWLEDGMENTS ... 75
3.2 ABSTRACT ... 76
3.3 INTRODUCTION ... 77
3.4 THEORETICAL-OBSERVED SPECTRA MATCH INDICATORS ... 79
3.5 OBSERVED SPECTRA, TARGET AND DECOY DATABASES ... 80
3.6 RESULTS AND DISCUSSION ... 82
3.7 COMPARISON OF SPECTRA MATCH INDICATORS AND DATABASE SEARCH SOFTWARE ... 88
3.8 CONCLUSIONS ... 89
3.9 FIGURES ... 91
3.10 TABLES ... 94
CHAPTER IV: EVALUATION OF RESAMPLING APPROACH FOR THE TRYPTIC PEPTIDE IDENTIFICATION IN TANDEM MASS SPECTROMETRY EXPERIMENTS USING DATABASE SEARCH APPROACH ... 98
vi
4.1 NOTES AND ACKNOWLEDGMENTS ... 99
4.2 ABSTRACT ... 100
4.3 INTRODUCTION ... 101
4.4 MATERIALS AND METHODS ... 103
4.5 RESULTS AND DISCUSSION ... 109
4.6 CONCLUSIONS ... 116
4.7 FIGURES ... 118
4.8 TABLES ... 119
CHAPTER V: CONCLUSION ... 123
vii
LIST OF FIGURES
CHAPTER I
FIGURE 1.1.CLASSICAL AND NONCLASSICAL NEUROPEPTIDE PROCESSING SCHEME.. ... 38
FIGURE 1.2.TANDEM MASS SPECTROMETRY (MS/MS).. ... 39
FIGURE 1.3.GENERAL VIEW OF THE EXPERIMENTAL STEPS AND FLOW OF THE DATA IN SHOTGUN PROTEOMICS
ANALYSIS.. ... 40
FIGURE 1.4.TANDEM MASS SPECTROMETRY (MS/MS) DATABASE SEARCHING.. ... 41 CHAPTER II
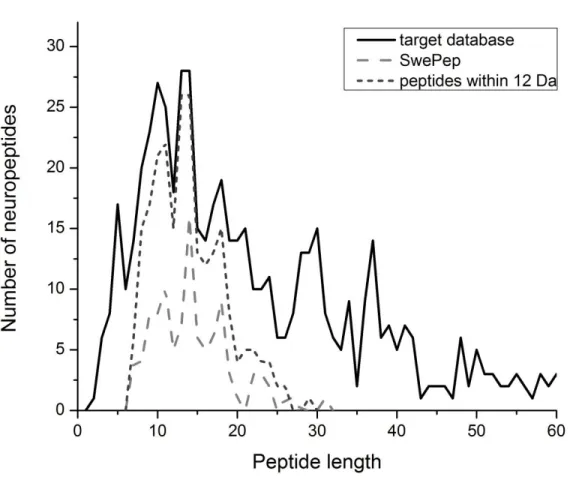
FIGURE 2.1.DISTRIBUTION OF NEUROPEPTIDES LENGTH IN TARGET DATABASE PEPTIDES LESS THAN 60 AMINO ACID IN LENGTH ARE SHOWN,103MS/MS PEPTIDES, AND 236 PEPTIDES THAT FALL WITHIN ±12DA OF THE SWEPEP PEPTIDES. ... 66
FIGURE 2.2.FREQUENCY (NUMBER) OF SPECTRA WITH 1 TO 10 HOMEOMETRIC MATCHES FOR K106 K-PERMUTED DECOY DATABASES ACROSS THE THREE DATABASE SEARCH PROGRAMS (X!TANDEM,OMSSA, AND CRUX). ... 67
CHAPTER III
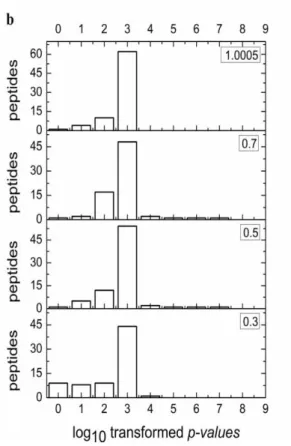
FIGURE 3.1. BOX PLOTS OF CRUX XCORR SCORES (A) AND NUMBER OF PEPTIDES CORRECTLY IDENTIFIED AT DIFFERENT
-1*LOG10-TRANSFORMED WEIBULL P-VALUES (B) USING “MZ-BIN-WIDTH” VALUES OF 0.3,0.5,0.7, AND
1.0005. ... 91 FIGURE 3.2.BOX PLOTS DEPICTING THE DISTRIBUTION OF NUMBER OF CANDIDATE DECOY PEPTIDES WITHIN PRECURSOR
MASS TOLERANCE PER QUERIED OBSERVED PEPTIDE CONSIDERED BY CRUX,OMSSA, AND X!TANDEM FOR THE
(A)ENDS2 AND (B)ENDS3 PERMUTED DECOY DATABASES. ... 92
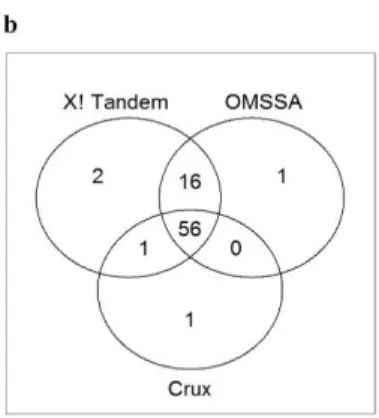
FIGURE 3.3.DISTINCT AND SHARED NUMBER OF PEPTIDE DETECTED IN THE ENDS3 DECOY DATABASE USING A) THE NUMBER OF MATCHED IONS OR B) THE BEST INDICATOR FOR EACH DATABASE SEARCH PROGRAM (OMSSA
E-VALUE,CRUX SP SCORE, AND X!TANDEM HYPERSCORE). ... 93 CHAPTER IV
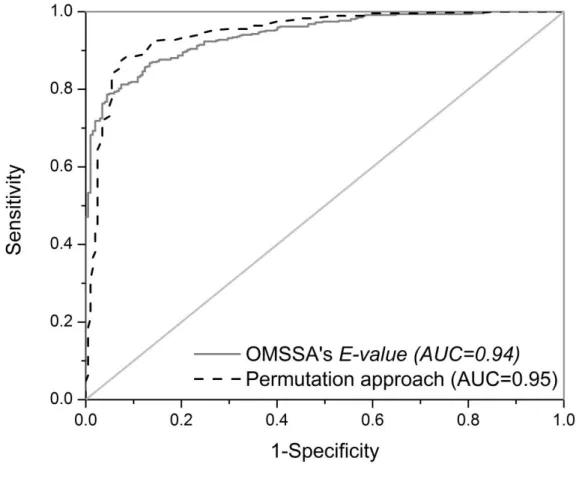
FIGURE 4.1.ROC CURVES FOR VARIOUS MATCH INDICATORS IN THE TARGET AND PERMUTED DATABASES.PLOT COMPARES DISCRIMINATORY POWERS OF TARGET DATABASE VERSUS PERMUTED DATABASE USING PERMUTED P -VALUES FROM THE OMSSA’S E-VALUE INDICATORS AGAINST TARGET DATABASE E-VALUE. ... 118
viii
LIST OF TABLES
CHAPTER II
TABLE 2.1.PEPTIDE DETECTION SIGNIFICANCE LEVELS USING IDEAL SIMULATED SPECTRA OF THE 103 PEPTIDES WITH AND WITHOUT ANY POST-TRANSLATIONAL MODIFICATIONS (PTMS) AND ALL B- AND Y-IONS INCLUDING NEUTRAL MASS LOSSES AGAINST A STANDARD TARGET DATABASE ACROSS DATABASE SEARCH PROGRAMS (OMSSA,X!
TANDEM, AND CRUX)... 68
TABLE 2.2.PEPTIDE DETECTION SIGNIFICANCE LEVELS USING EXPERIMENTAL SPECTRA OF THE 103 PEPTIDES WITH AND WITHOUT ANY POST-TRANSLATIONAL MODIFICATIONS (PTMS) AGAINST A STANDARD TARGET DATABASE ACROSS DATABASE SEARCH PROGRAMS (OMSSA,X!TANDEM, AND CRUX). ... 69
TABLE 2.3.PERFORMANCE OF THE TARGET AND ALTERNATIVE K-PERMUTED DECOY DATABASES USED WITH THE X!
TANDEM DATABASE SEARCH PROGRAM USING SPECTRA FROM 80 UNMODIFIED NEUROPEPTIDES. ... 70
TABLE 2.4.PERFORMANCE OF THE TARGET AND ALTERNATIVE K-PERMUTED DECOY DATABASES USED WITH THE CRUX DATABASE SEARCH PROGRAM USING SPECTRA FROM 80 UNMODIFIED NEUROPEPTIDES. ... 71
TABLE 2.5.PERFORMANCE OF THE TARGET ALTERNATIVE K-PERMUTED DECOY DATABASES USED WITH THE OMSSA DATABASE SEARCH PROGRAM USING SPECTRA FROM 80 UNMODIFIED NEUROPEPTIDES. ... 72
TABLE 2.6.COMPUTATION TIMES GIVEN IN SECONDS FOR SEARCH OF 80 UNMODIFIED SPECTRA AGAINST DIFFERENT DATABASES USING A SINGLE PROCESS INTEL®CORE™ [email protected]. ... 73
CHAPTER III
TABLE 3.1. CRUX,X!TANDEM, AND OMSSA MATCH INDICATORS USED. ... 94 TABLE 3.2.NUMBER OF PEPTIDES MATCHED AT VARIOUS SIGNIFICANCE LEVELS OF THE LOG10-TRANSFORMED E- OR P
-VALUES WHEN THE OPTIMAL SIMULATED SPECTRA AND REAL TANDEM SPECTRA WERE SEARCHED AGAINST THE STANDARD TARGET DATABASE. ... 95 TABLE 3.3.NUMBER OF PEPTIDES DETECTED BY SPECTRA MATCH INDICATORS FROM DATABASE SEARCH PROGRAMS
ACROSS LOG10-TRANSFORMED P-VALUES LEVELS OF THE COMPUTED USING THE END DECOY DATABASES. ... 96
TABLE 3.4. NUMBER OF PEPTIDES DETECTED BY SPECTRA MATCH INDICATORS FROM DATABASE SEARCH PROGRAMS USING THE TARGET AND ENDS3 DECOY DATABASES. ... 97
CHAPTER IV
TABLE 4.1.THE NUMBER OF CORRECTLY AND INCORRECTLY MATCHED ANNOTATED SPECTRA IN THE TARGET AND CONCATENATED TARGET-REVERSE DATABASES, IRRESPECTIVE OF THE MATCH SIGNIFICANCE LEVELS ACROSS THREE PRECURSOR CHARGE STATES. ... 119
TABLE 4.2.SENSITIVITY OF THE OMSSA’S E-VALUE AND K-PERMUTED DECOY DATABASE AT 5%FALSE DISCOVERY
ix
CHAPTER IV(CONT.)
TABLE 4.3.THE NUMBER OF SPECTRA SIGNIFICANTLY DETECTED BY BOTH OMSSA’S E-VALUE AND K-PERMUTED DECOY DATABASE, K-PERMUTED DECOY DATABASE ONLY,OMSSA’S E-VALUE ONLY, AND NOT DETECTED BY ANY
APPROACH IN THE TARGET DATABASE AT A FALSE DISCOVERY RATE OF 5%. ... 121
TABLE 4.4.SENSITIVITY OF THE OMSSA’S E-VALUE AND K-PERMUTED DECOY DATABASE AT 5%FALSE DISCOVERY
1 CHAPTER I: LITERATURE REVIEW
1.1 NEUROPEPTIDES
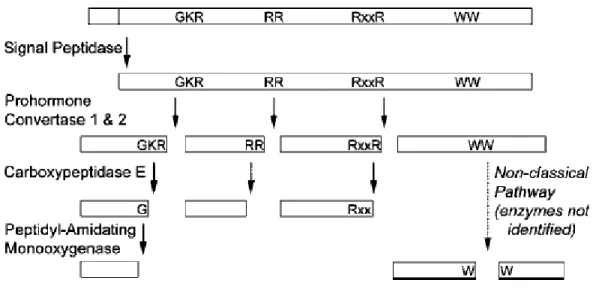
Neuropeptides are a complex class of endogenous peptides containing both neurotransmitters and peptide hormones.1 Neuropeptides perform multiple functions including communication between cells, and regulation of various biological processes such as growth, memory, learning, behavior, sleep, and circadian rhythms.1, 2 Neuropeptides are present in the central nervous system and peripheral organs including pancreas, adrenal gland, and in the immune system.3 Given the same primary amino acid sequence, some neuropeptides can act both as neurotransmitter and as a peptide hormone. Neuropeptides are functionally active molecules that are derived from larger inactive precursor proteins known as prohormones after complex proteolytical processing. A prohormone may contain one copy of the neuropeptide, multiple copies of the same neuropeptide, or multiple distinct neuropeptides.1
Most prohormones follow a common mechanism for the proteolytic processing.1 Prohormones include an N-terminal signal peptide that guides the sequence through the ribosome and into the lumen of rough endoplasmic reticulum. Here, the signal peptide is cleaved by the signal peptidase enzymes followed by the transfer to the trans-Golgi apparatus. In the Golgi apparatus, the prohormones are packed into the secretory vesicles along with various processing enzymes.4, 5 Formation of functionally active neuropeptides from prohormones in the secretory vesicles is a multi-step process. First, endoproteolytic cleavage by convertase enzymes generates intermediate neuropeptides. This cleavage occurs C-terminal from the dibasic or multiple basic residues (i.e., lysine or arginine), or less frequently from single basic residues, or rarely on from
2
non-basic residues.6 Other factors that can influence the processing of prohormones into neuropeptides include the organism developmental stage and the environment such as pH.7 Second, C-terminal basic residues are removed from the intermediate neuropeptides by the carboxypeptidases enzymes. Previous studies have shown that defects in the prohormone processing and failure to remove basic residues leads to obesity in humans and rodents.8, 9 Third, the neuropeptides undergo further post-translational modifications (PTMs) including acetylation, phosphorylation, and amidation.1, 10 Figure 1.1 depicts the steps involved in neuropeptide processing. N- and C-terminal PTMs are the most common among neuropeptides and are important for optimal functional activity and low degradation of the neuropeptides.6
The resulting neuropeptides that are released into extracellular space are short in length, usually ranging between 3-40 amino acids.1 Neuropeptides interact with G-protein coupled receptors located on the surface of the target cells. The receptors consist of seven membrane spanning alpha helices. The binding of the neuropeptide to the G-protein coupled receptors changes its conformation leading to activation of coupled G-protein, which then mediates intercellular signal transduction. So far approximately 100 different neuropeptide receptors have been reported in C. elegans.11
Several methods are available to identify neuropeptides from the biological samples including: Edman degradation, immunocytochemistry, enzyme-linked immunosorbent assay (ELISA), radioimmunoassay (RIA), and mass spectrometry (MS). Among these methods, MS has gained much popularity for the peptide and protein identification.
3
1.2 MASS SPECTROMETRY BASED PROTEOMICS AND PEPTIDOMICS
The disciplines of Proteomics and Peptidomics deal with the characterization of protein and peptide content within an organ, tissue or cell of the organisms, respectively.12 MS is an analytical technique that has gained much popularity for the analysis of proteins and peptides present in the complex biological samples mainly due to improvement in separation techniques, availability of sequence databases, and soft ionization techniques (that transmit little residual energy onto the molecules to avoid too much degradation of molecules) such as electrospray ionization (ESI) and matrix assisted laser desorption ionization (MALDI).13
A mass spectrometer contains three regions: an ion source, a mass analyzer, and a detector region. The ion source converts proteins or peptides in a sample into ions for MS analysis. ESI and MALDI are the two common methods that vaporize the molecules out of solution and dry samples, respectively. ESI coupled with MS is most commonly used for complex protein mixtures, while for large number of relatively simple protein mixtures MALDI-MS is used. The mass analyzer region measures mass-to-charge (m/z) ratio of the ionized molecules. Various types of mass analyzers are available for the proteomic research that differs from each other in terms of sensitivity, mass resolution, mass accuracy, and ability to generate informative mass spectra. The basic types of mass analyzers include ion trap, time-of-flight, quadrupole, and Fourier transform ion cyclotron. The detector region determines the intensity value associated with each m/z value.13
Figure 1.2 shows an overview of the tandem mass spectrometry. A tandem mass spectrometer contains more than one mass analyzer regions that are separated by the collision chambers.13 Upon injection of sample into the mass spectrometer, the ion source converts
4
molecules into ions that are analyzed by the first mass analyzer and an MS spectrum is generated that contains m/z values of the peptide ions and their relative abundance. The selected peptide ions undergo further fragmentation to generate a MS/MS or MS2 spectrum that contains information about the primary structure of the peptides.13, 14 The downstream analysis of MS or MS/MS spectra provides information about the identity of the peptides or proteins. In MS-based analysis, characterization of the protein of interest is conducted either through bottom up approach or top down approach.14, 15 Neuropeptides are endogenous peptides that are already present in the sample and do not require sample preparation by enzymatic digestion (bottom up approach) or MS-based fragmentation (top down approach) of proteins.16 However, due to their typical short length the performance of the database search programs was tested on neuropeptides such that these peptides can be generated in the course of some protein experiments by protein digestion or fragmentation. Hence such approaches are described briefly.
TOP-DOWN APPROACH
In the top down approach, proteins in the complex mixture are separated and then intact proteins are subjected to ionization by ESI or MALDI. The ionized proteins are fragmented by MS to generate fragment ions. This provides molecular masses of both intact proteins and their fragment ions that can be used to identify protein of interest with more complete amino acid sequence coverage and information about PTMs.15 For the top down approach, the fragmentation methods such as electron capture dissociation (ECD) and electron transfer dissociation (ETD) are more effective in fragmenting large peptides and proteins.14, 15 Provided enough number of fragment ions are detected in MS for the protein of interest, the top down approach enables
5
identification of protein isoforms in much better fashion due to better sequence coverage.14, 15 Furthermore, protein quantification using the top down approach is more reliable because abundance of proteins is measured directly rather than estimating it from the abundance of constituent peptides.14 Another advantage of the top down approach is that the masses of intact proteins are dispersed over a wider mass range unlike the peptide mixture obtained from the enzymatic digestion of proteins, thus reducing the complexity associated with the requirement to separate peptides prior to MS/MS analysis.17 Drawbacks of the top down approach include limitations associated with the separations methods, low sensitivity, and need for the large volumes of the sample relative to the bottom up approach.14 The masses of intact proteins and their fragments ions are queried against the proteomic databases18 or de novo approach can be used to identify the protein.14
BOTTOM-UP APPROACH
The bottom up approach is most commonly used to identify proteins present in complex biological samples in high throughput experiments. This approach starts with the protein purification step that is carried out either using gel based methods or gel free methods.14 The separated proteins are enzymatically digested to generate complex set of peptides. Among several proteases, trypsin is most commonly used that digests proteins at carboxyl-terminus of arginine or lysine residues unless these are followed by the proline residue. The resulting peptides mixture is separated using single or multidimensional separation techniques. The separated peptides are ionized by MS using ESI or MALDI ionization sources to generate peptide ions.15, 19 The mass analyzer region of the MS records the m/z values of the peptide ions (producing MS spectra).13 In
6
bottom up studies mostly the peptide ions are further fragmented in tandem MS by Collision Induced Dissociation (CID) to generate product or fragment ions containing information about amino acid sequence and PTMs.14 Figure 1.3 depicts the general scheme of a typical bottom up experiment.
The bottom up approach has several advantages over the top down approach for the large scale protein identifications. The bottom up can deal with samples of high complexity and the peptides resulting from the enzymatic digestion are more easily separated than the intact proteins with the current front end separation techniques. Furthermore, bottom up needs lesser volume of the sample and is widely used for the quantification of peptides and proteins through chemical modifications of peptides with techniques such as ICAT or O18 labeling. However, quantification using the top down approach is more reliable.14
Several limitations are also associated with the bottom up approach. The digestion of proteins with enzyme such as trypsin results in peptides that fall within a relatively narrow mass range, which increases the difficulty to isolate these individual peptides for the downstream analysis.17 Another challenge is the under sampling of peptides representing less abundant proteins and mostly proteins with high abundance are detected.20 In the bottom up approach not all peptides from a single protein sequence are detected (usually 50-90% are detected) which leads to limited protein sequence coverage, which makes it less ideal choice to identify splice variants and PTMs.21 Typically, only few peptides that provide sufficient information are used to identify the parent proteins in the bottom up analysis.15
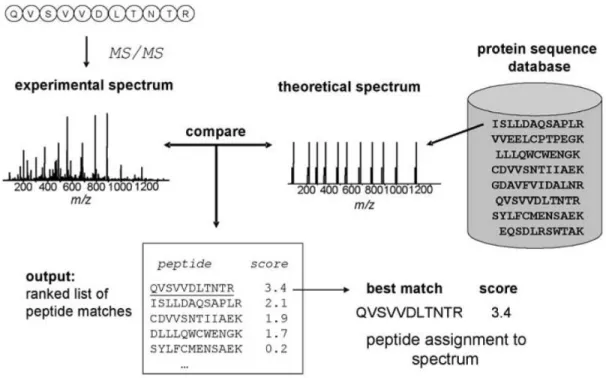
7
Various computational methods are available to identify protein sequences using MS or MS/MS spectral data. For the MS scan, Peptide Mass Fingerprinting (PMF) can be used to identify the protein of interest by comparing masses of observed peptides with the masses of peptides generated from each protein sequence in the database. However, PMF is useful when the sample only contains pure proteins.17 For the MS/MS data, the sequence database searching is the most efficient method to identify peptides. The magnitude of the correlation between the experimental and theoretical spectra in the database receives a statistical significance p- or E-value. Subsequently peptides are used to identify the precursor proteins by peptide-protein mapping and statistical confidence scores are assigned to peptide-protein mappings.22 Several databases include information that can be used by the database search and spectral library search approaches.
1.3 DATABASES OF PROHORMONES AND NEUROPEPTIDES SEQUENCE AND
SPECTRAL DATA
UNIPROT
UniProt (http://www.uniprot.org) is an integrated resource to store information pertaining to protein sequences and their functional annotation from various sources. The UniProt is a joint effort of research groups in the European Bioinformatics Institute (EBI), Protein Information Resource (PIR), and Swiss Institute of Bioinformatics (SIB).23, 24 UniProt has four components: UniProt Knowledgebase (UniProtKB) is a central repository to store curated information about proteins along with cross-references to more than 140 databases providing additional or complementary information on the annotation.24 UniProt Archive (UniParc) keeps track of changes
8
in the protein sequences present in the UniProt database. UniProt Reference Clusters (UniRef) clusters sequences in related species based on similarity to increase speed of searches. UniProt Metagenomic and Environmental sequences (UniMES) provide metagenomic and environmental data. The protein and peptide sequences from the UniProtKB were used in these studies.
The UniProtKB has two different components: UniProtKB/Swiss-Prot and UniProtKB/TrEMBL. The UniProtKB/Swiss-Prot contains manually curated protein sequences and annotations that are extracted from literature and computational analysis. For each protein the following information is provided: function, enzyme specificity, functional domains, PTMs, subcellular location, tissue specificity, spliced isoforms, structure, interactions, and associated diseases.23 The current version of UniProtKB/Swiss-Prot (release 2013_10; October 16, 2013) contains 541,561 sequences obtained from 223,284 references. The UniProtKB/TrEMBL contains protein sequences that are computationally annotated and classified. The sequences that are translated from the coding sequences (CDS) present in the EMBL, GenBank, DDBJ nucleotide sequence databases, sequences associated with PDB structures, and data derived from the sequences directly submitted to UniProtKB and published literature.23 Currently UniProtKB/TrEMBL (release 2013_10; October 16, 2013) contains 44,746,523 protein sequence records.
SWEPEP
SwePep (http://www.swepep.org) is a composite database of neuropeptide sequences and tandem spectral data designed to facilitate peptide identification in mass spectrometry
9
experiments.25 The sequence database contains 4,180 annotated endogenous peptides and small proteins that are less than 10 KDa from 394 different species. These endogenous peptides were collected from three sources: in house experimentally verified peptides, peptides and proteins from UniProt, and peptides and proteins extracted from peer-reviewed publications. SwePep provides the calculated monoisotopic mass, average isotopic mass and isoelectric point (PI) for each peptide sequence in the database. The peptides in SwePep are classified into three groups: (1) biologically active peptides, the peptides with known biological functions; (2) potential biologically active peptides, the peptides with unknown biological function that belong to known peptide precursor proteins containing endogenous peptide specific processing sites; and (3) uncharacterized peptides, all peptides that do not belong to the above two groups. The SwePep sequence database is searchable by using the peptide’s mass or name, organism name, or UniProt accession number.25 The spectral library of the SwePep includes CID spectra obtained from the LTQ mass spectrometer coupled with liquid chromatography and ESI.26 The 389 unique peptide identifications from 2,700 tandem spectra using X! Tandem were included in the spectral library regardless of the score threshold (loge(-2)). The spectral library is searchable using peptide sequence and peptide molecular mass with adjustable mass tolerance.
NATIONAL INTITUTE OF STANDARDS AND TECHNOLOGY (NIST)
NIST (http://peptide.nist.gov) hosts a tandem spectral library of tryptic peptides produced in LC-MS/MS experiments utilizing the ESI method. The library generally holds spectra from ion trap and quadrupole-TOF mass spectrometers. The tandem spectra in NIST are grouped into three categories: 1) the consensus spectra; 2) the best replicate spectra; and 3) the high confidence single
10
spectra identifications. Utilizing four database search programs the peptides were peptide sequences were assigned to every spectrum.27
NEUROPEDIA
NeuroPedia is a neuropeptide sequence and spectral library (http://proteomics.ucsd.edu/Software/NeuroPedia/index.html).28 NeuroPedia was developed to improve the sensitivity and speed of the sequence database search and spectral library search programs in neuropeptide studies. The NeuroPedia sequence database contains 847 neuropeptides obtained from seven species, human (270), rat (195), mouse (188), bovine (154), rhesus macaque (20), chimpanzee (17), California sea hare (2), and leech (1). The 847 neuropeptides (from 332 precursor proteins) ranged in length from 2 to 1,129 amino acids in length. Neuropeptide description available in NeuroPedia includes peptide sequence, name, gene family, organism name, taxonomy, gene name, RefSeq gene identifier, protein name, RefSeq protein identifier, UniProt accession number, and start and end positions of the neuropeptide in the precursor protein. The 847 sequences are clustered into three groups regardless of the species based on sequence similarity in pairwise alignments: (1) 531 identical pairs, when the two aligned peptide sequences are exactly similar or redundant; (2) 5,020 overlapping pairs, with two aligned sequences identical up to half the length of the longest sequence in the alignment; and (3) 9,185 homolog pairs, with aligned sequences including one or two amino acid substitutions. The NeuroPedia spectral library contains 3,401 tandem spectra gathered from the NIST library and in house experimental datasets from five species, human (3,184), bovine (145), mouse (67), rat (4), and leech (1). The tandem spectral library is downloadable in the Mascot Generic Format (MGF) and is compatible with MSPLIT29
11
spectral library search program. The 3,401 tandem spectra are divided into ten MGF files depending upon the source organism (five species), instrument type (ion trap or quadrupole time of flight), and enzyme specificity (trypsin, v8, or none). Furthermore, the NeuroPedia allows visual inspection of each tandem spectrum.
PEPTIDEDB
PeptideDB (http://www.peptides.be) is a sequence database composed of biologically active endogenous peptides, precursor proteins and known protein motifs.30 The current version of the database (version 1.0; April 25, 2008) contains 20,027 bioactive peptides derived from 19,438 precursor proteins obtained from 2,820 metazoan species. The peptides and proteins in the PeptideDB were collected from BLAST alignments, annotations in the UniProt database, and published literature. The 19,208 out of 19,438 precursor proteins in the PeptideDB were classified into 373 peptide families based on sequence similarities and information available in the literature, while the remaining 230 precursor proteins with no significant homology were classified in a “unique peptide group”. The 48% (178) of protein families have known motifs in the Prosite (http://prosite.expasy.org), Pfam (http://pfam.sanger.ac.uk), SMART (http://smart.embl-heidelberg.de), and peptidemotifdat31 databases. The peptide and precursor protein length distribution indicated that 97% peptides and 98% precursor proteins are less than 200 and 500 amino acids in length, respectively. The PeptideDB database is searchable using the PeptideDB accession number, peptide name, peptide length, monoisotopic mass, amino acid sequence, organism common name, peptide family, or UniProt accession number.
12
PEPSHOP
PepShop (http://stagbeetle.animal.uiuc.edu/pepshop.html) is a comprehensive web resource that enables the identification and discovery of neuropeptides.32 PepShop integrates public databases encompassing sequence, annotation, and tandem mass spectra (MS/MS) information with bioinformatics and proteomics tools to input, search, align, predict, and identify prohormone and peptides. PepShop integrates experimentally confirmed prohormone and peptide information from the SwePep, UniProt, and NeuroPred repositories. The PepShop data warehouse can be searched by species (seven species), prohormone identifier (668 unique sequences), exact amino acid sequence, and peptide monoisotopic mass with adjustable mass tolerance level. The neuropeptides in the PepShop database are linked to the spectral library of SwePep. PepShop enables the search of user-provided MS/MS profiles against the in-house neuropeptide repository using three open source database search programs, Crux, X! Tandem, and OMSSA. In PepShop, identified peptides are automatically linked to prohormone and peptide information.
NEUROPEPTIDES.NL
Neuropeptides.nl (http://www.neuropeptides.nl) database contains information about the known neuropeptides, neuropeptide genes, precursor proteins, and their expression in the mouse brain.33 The neuropeptide genes have been grouped into families based on structural or functional similarities among them. The neuropeptide genes are linked to their corresponding locus on the human genome through UCSC (University of California Santa Cruz; http://genome.ucsc.edu) human genome browser. The UCSC browser provides further information about the gene location,
13
transcripts, and base wise conservation in other species. The precursor proteins are linked to their isoforms and homologous proteins in related species using pre-computed BLAST results. Comparisons of precursor proteins across species indicate that precursor proteins are less conserved relative to the neuropeptides and their processing sites. Furthermore, the neuropeptide genes are linked to the mouse expression data for the annotated genes in the online Allen Brain Atlas or GenePaint.org resources.
EROP-MOSCOW
EROP-Moscow (http://erop.inbi.ras.ru) database provides comprehensive information about 10,575 naturally occurring bioactive oligopeptides.34 These peptides ranged from 2 to 50 amino acids in length. Of 10,575 bioactive peptides in the current version of the database, 2,362 peptides are neuropeptides. The database provides information about each neuropeptide including peptide length, sequence, precursor protein, PTMs, biological functions, molecular mass, isoelectric point, and literature sources. The majority of the information about neuropeptides and other functional classes of bioactive peptides (such as toxins, antimicrobial) was extracted from the scientific literature. The peptides are also linked to the external generalized databases, Swiss-Prot, protein identification resource (PIR), and PubMed. Based on sequence similarity peptides are also grouped into homologous families.
14
NCBI REFSEQ
The National Center for Biotechnology Information (NCBI) Reference Sequence (http://www.ncbi.nlm.nih.gov/RefSeq/) is a collection of genomic, transcripts and protein sequences. The database contains more than 13 x 106 protein entries from more than 16,000 species.35 RefSeq contains well annotated sequences for the neuropeptide genes and precursor proteins. The key features of the RefSeq are less redundancy in records and improved cross-referencing between nucleic acid and protein information. The RefSeq records are generated either using annotation pipelines or through manual annotation. The accession numbers of the protein records derived from the annotation pipelines and manual annotation are denoted with prefixes “XP_” and “NP_”, respectively.
1.4 PEPTIDE IDENTIFICATION BY TANDEM MASS SPECTROMETRY
Several computational approaches and software tools are available to identify peptide sequences from tandem spectra. These approaches are grouped into four categories depending upon how peptide sequence is assigned to the tandem mass spectra: (1) de novo peptide identification, (2) sequence database searching, (3) spectral library searching, and (4) hybrid approach.
The de novo approach extracts peptide sequences from the experimental spectra without any prior knowledge about the peptide sequences.36 This approach is based on the rationale that the two fragment ion peaks in the tandem spectra differ by a single amino acid and sequence of the peptide can be obtained by calculating the mass differences between the adjacent peaks.37 Novel
15
peptides can be identified by this approach but at the same time the error rate is high due to incomplete fragmentation patterns in tandem mass spectra.36, 38
The database search approach identifies spectra by comparing experimental spectra against theoretical spectra generated from peptides in the sequence database. This approach is useful when the peptide sequence is known and present in the sequence database or when the experimental spectra have low quality and incomplete fragmentation. The sequence database approach can match tandem mass spectra containing sufficient information (i.e., signal peaks) to peptide sequences in the database even if the spectra are of poor quality (too many non-signal peaks or low intensity of signal peaks) and contains incomplete fragmentation.37 However, confidence in peptide identification is decreased if the spectrum quality is too low39 or when many fragment ions are missing.16 The database search approach cannot identify those peptides that are not present in searched database.22
The spectral library approach identifies peptides by searching the experimental spectrum against already annotated spectra present in the spectral library.22, 40, 41 The spectral library search approach is based on the rationale that MS-based peptidomics experiments include many peptide spectra already annotated in prior studies.42 Like the sequence database search approach, this approach cannot identify novel peptides.
The hybrid approach is a combination of de novo and sequence database search approach. In the first step, short sequence tags (i.e., short sequences of 3-5 amino acids in length) are extracted from the tandem mass spectra using de novo approach and then these sequence tags are searched against the sequence databases using database search methods. This approach is designed
16
to overcome the limitations of de novo approach (failure to correctly match spectra with incomplete information and poor quality) and the database search approach (identification of novel or mutated peptides).22, 41 The database search programs were used in the current studies and will be discussed in detail.
1.5 OVERVIEW OF THE DATABASE SEARCH APPROACH
The database search approach is the most common approach to detect peptides in the bottom up proteomics studies primarily due to the ability to handle spectra with incomplete fragmentations and of low quality (low intensity of the signal peaks or presence of many non-signal peaks). Figure 1.4 shows an overview of the database search approach. The database search programs correlate experimental spectra with the in silico theoretical spectra generated from the peptide sequences in the database.40 One or more scores or indicators are reported with each score indicating the strength of the peptide-spectrum match. Furthermore, in addition to existing proteomic databases, this approach can use information from translated genomic databases.22, 41
Many database search programs have been developed and routinely used for the peptide identification including OMSSA,43 Crux,44 X! Tandem,45 Mascot,46 SEQUEST,47 and Tide.48 These programs differ in the heuristic search algorithms and the way the experimental-theoretical spectra matching score is computed.
The database search programs match individual spectrum against a subset of all the peptides present in the sequence database that fall within the mass range (tolerance) of the precursor peptide. The scores are converted to either p-values or E-values that reflect the statistical significance of the match based on a theoretical test distribution or an empirical test distribution
17
based on other peptide spectrum matches.41 The p-value is the probability of obtaining the match between experiment and theoretical spectra due to chance. The E-value is closely related to p-value but denotes the expected number of random database matches that received score as high as the current match.
SEARCH PARAMETERS FOR THE DATABASE SEARCH PROGRAMS
The parameter specification of the database search program affects peptide identification. The parameters influence the selection of the candidate peptides that have similar mass as the experimental spectrum, peptide identification accuracy, and speed of search.22, 49 There is no best set of parameter values and the optimal search parameter values depends on multiple factors including tandem MS datasets, search methods and tools, and analysis strategies.49 The most widely used search parameters are: monoisotopic or average isotopic mass, precursor and fragment ion tolerance, enzyme specificity, PTMs, and type of fragment ions.
Monoisotopic or Average mass
All database search programs allow the specification of the method to calculate the peptide masses from the m/z values of the peptide ions. The calculated masses from the m/z values can be closer to the monoisotopic mass (with 12C atoms only) or average mass (including 13C atoms). The monoisotopic mass is the mass of the most common isotopic form of the amino acids, while the average mass represents the weighted average of all the isotopic forms of the amino acids. The monoisotopic and average isotopic masses are usually used for the high-resolution and low-resolution mass spectrometers, respectively.22
18
Precursor and fragment ion tolerance
After calculation of the peptide mass from the m/z value of the precursor ion from the experimental spectrum, the database search program selects the database peptide sequences (candidate peptides) that fall within a certain mass range (precursor ions tolerance) of the experimental spectrum. The choice of the precursor mass tolerance value depends on the accuracy of the mass spectrometers that range from 0.05 Da for the high mass accuracy instruments such as Fourier transform to 3 Da for the low mass accuracy instruments such as ion traps.22 The higher value of the precursor ion tolerance can affect the speed of searches and accuracy of peptide identification due to large number of available candidate peptides.41 However, studies have shown that selection of few candidate peptides can also hamper the performance of the database search programs.50 This is because many database search programs use the score distribution of the candidate peptides to assign significance values to the correct peptide match. The lack of sufficient candidate peptides can lead to potential incorrect matches. In addition to the precursor ion tolerance, the fragment ion tolerance can also be provided for the database search programs.
Enzyme specificity
The choice of the digestion enzyme to process the protein sequences into peptides depends on the experimental settings. Accurate specification of the digestion rules can reduce the search space to only those candidate peptides that satisfy the digestion rules of interest. Most database search programs are designed for tryptic peptides; however these programs can also be used for the neuropeptide searches by specifying custom cleavage rules. For neuropeptide searches, the protein library can be processed with a nonspecific enzyme that cleaves on every peptide bond while allowing for the large number of missed cleavages.26 An alternative strategy is to instruct the
19
database search program to use the peptide sequence database without further processing.16 NeuroPred and similar tools can be used to create such peptide databases.
Post-translational modifications (PTMs)
PTMs are the covalent modifications in the proteins that occur either due to proteolytic cleavage or addition of modifying groups.51 So far, approximately 200 different types of PTMs have been reported.52 Each modification makes the mass of the precursor and fragment ions different from the masses of peptides in the sequence databases. The database search programs select candidate peptides from the sequence database on the basis of observed mass and failure to incorporate these PTMs would lead selection of incorrect candidate peptides.53 Most database search programs allow the specification of three different types of PTMs: (1) the modification of specific residue when present at peptide terminus such as pyro-glutamination of glutamine and glutamic acid residues; (2) modifications of any residue present at peptide terminus such as N-terminal acetylation and C-N-terminal amidation; and (3) modification of particular residues regardless of their position in the sequence such as phosphorylation of serine, threonine, and tyrosine.46 The PTMs can be applied either in fixed fashion (all occurrences of the residue are modified e.g., addition of 57 Da on every occurrence of cysteine due to cysteine alkylation) or in variable fashion (residue is only conditionally modified). The variable modification increases the search space exponentially with increase in the number of PTM specified, which can lead to reduction in search speed and peptide identifications.20 Common PTMs for the neuropeptides are glycosylation, amidation, acetylation, phosphorylation, and sulfation. These PTMs occur in secretory granules and are species- or tissue-specific.4
20
Types of fragment ions
The value of this parameter depends on the type of fragmentation method used in the mass spectrometry.22 The ions are named based upon the type of bonds that are broken between the two adjacent amino acids during the fragmentation process. The most common fragmentation is the CID which produces b- and y-ions due to the breakage of amide bonds. The breakage of bond between the alpha carbon and carbonyl carbon yields a- and x-series ions. Furthermore, the methods such as ETD mainly results in c- and z-ions due to the fragmentation of bonds between the amide nitrogen and alpha carbon. The fragment ions are classified as N-terminal or C-terminal if the charge is retained on the terminus or C-terminus of the peptide, respectively. The N-terminal ions include a-, b-, and c-ions, while x-, y-, and z-ions are classified as C-N-terminal ions.54, 55
The database search program predicts the fragment ions for the selected candidate peptides according to this search parameter and then compares them with the fragment ions present in the experimental spectrum.49
1.6 REVIEW OF SELECTED DATABASE SEARCH PROGRAMS
Many database search programs are available including OMSSA, Crux, Mascot, Sequest, Tide, Myrimatch, and X! Tandem. A brief description of the selected database search programs, their scoring schemes and conversion of scores to either E- or p-value is given below. The X! Tandem and OMSSA use a parametric approach (fitting parametric distributions without using decoy peptides) to obtain significance values, while Crux uses a semi-supervised parametric approach (fitting parametric distributions from the scores of decoy peptides) to compute the p-value.
21
X! Tandem
X! Tandem (http://www.thegpm.org/tandem) is an open source program written in the C++ programming language and can be executed in multiple platforms (Windows, Linux, OS X).45 X! Tandem assigns peptide sequences to provided tandem spectra in the multistep process. First, X! Tandem preprocesses the input tandem spectra to remove noise and artifacts (i.e., peaks resulting from the ions other than the selected ions in MS) using information provided in the search parameter file. The X! Tandem selects the 50 (user adjustable) most intense fragment ion peaks and the intensity values of the selected peaks are normalized using a user-adjustable dynamic range value (a parameter showing the difference between the most intense and least intense fragment peak in the spectra; the default value is 100). In the normalization step, the intensity of the most intense peak is set to one-hundred, while the intensities of the remaining peaks are linearly scaled with respect to most intense peak. Furthermore, peaks with scaled intensity below one are removed from the normalized spectrum. Second, X! Tandem processes the database protein sequences into peptides using specified enzymatic cleavage rules and the resulting peptide sequences are further subjected to chemical and PTMs. Third, the normalized observed spectrum is correlated to the theoretical spectra generated from the peptide sequences from the target search database. This step assigns scores to each peptide-spectrum match indicating the strength of the match.45 Fourth, X! Tandem creates an XML output file containing details of the match such as precursor ion mass, charge state, hyperscore, E-value, peptide sequence, protein sequence, search parameters and others (http://www.thegpm.org/ docs/X_series_output_form.pdf).
X! Tandem first computes a convolution score (preliminary) for each peptide-spectrum match. The convolution score is the dot product of the intensities of the matched fragment ions
22
between experimental and theoretical spectra. The dot product is used because only the matched ions are considered. The convolution score is converted into a hyperscore by multiplying the score by the factorial number of matching b- and y-ions (the usage of b- and y-ions corresponds to the CID spectra). The default use of the factorial of the number of matched b- and y-ions can be modified to include other ions such as a-, c-, x- and z-ions in the scoring. The use of factorial is based on the hypergeometric distribution. The hyperscore is calculated as:
∑
The database search produces a hyperscore distribution of all the peptide-spectrum matches, which is assumed to follow a hypergeometric distribution. The hypergeometric distribution is a parametric discrete probability distribution that allows extrapolation. The hyperscores are transformed and the hyperscores higher than the intersection between the log-transformed hyperscores (on the x-axis) and log transformation of the frequency of the hyperscores (i.e., E-value on the y-axis) are assumed to be significant.39
OMSSA
Open Mass Spectrometry Search Algorithm (OMSSA; http://pubchem.ncbi.nlm.nih.gov/ omssa) is an open source program written in the C++ programming language that can be compiled across multiple platforms including Windows, Linux, Solaris, and OS X.43 OMSSA uses a multi-step strategy to identify peptides from the spectra.
In the first step, OMSSA determines the precursor charge state of the spectrum by counting the number of peaks that fall below the m/z value of the precursor ion. A spectrum with more than 95% peaks below precursor m/z is considered in +1 precursor charge state, while the spectrum is
23
searched with +2 and +3 precursor charge states if less than 95% peaks fall below precursor m/z values. The accurate determination of the charge state is important in OMSSA because candidate peptides (peptides within the precursor mass tolerance) for each spectrum are selected using the neutral mass (i.e., sum of the masses of amino acid residues in a peptide and mass of the hydroxyl group) of the precursors. The second step involves preprocessing of experimental spectra to remove noise peaks including peaks with intensity below 2.5% of the highest peak in spectrum, precursor ion peaks, peaks that are within 2 Da of m/z distance from the examined peaks, and peaks that can be explained by neutral mass losses (loss 17 Da for ammonia, and 18 Da for water). Furthermore, peaks are examined in the order of intensity, for the precursor charge states +1 and +2 only the most intense peak within ±27 Da of the peak being examined is selected, while for the +3 charge state the two most intense peaks are selected within ±14 Da of the peak being examined. Third, candidate peptides from the sequence database that fall within precursor mass tolerance of the spectra are selected. The candidate peptides masses are calculated considering the specified PTMs. Fourth, to improve the speed of searches, the m/z values from the experimental spectra are converted to integer values using 100 as the scaling factor (user-adjustable), the sequence library is mapped to memory, and the observed spectra are sorted, and indexed by the precursor mass. Fifth, +1 charge fragment ions are calculated for precursor charge states +1 and +2, while both +1 and +2 fragment ions are calculated for precursor charge state +3 when the peak is above m/2 and below m/2, respectively, where m is the precursor mass. Sixth, the fragment ion peaks in the experimental and theoretical spectra are compared and a score is calculated. Only the theoretical spectra that have at least one fragment ion match with any of the top three (user-adjustable) most intense peaks in the experimental spectrum are scored to improve the sensitivity of the algorithm.43
24
The scoring of the experimental-theoretical spectra matches is based on the assumption that the distribution of the number of matched ions follows a Poisson distribution. Lambda (the Poisson mean parameter) is calculated by considering the fragment ion tolerance, number of peaks in the experimental and theoretical spectra, and the mass of the precursor. The lambda is calculated by counting the number of spectrum peaks that fall within two matched fragment ions from any one fragment ion series (e.g., b- or y-ions). The count is adjusted by dividing with the mass of the precursor. Lambda is the sum of the adjusted counts. The calculation of the lambda parameter is different for the spectra with +1 charge fragment ions than spectra with both +1 and +2 fragment ions. During the preprocessing step, the OMSSA noise filter removes some but not all noise peaks (peaks not representing fragment ion peaks are known as noise peaks) from the experimental spectra leading to inclusion of noise peaks in the calculation of the Poisson mean. The probability of the match with a given number of fragment ion matches (x) and lambda can be calculated as follow:
The OMSSA report results according to E-value which is the expected number of random database matches with probability equal or more significant than the one observed due to chance. OMSSA calculates this E-value by multiplying the number of candidate peptides (i.e., database peptides within precursor tolerance of observed spectra) with Poisson probability of the match.
∑
25
Crux
Crux is an open source reimplementation of Sequest, the first commercial database search program.44 Like in the previous database search programs, the first step in Crux is the identification of all database candidate peptides that are within the precursor mass tolerance range of the experimental spectra. The candidate peptides are selected either by querying spectrum masses against the entire sequence database or against an indexed database of predicted peptides. This indexed database is a preprocessed binary sequence database obtained from the in silico digestion of precursor sequences in the target database and followed by sorting of the resultant in silico generated peptides by their masses. The index database allows efficient retrieval of candidate peptides upon query allowing Crux to perform faster searches than the original Sequest program. The candidate peptides are matched with the experimental spectrum and indicators of the strength of the experimental and theoretical spectra matches are reported. These indicators are: cross-correlation score (XCorr), delta Cn (ΔCn), Sequest preliminary score (Sp), and p-value.
First, Crux processes the spectra by taking the square root of each intensity peak value, normalizes the peak intensities to sum to one hundred, and round each m/z to the nearest integer value. Second, Crux uses the 200 most intense peaks to compute a Sp score. The higher the value of Sp score denotes higher similarity between theoretical and experimental spectra. The Sequest version used Sp score to filter top 500 database candidate peptides that are subsequently scored and reranked using XCorr to increase the speed of searches. The default version of Crux “search-for-matches” does not calculate Sp score. In this study, the Crux parameter file was modified to retrieve this score.
26
The experimental spectrum is preprocessed prior to calculating XCorr scores, the primary score of Crux that indicates the similarity between experimental and theoretical spectra. First, spectra are processed by taking the square root of each intensity peak value and rounding each m/z to the nearest integer value. The processed spectrum is divided into ten bins and the peaks intensity in each bin is set to a maximum of 50. A theoretical spectrum is synthesized for each candidate peptide containing b- and y-ions with peak intensity of 50, ±1 m/z peaks with intensities of 25, and with peak intensity 10 for b- and y-ion peaks with neutral mass loss of ammonia and b-ion peaks with neutral loss of water. The two spectra are correlated and higher XCorr denotes higher similarity between experimental and theoretical spectra. Crux computes a relative score (ΔCn) from the XCorr scores denoting the relative ranking of each peptide match in terms of other peptide matches for any particular spectrum. The deltaCn reflects the difference in the XCorr score of the top peptide-spectrum match relative to other matches for that spectrum. The deltaCn score indicates the strength of the top match relative to the second best match.
Crux calculates a p-value from a Weibull distribution obtained by using XCorr scores from all peptide-spectrum matches.56 The p-value is the probability that the match between the experimental and target peptide spectrum is due to chance. Crux reports spectrum specific Bonferroni-adjusted p-values, adjusted by the number of candidate peptides. Crux uses 40 Weibull points (the minimum numbers of XCorr scores required to estimate the p-value) to estimate p-values. However, prior studies have shown that increase in the number of Weibull points increase significance levels of the estimated p-values.16 Crux generates in silico peptides (decoy peptides described in the next section) when the number of candidate peptides are less than the number of Weibull points required to estimate p-values using Weibull distribution. The decoy peptides are
27
generated by keeping the terminal amino acids of the candidate peptides fixed while shuffling the internal amino acids of the peptide. The Crux sampling with replacement procedure is repeated until a minimum number of Weibull points are obtained. The source code of Crux was modified to obtain raw p-values for each spectrum using different values of Weibull points.
1.7 FACTORS AFFECTING PEPTIDE IDENTIFICATION
Accurate peptide identification from the tandem spectra remains challenging despite the many parametric, semi-parametric, and non-parametric methods available to calculate the significance levels of a match between the experimental and theoretical spectra. The significance levels provide an objective criterion to assess the likelihood that the scores of target peptides could be observed by chance. A large number of observed spectra are either missed due to significant levels that do not surpass the minimum user-defined threshold (false negative) or the match significance surpasses the minimum threshold yet the match is incorrect (false positive). Several factors influence the significance levels of the peptide-spectrum matches including: search space, peptide length, missing ions and low spectrum quality, and incomplete databases.
IMPACT OF THE SEARCH SPACE DENSITY ON PEPTIDE IDENTIFICATION
The precursor mass tolerance, choice of a digestion enzyme, and PTM searches influence the effective database size (the number of database peptides that have mass within the precursor tolerance of the experimental spectrum).41, 49 A spectrum with fewer database candidate peptides is more likely to produce a correct peptide match relative to a spectrum with more candidate peptides. The presence of large number of candidate peptides reduces the sensitivity of the database search
28
programs as more incorrect peptides have a chance to receive a score higher than the correct peptide matches leading to an increase in the false positive results. The higher number of incorrect peptides with score as extreme as the correct target peptide leads to lower significance values for the corresponding spectrum. On the other hand, many database search programs use all candidate peptides scores for a spectrum to fit a distribution and calculate significance values for the match.49 For example, X! Tandem estimates E-value from the distribution of hyperscores from all peptide matches for a spectrum.57 Low number of candidate peptides increases the E-value and the match becomes less significant.16 A wider precursor tolerance can be used to generate enough number of candidate peptides to estimate significance values in the absence of sufficient candidate peptides.49 An alternative approach is to generate decoy peptides when sufficient number of candidate peptides is not available to estimate significance.56
IMPACT OF PEPTIDE LENGTH ON PEPTIDE IDENTIFICATION
The ability of the database search programs to accurately identify peptides mainly depends on the availability of a sufficient number of matching fragment ions.16 Short peptides have a higher chance to be missed by the database search programs due to less significance values.16, 20, 58 The short peptide tends to receive a score that is not different from the other matches of the spectrum due to less number of possible fragment ions. This problem is further complicated by other factors such as missing ions and presence of fragment ions due fragmentation of more than one peptides in a single spectrum.16
29
IMPACT OF MISSING IONS AND LOW SPECTRUM QUALITY ON PEPTIDE IDENTIFICATION
The incomplete fragmentation and noise (non-signal spectra peaks) in the spectra reduces the number of correct peptide identifications due to lower significant p- or E-value levels assigned by the database search programs. The increase (becoming less significant) in p- or E-values with both factors is due to the lower score of the correct matches that is not significantly different from the other matches of the spectrum. Most database search programs use intensity to select signal peaks to be used in their scoring functions. The low intensity of signal peaks relative to the noise peaks reduces the contribution of signal peaks in the scoring functions which can lead to the lower scores for the correct peptide matches.26 In the case of same PTM occurring on more than one residue on a single peptide (e.g., phosphorylation of serine and threonine), the confidence in localization of the PTM is reduced in the absence of fragment ions representing the exact residue modified.49
FACTORS IMPACTING SEQUENCE DATABASES
The database search programs can fail to identify a peptide match if the corresponding peptide sequence is absent from the target database. This could be either due to the: (a) presence of a closely related variant of the peptide or protein rather than exact sequence in the database; (b) sequencing errors; (c) mutation in the sequence; (d) polymorphism; or (e) presence of homologous sequence in the database from closely related species.59
In the context of the standard database search approach (searching database with a narrow precursor mass tolerance) a peptide sequence is considered missing when either a peptide sequence
30
is totally absent from the sequence database or a closely related variant of the sequence is present in the database. This is because it can change the peptide mass and the resulting MS/MS fragmentation patterns of the b- and y-ions making the observed-theoretical spectra unmatchable. The error tolerant searches are assumed to work better than the standard database searches in such cases.59
Another reason could be the complex dissociation chemistry of peptides in MS that can permute or rearrange the sequence of peptides in sample. Studies have shown that the larger b-ions have higher tendency to form cyclic structures in which sequence ends are fused together followed by reopening of the ions at different residues instead of the original fused positions. Most database search programs do not take into account the possibility of peptide ion rearrangements while counting the number of shared peaks between the observed and theoretical spectra.60 The exclusion of such permuted ions from scoring can contribute towards lower scores for the peptide matches.
MULTIPLE HYPOTHESIS TESTING
Typical MS-based peptidomics or proteomics experiments involve the analysis of thousands of experimental tandem spectra leading to a multiple hypothesis testing scenario.61 Two different types of measures have been proposed to control multiple hypothesis testing problems: family wise error rate (FWER) and false discovery rate (FDR). The first measure is FWER the probability of rejecting at least one true null hypothesis among all m independent hypotheses. Given m independent hypothesis and the probability of error for each test (α), the FWER is calculated as:
31
The quantity (1- α) represents the probability of no error and (1- α)m represents the probability of no error in the m independent tests.62 For example for m = 100 and α = 0.05 then FWER is 0.99 (or 99% chance of observing at least one falsely rejected null hypothesis). Many methods have been proposed to control such high FWER and these methods are divided into categories: (a) single step approach, in which all p-values are adjusted equally; and (b) sequential step approach, in which each p-value is adjusted separately.
The Bonferroni adjustment is a single step approach that is used in the current study. This adjustment can be applied in two ways: (1) by multiplying the probability of type I error (alpha level) by the number of tests (adjusted alpha level) and accepting or rejecting the null hypothesis by comparing significance values against adjusted alpha level; and (2) by adjusting the raw significance values by multiplying them by the number of hypothesis tests and then comparing the adjusted significance values against the alpha level to accept or reject the null hypothesis. The Bonferroni adjustment is a highly conservative approach.
An alternative approach to control FWER is the Holm’s sequential step wise adjustment method.63 In this method the unadjusted p-values are arranged in an ascending order (from the smallest to the largest) and each unadjusted p-value is adjusted by multiplying with m-j+1, where m refers to the total number of tested hypotheses and j is the rank of the unadjusted p-value in the ordered list. The Holms method is less conservative than the Bonferroni method and the hypothesis rejected by the Bonferroni method would also be rejected in the Holm’s step down procedure.
32
Benjamini and Hochberg proposed a false discovery rate (FDR) method as a second measure to handle multiple testing problems.64 This method allows a certain percentage of false positive hypotheses among all rejected hypothesis. The FDR is defined as the expected fraction of false positive identifications or hypothesis among all rejected hypotheses. The FDR is calculated at certain threshold (α) by dividing the number of false positives (FP) with the total number of rejected hypothesis i.e., true positives (TP) and false positives (FP). Thus, peptide-spectrum matches need to reach statistical significance values that surpass the stringent threshold that controls for multiple hypothesis testing.
1.8 FDR VIA TARGET-DECOY APPROACH
In the MS/MS-based peptidomics studies, the FDR can also be calculated using the target-decoy database search strategy41, 65-68 or mixture model approach. The target-decoy approach (TDA) is the simplest and most popular approach to estimate error rate. This approach is easily applicable to several experimental setups and demonstrates the ability of the scoring functions to distinguish between correct and incorrect peptide-spectra identifications. The TDA is based on the assumption that the score distribution of incorrect matches from the target database is identical to the score distribution of the decoy matches.
The accuracy of the TDA based FDR estimates depend on the way the target decoy search strategy is conducted. First, the decoy sequences can be generated either through sequence reversal, shuffling, or randomization. Details on the decoy construction methods are given in the next section. However, various studies have reported that the type of the decoys have little to no effect on the FDR estimates. Second, the tandem spectra can be searched against the combined
33
target-decoy database (concatenated database) or target database can be searched separately from the decoy database to obtain correct and random score distributions. The concatenated target-decoy database searches are preferred over separate target and decoy database searches because separate searches can produce conservative estimates. This is because in the absence of competition between target and decoy peptides for the same spectra the decoy peptides can receive higher scores relative to the concatenated search strategy.41, 65, 68 Third, the choice of the formula to compute FDR can produce