0099-2240/91/071997-08$02.00/0
Copyright© 1991, American Society for Microbiology
In
Situ Measurement
of Methane Oxidation in Groundwater by
Using Natural-Gradient Tracer
Testst
RICHARD L. SMITH,'* BRIAN L. HOWES,2AND STEPHEN P. GARABEDIAN3
WaterResources Division, U.S. GeologicalSurvey, Lakewood, Colorado802251; BiologyDepartment, Woods Hole Oceanographic Institution, Woods Hole, Massachusetts 025432; and Water Resources Division, U.S. Geological Survey,
Marlborough, Massachusetts
017523
Received 11 February 1991/Accepted 17 April 1991Methane oxidationwasmeasuredinanunconfinedsand and gravelaquifer (Cape Cod, Mass.) by using in situnatural-gradient tracertests atbothapristine, oxygenated site andananoxic, sewage-contaminated site.
Thetracersiteswereequipped with multilevel sampling devicestocreate targetgrids of sampling points; the
injectatewas prepared withgroundwater from thetracersiteto maintain thesamegeochemical conditions.
Methane oxidation was calculated from breakthrough curves of methane relative to halide and inert gas
(hexafluoroethane) tracers and was confirmed by the appearance of
13C-enriched
carbon dioxide inexperi-mentsinwhich "3C-enrichedmethanewasusedasthetracer.A Vmaxfor methane oxidation could becalculated when themethane concentration was sufficiently highto result in zero-order kinetics throughout the entire transport interval. Methane breakthrough curves could be simulated by modifying a one-dimensional
advection-dispersion transport model to include a Michaelis-Menten-based consumption term for methane oxidation. The Kmvalues for methane oxidation thatgavethe best match for the breakthroughcurve peaks were 6.0 and 9.0 ,uM forthe uncontaminated and contaminated sites, respectively. Natural-gradient tracer
testsare apromising approach for assessingmicrobialprocessesandfor testing in situ bioremediation potential ingroundwatersystems.
Estimating the distribution and rates of microbial pro-cesses in groundwater environments has proven to be a difficulttask. This is because many problems arise when the traditional methods developed for soils or aquatic sediments are applied to subsurface systems (8). These approaches usually include attempting to obtain undisturbed and uncon-taminated subsurface samples and maintaining in situ condi-tions during activity measurements (29). However, many groundwater systems present the opportunity to assess microbial processes with a unique approach, the use of in situnatural-gradienttracer tests.Thesetestswereoriginally designed and have beenused primarily to study the hydro-geology ofaquifers (6, 19), but with appropriate modifica-tions theyhave thepotentialto assessmicrobialprocesses as well (23). The advantage of such tracer tests over other approaches is thatthey usenatural groundwaterflow (i.e., natural gradients) to transport tracers through undisturbed sections ofanaquifer (6, 7, 11, 19, 23, 27).
In this study, we adapted the tracer test technology to studyamicrobiallymediated process, methaneoxidation,in situ inan unconfined sand andgravel aquifer. We choseto
study methane oxidation because of the potential use of methaneinjectionas aninsitutreatmentprocessfor removal of halogenated aliphatic compounds from contaminated groundwater (25,27, 35)andpreliminarydataindicatedthat the potential for methane oxidation existed in the aquifer understudy. Using in situtracertechniques,we wereableto demonstrate that methane oxidation couldoccurwithin both a pristine, well-oxygenated region of the aquifer and a
nitrate-enriched, anoxic section,andby couplingtheresults with a groundwater transport model we were also able to determine the kinetics of methane oxidation under both
* Correspondingauthor.
tWoods Hole OceanographicInstitute contribution no.7633.
conditions. Our results demonstrate the utility of in situ natural-gradient tracer tests to study microbial processes in groundwater systems.
MATERIALSANDMETHODS
Study site. Thestudy site is afreshwater sandandgravel glacial outwash aquifer located on Cape Cod, Mass., which has been contaminated by land disposal oftreated sewage since1936.Theresulting contaminant plume ismorethan 3.5 kmlong, 0.9 kmwide,and 23mthick(17, 30). Ingeneral,the contaminantplumeconsists ofverticalandhorizontal
gradi-ents of specific conductance (50 to 400
iuS),
dissolved oxygen (0 to 8 mg/liter), pH (5 to 7.1), dissolvedorganic
carbon(1to4 mg/liter,muchof itrefractoryinnature), and inorganic compounds, such as chloride (0 to 28 mg/liter), sulfate(4to30 mg/liter), nitrate (0to 16 mg of N perliter),
andammonium (0to10 mgof N perliter) (4, 17, 18, 31, 33). These gradients haveresulted in
corresponding
distribution patterns of bacterial abundance andheterotrophic
uptake (12, 31). Thechemical makeup oftheplume,especially
with regard toinorganic nitrogenspecies, is similartothat asso-ciated with more than 17 x 106 residentialseptic
systems across the United States (3) and therefore represents in-creasingly common contamination conditions in regional aquifers. The aquiferreceiving
the contaminants is com-posedofstratifiedsand andgravel
witha meanparticle
size and porosity of 0.5 mm and 0.39, respectively (17), and a horizontalflowrateofabout 0.4mperday (6). Theground-watertemperature in the contaminantplume is 10 to 14WC
(17).
Tracer testsites. Methaneoxidationwas
assayed
insitu in thecenter ofthecontaminantplume
0.25 kmdowngradient
from the contaminant source and in an uncontaminated portionof the
aquifer by
using natural-gradient
tracertests. Eachsiteconsisted ofanarrayof15-portmultilevelsampling
1997
on January 17, 2021 by guest
http://aem.asm.org/
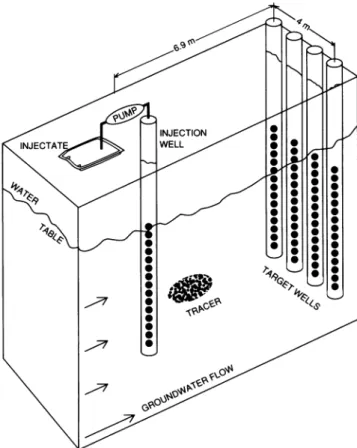
FIG. 1. Diagram ofthe well locations at the two small-scale, natural-gradienttracer test sites.
devices (MLSs) situated inthe same configuration (Fig. 1). Construction and installation ofthe MLSs have been de-scribed previously (19, 30). At the contaminated site (well F347), the verticalspacing between the MLS ports was 0.6 m, coveringthe interval from5.6 to 13.7 m below the land surface. For theuncontaminated site (wellF168)the vertical spacing betweentheports was 0.4 mfortheinterval from5.0 to 10.3 m below the land surface.
WatersampleswereobtainedfromeachportoftheMLSs with a peristaltic pump (30). Specific conductance was determined by using an electrode, oxygen was determined byiodometric titration (1), and nitrate wasdeterminedwith an Autoanalyzer(Lachat Instruments, Menquon, Wis.).
Tracer tests. The methods used to prepare the tracer solutions differed at the two tracer sites; each method was chosen with particular regard to maintaining the in situ oxygen concentration atthe site. In both cases, the tracer solution was composed of groundwater (100 liters) with-drawn from two adjacent ports ofthe upgradient injection wellMLS with aperistalticpump. Within the anoxic zone of thecontaminated site, thegroundwaterwas pumped into a gas-impermeablebag which had beenpreviouslyflushed five times with N2 and contained 1 liter of a concentrated N2-sparged solution of a conservative tracer (NaCl or NaBr). During the first tracer test, the bag was vented and tracer gases were added by simultaneously bubbling the solutionwith C2F6(14.7liters/min)and CH4 (1.6 liters/min) for1h. For thesecond tracer test 1 liter of
13CH4
(99% pure; Cambridge Isotope Laboratories, Woburn, Mass.) was addedtothebag(which was not vented) and wasallowedtoequilibrate
for 12 h. The excess CH4 gas was then vented,TABLE 1. Injectate compositionfor each of the natural-gradienttracertests
Injectate Injectate
Tracer test constituent concn'
Contaminatedsite Test 1 C1- 41.1 mM C2F6 25.1,uM CH4 85.0p.M Test 2 Br- 14.7 mM 13CH4 180.2
F.M
Uncontaminatedsite Br- 12.8 mM CH4 66.3 ,uM 02 225.0,uMa The values are averages of the values for subsamples takenduringthe
injectionprocess.
and the contents of the bag were thoroughly mixed. The tracersolutions werepumped back into the ground through the same two adjacent ports (0.6 m apart) of the
injection
well withaperistalticpump,takingcare toavoidinjection of any gas bubbles. Samples for gas and ion analysis of the tracersolution werecollected atthebeginning, middle, and end of the injection. For the uncontaminated, aerobic groundwater system, groundwater was pumped into an open container,MgBr2 was added,and the solutionwas bubbled withCH4 (1.6 liters/min)and air(14.7liters/min)for 45min. The tracer was then injected into the ground in the same manner as described above for the contaminated site. The injectatecomposition for each of the tracer tests is shown in Table 1.
Water samples were taken daily with a peristaltic pump from each of the 60 ports in each of the sampling grids. The first 120 ml of each sample wasdiscarded,and the next 20 ml wascollected inasyringeandinjected into a stoppered 50-ml serumbottle, which was then inverted. Most samples were analyzed on the day ofcollection; afew were stored for 1to 3 days at 4°C. The dissolvedgases in the bottle headspace after equilibration at room temperature were assayed by gas chromatography (Porapak N; flame ionization
detector),
after which the halides were assayed with an ion-specific electrode (corroborated by using ionchromatography). For the
13C
tracertest, 1-litersamples werecollected, dissolved inorganic carbon was precipitated as SrCO3 (by adding 60 ml ofSrCl2 6H20 in NH4OH [4g/g]per liter of watersample) and filtered, and the13C/12C
content was determinedby
using mass spectrometry (31).
Model formulation. A modifiedadvection-dispersion equa-tion with a Michaelis-Menten utilization term was used to simulate the movement, spreading, and losses to microbial consumption of methane in the small-scale injection tests. The one-dimensional transport equation, which contains terms for storage, advection, dispersion, and degradation, canbe written as:
dc
a2c
ac Vmaxc-
=aD
ax-
v -+
at aX2 ax c+Km (1)
where c is theconcentration ofCH4 (or solute) insolution,t is time, D is the dispersion coefficient (= aLv), aL iS dispersivity, xis the spatial coordinate, vis thefluid veloc-ity, Vmax is the maximum rate ofCH4degradation,and Km is theMichaelis-Menten constant.
The modelingapproach used in this studyto simulatethe transport of methane was to find the physical parameter
on January 17, 2021 by guest
http://aem.asm.org/
values (aL, v) by calibrating analytical advection-dispersion model solutions to the observed breakthrough curves of the nonreactive solute (Cl- or Br-) and to find the microbial degradation parameters (Vmax, Kin)bycalibrating numerical solutions of equation 1 to observed methane breakthrough curves. In the case of chloride, there was no degradation (Vmax = 0), and the fluid velocity (v) was calculated from the known distance between the injection point and the sampling point(x1) and the time to the peak concentration (tpeak) for the breakthrough curve (v =
xl/tpeak).
The dispersivity parameter (aL) was obtained from the chloride curve by using the following relationship, which was derived from the one-dimensional solution of the advection-dispersion equa-tion with a pulse input (9):XL(At/tpeak)2
16 In (2)
(2)
where At is the duration of the breakthrough curve whenCl(,) >1/2
Clmax,
Clmax
is the peak concentration, and tpeak is the timetopeakconcentration.Equation1 wassolvedfor the reactive solute, methane, by using finite-difference approximations with a Crank-Nichol-sontime-steppingscheme (13). After the approximations are introduced, the equation is reduced to an algebraic form:
-D -v
c(x-lAxt+
At)[)2
+4(Ax)
+1 D Vmax 1
C(X,t
+L+Att
t)
++(AX)2
+ 2[Km + c(x,t +I~At)]_
+-D v
c(x+Ax,t+ At)
(A[)2
+ 4(x =D v
c(x -AX,t)
T(A-x+
4(Ax)
+c(x9t)[K.
+ + Lm +LAt
2[Km
+~~c(x,t)]
D -v
c(x+
Axt)[2(A
)2 + 4(Ax) (3) whereAx istheblocksize (0.1 m) andAtis the time step (0.1 day). Allofthe concentrationvalues ontheleft side [c(x-Ax,
t + At), c(x, t + At), c(x +Ax,
t + At)] are at thenewtimestep(t+At)and areunknown;theconcentration values ontheright side [c(x- Ax, t), c(x, t), c(x + Ax, t)]are atthe present-time level and are known. Equation 3 is nonlinear because concentration appears in the denominator of the Michaelis-Menten termontheleft side.Therefore, an itera-tive scheme is usedtosolve theequation.Theconcentration valueusedin thedenominator oftheMichaelis-Mententerm is held atavaluefrom the previous iteration level. The fixed value is then updated with every iterative step until the solution converges and is stable. After convergence the newlycalculated concentration values arethen used as the present-timevalues and anothersetis calculated for thenext time step, marching onwardin time. Because of the form of equation 3, a tridiagonal matrix solution is used, which is both efficient andaccurate. Restrictions onthe Peclet num-ber and the Courant number, required for model stability,
werecalculatedfor thesesimulations,and the blocksize and
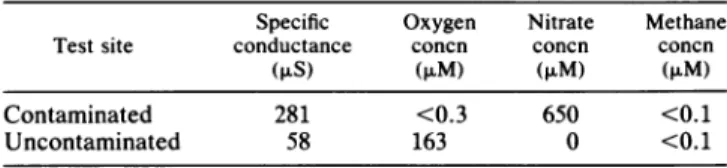
TABLE 2. Groundwater chemistry at the tracer test sites'
Specific Oxygen Nitrate Methane Testsite conductance concn concn concn
(,uS) ($LM) (>LM) (>M)
Contaminated 281 <0.3 650 <0.1
Uncontaminated 58 163 0 <0.1
aValuesatthedepth of the injection ports.
thetime step were limited to satisfy these restrictions (13). The root mean square error (RMSE), which was used to compare differences between the observed and predicted breakthrough curveconcentrations, was calculated byusing thefollowing equation:
RMSE = [- (Cpredicted - Cobserved) (4)
where nis the numberof observed concentration values (c). RESULTS
The two tracer sites were chosen to reflect the general differences in the geochemical environment between the contaminant plume and uncontaminated groundwater. The uncontaminated groundwater is well oxygenated, has a
specific conductance of 60 to 80 ,uS, and does not contain any of the characteristic constituents of the contaminant plume, suchasnitrateorammonium (Table2). However, the contaminant plume is anoxic or suboxic (dependingon the particular location and depth) and is characterized by re-gions of nitrate-containing groundwater. At the contam-inated tracer site there was no detectable oxygen and 650 ,uM nitrate (Table 2). The contaminant plume at this site extendsfrom 6to35 mbelow the land surface. Methane is not a constituent of the plume and was not present in detectable amounts ateithertracer testsite (Table 2).
Even though groundwater methane concentrations were below atmospheric equilibrium levels, natural-gradient
tracer tests demonstrated that the indigenous microbial populations within both the contaminated and uncontami-nated portions of the aquifer possessed the capability to
oxidize methane when itwas added to the
aquifer.
Tracer test breakthrough curves at the contaminated site demon-strated that methane, hexafluoroethane, and chloride were transportedatequivalentrateswithin theaquifer. Thepeak
concentration ofeachtracerarrivedatthesampling
wellon the same day (Fig. 2). However, when normalized to the injectate concentration, the two conservative components, hexafluoroethane and chloride, had identicalbreakthrough
curveswhile the methanecurve was
significantly
attenuated.Asimilar resultwasevident fora tracertestconductedatthe uncontaminated site(Fig. 3A), where underoxic conditions methane was significantly attenuated
during
transport through the aquifer. Because of differences in groundwater velocity, the arrival of the peaktracer concentration atthe uncontaminated site was 8 days later. Inaddition,
thehighest relative concentration
(C/CO)
of the conservative tracer at anysamplingportwas only 60%of the concentra-tionof the contaminated site.Foranygiven sample, the amountof methane consumed could be calculatedasthedifference between the dimension-less concentration
(C/CO)
for unattenuated transport(from
hexafluoroethane,
bromide,
orchloride)
and theon January 17, 2021 by guest
http://aem.asm.org/
0.14
_- C06
14 18 22 26 30 34 38
DAYS AFTER INJECTION
FIG. 2. Timecourse of the relative concentrations ofchloride, hexafluoroethane, and methane at the tracer site within the contam-inant plume. The data are from a sampling port that was 9.7 m beneath the land surface.
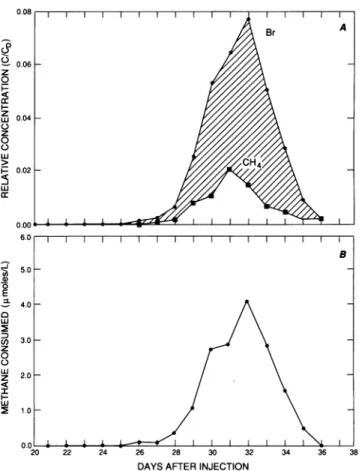
less concentration ofmethane, times the injectate methane
concentration. Figure 3B shows the result of this calculation
plotted as a function of time for the sampling port exhibiting
the highest tracer concentrations for the tracer test at the
uncontaminated site. The curve is shaped like a
break-through curve because it shows the amount of methane
consumed within various portions of the tracer cloud as the cloud passed by a fixed point (i.e., the fence of target wells).
To test the hypothesis that theattenuation of methane was
the result ofmethane oxidation, a second tracer test was
conducted at the contaminated site by using '3C-enriched
methane. Methane consumption was again evident at this
site; up to 7.6 ,umol of methane per liter was consumed
during 17 days of travel time between the injection well and
the target wells (Fig. 4A). The natural isotopic abundance
(5'3C) of dissolved inorganic carbon at this location in the
contaminant plume (and also at the target well fence just
prior to the arrival of the tracer) was -18.7%o(Fig. 4B). This
valueshifted to +11.5%oin the center of thetracer cloud and
then dropped back to -17.5%o immediately after the tracer
cloudhad passed the well fence (Fig. 4B). The '3CH4 tracer
contained no detectable CO2.
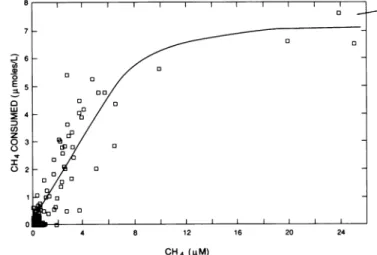
The amount of methane consumed during a tracer test
(expressed as concentration) was directly related to the
methane concentration within the tracer cloud as it passed
by thewell fence (Fig. 5). This relationship is empirical and
is site specific because it compares the total amount of
methane consumed over the entire transport interval (x1)
with the methane concentration at the end ofthe transport
interval. However, the relationship is reproducible for a
given site. Figure 5 shows a composite of the results from the
contaminated tracer test site for four sampling ports from
tracer test 1 and for two sampling ports from tracer test 2
(those ports for which CH4 was consumed and C/CO was
>0.01 at the CH4 peak). In general, the relationship at this
site indicated a first-order reaction when methane
concen-trations at the well fence were <6 ,uM and a zero-order
reaction when themethane concentration was >15 ,uM.The
maximum amount of methane consumed was 7,uM.The rate
ofmethane consumption could be calculated from this value
for any sample whichhad a methane concentration >15 ,uM
because theconcentration would have been >15 ,uMduring
0.06 z 0 z ,', 0.04 0 z 0 0.02 w o. 0:0 E 3.0DI A 60 0 4.0-I 3.0-01J 2.0222-6 2 0 2 3 6 3
DAYSAFTER INJECTION
FIG. 3. Time course of the relative concentrations ofbromide and methane(A) and theamountof methane consumed(B)atthe tracersite withinanuncontaminatedregionof theaquifer.Thedata arefromasamplingportthatwas7.26mbeneath thelandsurface. The methaneconsumption calculationwasbasedontheamountof methane missing compared with the amount of the conservative tracer(cross-hatchedareainpanel A).
the entire transport interval. This rate (Vmax) was0.4 FM/ day at the contaminatedtracersite.
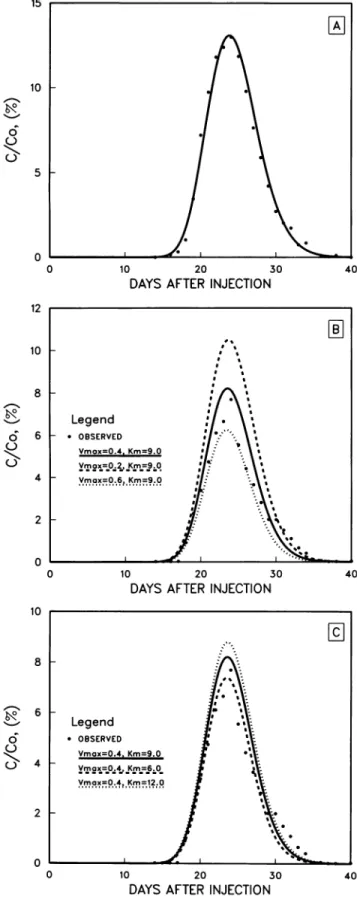
The computer modelwas able toeffectively simulate the breakthrough curves of both chloride and methane at the contaminated (Fig. 6) and uncontaminatedtracersites. The modelvelocity (v) and thedispersivity (CXL)parameters were calibratedby fitting the chloride breakthrough curves (Fig. 6A) with the Vmax set to zero (Table 3). The velocity and dispersivity were found to be somewhat lower for the uncontaminated site, reflectingthe longertransport time at that site(Fig. 2 and 3). Then, byusingthese values forvand aL, the Michaelis-Menten parameters
(Ki,m
Vmax) were de-termined by adjusting their values to match the model predictionsto themethanebreakthroughcurve.The model-simulated concentration values werefound to be inversely relatedto Vmax andparticularly sensitivetoVmaxatthepeak concentration values (Fig. 6B). Simulated concentrationswere foundto be directly related to the Km (Fig. 6C), and peak concentrations were again most sensitive to its changes.
The model does not have a unique solution for Km and Vmax; similar simulations can be obtained for completely differentsetsofvalues. However,because Km and Vmaxare
mathematically related, a unique Km can be obtained for eachgiven Vmaxbyoneoftwo methods.The Kmvalue can
on January 17, 2021 by guest
http://aem.asm.org/
0 LLJ w
CD
0a)
wE Z=L I w 0 m C) Co FIG. values f tracer te arefrom beobtai best fit through that be, The fir breakth emphas cloud. liter pei 5, the tracers mean s visual i extrapo comput maximl Smal natural an aqui Natural to asses potenti; bacteriathrough
0 0 o 0 C,) z 03 0 20 0 o 0 0 4 8 12 16 20 24 CH4(>M)FIG. 5. Relationship between theamountofmethaneconsumed foranygiven tracersample andthe measuredmethane
concentra-tion in thatsample. The plotis acomposite ofthe datafrom four depths (8.5, 9.1, 9.7,and 10.2mbelowthe landsurface) fromboth tracer teststhat wereconductedatthecontaminated site. potential to assessmicrobial processesingroundwater
hab-I / /X itats. Because the groundwater environment is similar to the
%/7_
sediments
of surface water environments and tosoils
insediet
sunsaturated
ofenvironments(i.e.,
in each case thevastmajor-I ] ,
ity
of the microbialcommunity
is attached toparticulate
10 12 14 16 18 20 22 24 surfaces), natural-gradient tracer tests represent a uniqueopportunity
tomeasurethe in siturateofamicrobial process DAYS AFTER INJECTION in an undisturbed, sediment-dominated ecosystem.4. Time course of methane consumption (A) and 813C The results of this study demonstrate that small-scale or dissolved inorganic carbon (DIC) (B) during a second natural-gradient tracer tests can be used to measure methane
st at the contaminated site with
13CH4
(99% pure).The data oxidation in a sand and gravel freshwater aquifer. The loss of asampling portthat was9.7 m beneath the land surface. methane during the tracer tests was not due to physical processes, such as dissolution of dissolved gases intobub-bles,
because bothaninert gas(C2F6)
and conservative ions inedbyselectingthe valueeitherbyusingastatistical were transported identically, or to retardation of methane by between the simulation and the methane break- sorption, because the shapes of the methane breakthroughcurve(Fig. 7) or by visually selecting the simulation curves were identical to the shapes of the conservativeion
st matches the peak concentration (Fig. 6B and C). curves. The observed attenuation of methane was most st approach gives equal emphasis for the entire likely the result of methane oxidation by the resident micro-rough curve, while the latter approach places more bial population within the aquifer. This process was clearly
;isonmethane
consumption
inthecenterofthetracer demonstrated as the operative mechanism with13CH4;
'3C
By
using
theVmax of0.40 ,imol of CH4consumed per enrichment of the dissolved inorganic carbon pool couldrdaydetermined from therelationshipshowninFig. only have resulted from oxidation of the
'3CH4
tracer. The Km for methane consumption at the contaminated symmetry of the CH4 breakthrough curves (Fig. 2 and 3) ;itewasdeterminedtobe 5.2FiM
when the leastroot suggests that the adaptation period for CH4 as a substrate quare error method was used and 9.0 ,uM when the was relatively short (<24 h) at both the contaminated and method was used. When this value for Vmax was uncontaminated tracer test sites, even though in situ CH4 latedtotheuncontaminated, aerobicsite,
the model concentrations were less than 0.7,uM
in each case. In Led a Km of 6.0 ,uM for the best match to the addition, the process exhibited a saturation type of kinetics am methane concentration. (Fig. 5), a clear indication of a biologically mediated process.During
its transportthrough
anaquifer,
a tracercloud is diluted because ofdispersion.
In sand andgravel
aquifers
DISCUSSION longitudinal dispersion is much greater than transverse ver-1-scale
natural-gradient
tracer teststakeadvantage
of tical andtransversehorizontaldispersion. Consequently,
thegroundwater flowtotransporttracersintroducedinto tracercloud remains narrow but becomes
elongated
in the ifer through an undisturbed section of theaquifer.
direction ofgroundwater
flow(19, 23).
During
atypical
1-gradient
tracer testshave been used in this manner small-scaletracertestthetracers areoftenonly
detectedat sstherelative transport ofinorganic compounds (19),
asingle
target MLS. Thegeneral
lack of verticalmixing
is alorganic
contaminants (23),viruses,
yeasts, and also evident on aplume-wide
basis at theCape
Codsite,
a (7), and indigenous groundwater bacteria (11)
resulting
inrelatively
steep vertical concentrationgradients
i various
aquifers.
These tracer tests also have the ofdissolvedconstituents,
such as oxygen and nitrate(30).
on January 17, 2021 by guest
http://aem.asm.org/
15 10 6 C-) N-I 5 0 12 10 8 6 4 2 0 10 8 6 4 2 0 0 10 20 30
DAYS AFTER INJECTION
0 10 20 30 40
DAYS AFTER INJECTION
TABLE 3. Valuesfor unknownparametersin themodel usedto
obtain best-fitsimulation
Test site (rn/day)V OLct (m)i) (p.M/day)Vmax GpM)
KM
Contaminated(anoxic) 0.285 0.065 0.4a 9.0b Uncontaminated (oxic) 0.220 0.0104 0.4a 6.0b
aValueobtainedempirically frombreakthrough curves at thecontaminated
tracersite(seeFig.5).
bBest-fit selection based on visualinspection of peak concentrations of breakthroughcurves.
Smallvertical dispersion also meansthat fine-scale vertical resolution is possible during these small-scale tracer tests when it is desirable to restrict the tracer to narrow vertical zones.
_.4 The neteffect of dispersion is that the concentration ofa 40 traceris continually being reduced. Consequently, when a
traceris the substrate ofamicrobially mediated reaction, the rate of the reaction also changes, probably in accordance with Michaelis-Mentenkinetics, as the tracer is transported. However, the rate ofreaction is constant inthose cases in which the tracer concentration is high enough to result in a zero-order reaction during the entire transport interval. In thatsituation, theamountoftracerconsumed isindependent of thetracerconcentration (Fig. 5), and ina manner analo-gous to the saturation type ofkinetics, such consumption could be termed maximum consumption. The Vmax of the reaction canthen becalculated for each sample that results inamaximumconsumption value by dividing the consump-tion term by the transport time. In this study, a Vmax for methane oxidation at the contaminated site (0.4 ,uM/day) wascalculated by using this approach.
90l 70 60 _E IV 0 10 20 30 40
DAYS AFTER INJECTION
FIG. 6. Model simulation(curves) and observed relative
concen-trations (data points) of the breakthrough of chloride (A) and
methane(B andC)atthetracersitewithin the contaminant plumeat
9.7mbelowthe land surface. PanelsB andC show the sensitivity of
the model simulation to different values for Km (micromolar) and Vmax(micromolarperday).
50 40 30 20 10 0 _ 0.2 0.6 1.0 1.4 1.8 2.2
Vmox (u.M day1)
FIG. 7. Best-fitrelationship between Km and Vmax for methane oxidation as simulated by the transport model for the methane
breakthrough curve shown in Fig. 2. The solid line is a linear
regression of theKm values yielding the lowestroot mean square
error(RMSE) for each given Vmax. The dashed linesareequal-value
contoursof therootmean square error.
6 C) C-) C-RMSE 0.6 ,0.5 // 0.54 0.4 / / I 0.4 // / / 0.5
///
/ /7 s /7 77l 7/K~z /7K~~~ -/7 K -1.1on January 17, 2021 by guest
http://aem.asm.org/
Downloaded from
The interpretation of these types of tracer studies in groundwater systems can be significantly augmented by applying an advection-dispersion transport model that also accountsfor substrateconsumption by microbial processes to simulate the tracer test results. The model used in this study calculates the amount of methane consumed during discrete time intervals(0.1 day)basedonMichaelis-Menten kinetics, and it calculates dilution of the methane in the tracercloud because of dispersion. When this approach is used,the model caneffectively simulate the methane break-through curves (Fig. 6). Although the modeling approach doesnotallow foraunique solution for both kinetic param-eters,ifthere isinformationtodetermineoneofthe param-etervalues independently, the model can be used to deter-mine the other value. Then the rateofmethaneoxidation can bepredictedatanypointwithin the transport interval. As we demonstrate above, it is possible to determine the
V.max
value ofaprocessand then use the model to determine the Km.Thismakes the tracertest-model combination a power-ful toolforstudyingmicrobial processes in situ in a nondis-ruptive manner.Although the model does not account for microbial growth, this factor didnotappear tobe necessary to model methane oxidation within the context of this study. More than95% ofthemicrobial populationin theCape Cod aquifer isattachedtosolid surfaces (12) and is presumed to remain immobile as the tracer cloud passes by it. In general, the contact time with the tracer was short, which tended to
diminish growth as afactor, especially when methane was the substrate andwaspresentonlyatrelatively low concen-trations.Thelongestcontacttime with the tracer was for the
population
at the well fence (longer transport time means greaterdispersion). In thecaseofthecontaminatedsite,the maximum contact time was 16 days (Fig. 2); however, the methane concentration exceeded the calculatedKm (9 ,LM) for only 4 days. For comparison, when the frequency ofdividing
cells was used as an instantaneous estimate, the generation times oftheunattached bacteriain thecontami-nant plume were up to 5.8 days (10). Obviously, there are many other substrates andevenothersituationswith meth-ane as the tracer for which growth would be a significant factor and could not be ignored. Thus, incorporation of growth kinetics into the transport equation should be
con-sidered forfutureapplications ofthis model.
Methaneoxidationhasbeensuggestedas asuitable mech-anism for in situ bioremediation ofgroundwater
contam-inated with halogenated aliphatic compounds (35). Indeed, there are currently bioremediation efforts in progress that areattemptingtoexploitthis process foraquiferrestoration (25, 27). Therefore, it is pertinentto notethat themicrobial
populations
in both an uncontaminatedportion
and a con-taminated portion ofthe Cape Cod aquifer possessed theability
to oxidize methane, eventhough
it is notnaturally
present inthegroundwater. If this occurrence wereindeed widespread, this predisposition for methane oxidation in groundwatercouldbean
important
factorwhen theactivity
isconsidered as one ofthe
options
for in situ remediation. Thepotentialformethanotrophic activitywithin theaquifer
isprobablyenhancedby alimited
availability
ofdegradable
organic substrates,
even within the center of the contami-nantplume (2). Hence,heterotrophic activity
islikely
tobe low comparedwith many other habitats(28, 30), which isa situationthat tendstofavor the establishment ofautotrophic
and methylotrophic populations.
Quantifyingandcharacterizingratesof methane oxidation in aquatichabitats aredifficult tasks. For thisstudy, tracer
methane concentrationswere
sufficiently
low topreclude
a Vmax determinationattheaerobic siteby usingthe maximumconsumption
method(Fig. 5). Consequently,
the Vmaxvalue forthecontaminated sitewasused(somewhat arbitrarily)
to determinetheKmfor theuncontaminatedsite. Thesimilarity
of the methane
consumption
curvessuggeststhat therewas not a large difference in themethanotrophic
populations
between the contaminated anduncontaminated
sites,
despite
a50-fold difference in the total unattached microbial popu-lation between thetwosites(12,
30).
Rudd and Hamilton(26)
foundaKm for aerobic methane oxidation inaCanadian lake (4.7
p,M)
that was similar tothe aerobic Km found in thisstudy
(6.0 ,uM),buttheVmaxwasmorethan 10-foldhigher
in the lake(7.7 versus0.4 ,uMday-'),
probably reflecting
the factthat methanewasnaturally
presentwithin the lake. The Kmformethaneoxidationinlandfill soilswas2.5to6.2,uM
(34),while twostudiesinvolving
surface sedimentsofLakeWashington
found valuesof8.3 to 10.7 ,M (21) and 5.1 to 10.0 ,uM (16). These values agree well with the values obtainedinourgroundwater study (Table 3).
Thereis very little information availableconcerning
thekineticsof anoxic methane oxidation. Iversen etal.(15) reported
afirst-orderrate constantof 0.06
day-'
forthewatercolumnofasalinelake,
which is similar to the value found in thisstudy
(VmaxlKm
= 0.05day-').
Anoxic methane oxidation hasbeen the focus ofseveral recent
investigations
(14,15,
20, 24). There isgrowing
evidence that this process occurs in surface watersystems
(marine
andfreshwater),
both in sediments and in water columns.Although
it has not beendirectly
proven, sulfate reduction is often considered to be theelectron-accepting
stepin these habitats
(5, 14).
Littleattentionhasbeengiven
tonitrateas apotential
electronacceptorforanoxicmethaneoxidation,
eventhough
itwould haveanenergyyield
that is morethananorderofmagnitude higher
than thatofsulfate reduction.However,
therearereportsofmethaneoxidationcoupled
todenitrification in thewastewater treatment liter-ature(32).
Although
the electron acceptor could not be ascertained inthisgroundwater study,
nitrate seemstobealikely candidate, given
itsavailability
and energyyield.
Denitrification does occur at the contaminated tracer site and within the
depth
interval that the tracer wasinjected
(31).
Thedenitrifying
zonealso containssulfate(40 ,uM)
and soluble iron (2,uM)
but no detectablehydrogen
sulfide orferrous sulfide and no iron
oxyhydroxides (22). Hence,
sulfate reduction and iron reduction do not appear to be involved.
In summary,small-scale
natural-gradient
tracer testswereused to measure methane oxidation at two locations in a
sand and
gravel
aquifer,
apristine
oxic location and ananoxic zone of a contaminant
plume.
Methane-oxidizing
activity
wasevidentatboth siteseventhough
methanewasnot
naturally
present in thegroundwater.
The amount of methane consumed wasdirectly
related to the methaneconcentration,
whichwasalsostrongly
influencedby
disper-sion
during
the transport process. The kinetics of methane oxidationwerecalculatedby
using
aniterativegroundwater
advection-dispersion
model thatcontained a methanecon-sumption
term based on Michaelis-Menten kinetics. Our results suggest that methaneoxidation could beexploited
asa bioremediation tool in this
aquifer,
if it werewarranted,
andatthesametime
they
demonstrate theutility
ofnatural-gradient
tracer testsincharacterizing
microbialprocessesin situ ingroundwater
environments.on January 17, 2021 by guest
http://aem.asm.org/
ACKNOWLEDGMENTS
Wethank D. LeBlanc and R. Harvey for valuable discussions and assistance in equipping the tracer test sites and J. Duff, M. Ceazan, and M. Brooks for field and analytical assistance. We also thank R. Harvey and D. Lovleyfor helpful reviews.
This study was funded by the U.S. Geological Survey Toxic WasteGroundwater Contamination Program.
REFERENCES
1. AmericanPublic HealthAssociation. 1981.Standard methodsfor theexamination of water and wastewater, 15th ed. American PublicHealthAssociation, Washington,D.C.
2. Barber, L. B., II. 1988. Dichlorobenzene in groundwater: evi-dence forlong-term persistence. Ground Water26:696-702. 3. Canter, L. W., and R. C. Knox. 1985.Septictank systemeffects
ongroundwaterquality. Lewis Publishers, Ann Arbor, Mich. 4. Ceazan, M. L., E. M. Thurman, and R. L. Smith. 1989.
Retardation ofammonium and potassium transport through a contaminated sand and gravel aquifer: the role of cation ex-change. Environ. Sci. Technol.23:1402-1408.
5. Devol, A. H., and S.I. Ahmed.1981. Arehighratesofsulphate reductionassociatedwith anaerobicmethaneoxidation?Nature (London)291:407-408.
6. Garabedian, S. P., D. R. LeBlanc, L. W. Gelhar, and M. A. Celia. 1991. Large-scale natural-gradienttracertestinsand and gravel, Cape Cod, Massachusetts: 2. Analysis ofspatial mo-mentsforanonreactivetracer.WaterResour. Res. 27:911-924. 7. Gerba, C. P. 1984. Microorganisms asgroundwatertracers, p. 225-233. In G. B. Bitton, and C. P. Gerba (ed.), Groundwater pollution microbiology.J. Wiley & Sons,New York.
8. Ghiorse, W. C.,and J. T. Wilson. 1988.Microbialecologyofthe subsurface. Adv. Appl. Microbiol. 33:107-172.
9. Harvey, R. W., and S. P. Garabedian. 1991. Use of colloid filtration theory in modeling movement of bacteria through a contaminated sandy aquifer. Environ.Sci. Technol. 25:178-185. 10. Harvey, R. W., and L. H. George. 1987.Growthdeterminations for unattached bacteriain acontaminatedaquifer. Appl. Envi-ron. Microbiol. 53:2992-2996.
11. Harvey, R. W., L. H. George, R. L. Smith, and D. R.LeBlanc. 1989. Transport of microspheres and indigenous bacteria through a sandy aquifer: results of naturalandforced-gradient tracer tests. Environ. Sci. Technol. 23:51-56.
12. Harvey, R. W., R. L. Smith, and L. H. George. 1984. Effect of organic contaminationuponmicrobial distributions and hetero-trophic uptake in a Cape Cod, Mass, aquifer. Appl. Environ. Microbiol. 48:1197-1202.
13. Huyakorn, P. S., and G. F. Pinder. 1983. Computational meth-ods insubsurface flow. Academic Press, Inc., NewYork. 14. Iversen, N., and B.Jorgensen. 1985.Anaerobic methane
oxida-tion rates at the sulfate-methane transioxida-tion in marine sediments from Kattegat and Skagerrak (Denmark). Limnol. Oceanogr. 30:944-955.
15. Iversen, N., R. S. Oremland,and M. J. Klug. 1987. Big Soda Lake (Nevada). III. Pelagic methanogenesis and anaerobic methane production. Limnol. Oceanogr.32:804-814.
16. Kuivila, K. M., J. W. Murray, A. H. Devol, M. E.Lidstrom, and C. E. Reimers. 1988. Methanecycling inthesediments of Lake Washington. Limnol.Oceanogr. 33:571-581.
17. LeBlanc, D. R. 1984. Sewage plume in a sand and gravel aquifer, Cape Cod, Massachusetts. U.S. Geological Survey Water Sup-plyPaper 2218. U.S. Geological Survey, Washington, D.C. 18. LeBlanc, D. R. (ed.). 1984. Movement and fate of solutes in a
plume of sewage-contaminated groundwater, Cape Cod,
Mas-sachusetts: U.S. Geological Survey Toxic Waste Groundwater Contamination Program. U.S. Geological Survey Open-File Report84-475. U.S. Geological Survey, Washington, D.C. 19. LeBlanc, D. R., S. P. Garabedian, K. M. Hess, L. W.Gelhar,
R. D. Quadri, K. G. Stollenwerk, and W. W. Wood. 1991. Large-scalenatural-gradienttracertest in sand andgravel, Cape Cod, Massachusetts: 1. Experimental design and observed tracermovement. Water Resour. Res. 27:895-910.
20. Lidstrom, M. E. 1983. MethaneconsumptioninFramvaren,an
anoxicfjord. Limnol.Oceanogr. 28:1247-1251.
21. Lidstrom, M. E., and L. Somers. 1984. Seasonal studies of methaneoxidationin Lake Washington.Appl. Environ. Micro-biol.47:1255-1260.
22. Lovley, D. R. (U.S. Geological Survey.) 1989. Personal
commu-nication.
23. MacKay, D. M., D. L. Freyberg, P. V. Roberts, and J. A. Cherry. 1986. A naturalgradient experimentonsolutetransport in a sand aquifer. I. Approach and overview oftracer move-ment.Water Resour. Res.22:2017-2029.
24. Reeburgh, W. S. 1980.Anaerobic methane oxidation:ratedepth distributions in Skan Bay sediments. Earth Planet. Sci. Lett. 47:345-352.
25. Roberts, P. V., L. Semprini, G. D. Hopkins, D. Grbic-Galic, P. L.McCarty, andM.Reinhard. 1989. In-situaquifer
restora-tionofchlorinatedaliphatics bymethanotrophicbacteria. U.S. Environmental Protection Agency Project SummaryEPA/600/ S2-89/033. U.S. Environmental Protection Agency, Washing-ton, D.C.
26. Rudd, J. W. M.,andR. D.Hamilton. 1975. Factorscontrolling ratesof methane oxidation and the distribution of themethane oxidizersinasmallstratifiedlake. Arch.Hydrobiol.75:522-538. 27. Semprini, L.,P. V.Roberts, G. D.Hopkins, and P. L.McCarty. 1990. Afield evaluationof in-situbiodegradation of chlorinated ethenes. II. Results of biostimulation and biotransformation experiments. GroundWater28:715-727.
28. Smith, R. L., and J. H.Duff. 1988.Denitrification inasand and gravel aquifer. Appl. Environ. Microbiol. 54:1071-1078. 29. Smith, R. L., and R. W. Harvey. 1991.Developmentofsampling
techniques to measure in situ ratesofmicrobial processes in a contaminated sand and gravel aquifer, p. 2-19-2-32. In C. B. Fliermans and T. C. Hazen (ed.), Proceedings of the First International SymposiumonMicrobiology of theDeep Subsur-face. Westinghouse SavannahRiverCo. InformationServices, Aiken, S.C.
30. Smith, R. L., R. W. Harvey, and D. R. LeBlanc. 1991. Impor-tanceof closely spaced vertical samplingindelineatingchemical andmicrobiological gradients in groundwater studies. J. Con-tam. Hydrol.7:285-300.
31. Smith, R. L.,B. H.Howes, andJ.H.Duff.1991.Denitrification in nitrate-contaminatedgroundwater: occurrence in steep ver-tical geochemical gradients. Geochim. Cosmochim. Acta 55: 1815-1822.
32. Sollo, F. W., Jr., H. F. Mueller, and T. E. Larson. 1976. Denitrification ofwastewatereffluents with methane. J. Water Pollut. ControlFed.48:1840-1842.
33. Thurman, E. M., L. B. Barber, and D. R. LeBlanc. 1986. Movement andfate of detergents ingroundwater: afield study. J.Contam. Hydrol. 1:143-161.
34. Whalen, S. C., W. S. Reeburgh, and K. A. Sandbeck. 1990. Rapid methane oxidation in landfill cover soil. Appl. Environ. Microbiol.56:3405-3411.
35. Wilson, J. T., and B. H. Wilson. 1985. Biotransformation of trichloroethylene in soil.Appi. Environ. Microbiol. 49:242-243.