NOVEL CONTINUOUS-TIME LOW-PASS FILTER
A Thesis by FEIFEI LIU
Submitted to the Office of Graduate and Professional Studies of Texas A&M University
in partial fulfillment of the requirements for the degree of MASTER OF SCIENCE
Chair of Committee, Jose Silva-Martinez Co-Chair of Committee, Aydin Karsilayan Committee Members, Jiang Hu
Duncan M. (Hank) Walker Head of Department, Miroslav M. Begovic
December 2015
Major Subject: Electrical Engineering
ii ABSTRACT
Continuous-time analog filters are important blocks for analog-to-digital converter (ADC) and IF filtering in receivers. Nowadays, cost and power consumption are major concerns for portable devices, so a low-power high performance solution is a great need.
The thesis proposes a novel continuous-time filter topology and implements a 10MHz low-pass filter achieving a signal-to-noise-and-distortion ratio (SNDR) of 70dB with only 1.3mW power consumption. This novel filter topology has an inherent low-noise property which alleviates the trade-off between low-noise and power consumption. The design considerations including frequency response, stability, noise, and distortion are presented. Since the performance of filters mainly depends on the amplifier, an AC-coupled class-AB OTA is proposed for the novel filter to improve the power efficiency and out-of-band linearity. The filter is implemented in IBM 130nm process and highly linear voltage-to-current converter and output buffer are also designed for testing. Compared with Tow-Thomas Biquad counterpart, the proposed filter saves about 40% power consumption for the same filter transfer function. Therefore, this proposed novel filter is a competitive filter topology for low-noise and low-power applications.
iii DEDICATION
iv
ACKNOWLEDGEMENTS
I would like to express my deep appreciation to my advisor Dr. Jose Silva-Martinez for giving me the inspiration and instruction in my research. The long discussion with him helped me accumulate lots of intuition about analog circuits and understand the general methodology of research. I would like to thank my co-chair of committee Dr. Aydin Karsilayan who gave me valuable advice. I am also very grateful to my committee members Dr. Jiang Hu and Dr. Hank Walker for their guidance and support throughout the course of this research.
I would like to thank Fan Gui, Qiyuan Liu, Alexander Edward and Carlos
Briseno-Vidrios for their friendship, generosity and many good advice for my research. I would also like to thank Ella Gallagher and Tammy Carda for their support in
administrative tasks.
Finally, thanks to my father and mother for their support, encouragement and belief in me throughout my graduate studies.
v TABLE OF CONTENTS Page ABSTRACT ...ii DEDICATION ... iii ACKNOWLEDGEMENTS ... iv TABLE OF CONTENTS ... v
LIST OF FIGURES ...vii
LIST OF TABLES ... xi
1. INTRODUCTION ... 1
1.1 Overview of analog filters ... 1
1.2 Thesis organization ... 4
2. DESIGN OF THE NOVEL FILTER ... 5
2.1 The idea ... 5
2.2 Filter topology ... 10
2.3 General design considerations ... 12
2.3.1 Components value ... 12
2.3.2 Effect of real OTA and Op-amp ... 15
2.3.3 Loop stability ... 22 2.3.4 Noise analysis ... 30 2.3.5 Distortion analysis ... 34 3. CIRCUITS IMPLEMENTATION ... 38 3.1 Class-AB OTA ... 39 3.1.1 Input stage ... 41 3.1.2 Class-AB operation ... 44
3.1.3 Common mode feedback ... 44
3.1.4 Performance summary ... 49
3.2 Voltage-to-current converter ... 51
3.3 Output buffer ... 59
4. LAYOUT AND POST-LAYOUT SIMULATION ... 62
vi
Page
4.2 Post-layout simulation results ... 65
4.2.1 Closed-loop frequency response ... 65
4.2.2 Open-loop frequency response ... 66
4.2.2 In-band linearity ... 67
4.2.4 Out-of-band linearity ... 69
4.2.5 In-band integrated noise ... 71
5. COMPARISON WITH TOW-THOMAS BIQUAD ... 73
5.1 Tow-Thomas Biquad ... 73
5.2 Circuits implementation ... 75
5.3 Simulation results and comparison ... 80
6. CONCLUSION ... 88
vii
LIST OF FIGURES
Page
Figure 1 Direct-conversion receiver architecture ... 1
Figure 2 Example of Active-RC filter ... 2
Figure 3 Example of OTA-C filter ... 3
Figure 4 Example of switched-capacitor filters ... 4
Figure 5 Proposed filter idea in receiver frontend ... 5
Figure 6 Concept of proposed filter ... 6
Figure 7 Schematic of GIC ... 7
Figure 8 Impedance choice in GIC ... 7
Figure 9 Concept of impedance scaler ... 8
Figure 10 Implementation of impedance scaler ... 9
Figure 11 Filter topology ... 10
Figure 12 Filter driven by current source ... 12
Figure 13 Frequency response of second order system with different Q ... 13
Figure 14 Example of OTA and Op-amp ... 15
Figure 15 Ideal small signal model of OTA and Op-amp ... 16
Figure 16 Input impedance derivation using ideal model of Op-amp ... 16
Figure 17 Input impedance derivation using ideal model of OTA ... 17
Figure 18 Input impedance by using different amplifier model ... 18
Figure 19 Filter response by using different amplifier model ... 19
Figure 20 Filter response by using different Gm of OTA ... 20
Figure 21 Filter response with different OTA bandwidth ... 21
viii
Page
Figure 23 Open-loop circuits with macro-model of two-stage OTA ... 23
Figure 24 Decomposition of filter loop gain in simulation ... 24
Figure 25 Circuit of first part ... 24
Figure 26 Approximation of first part ... 25
Figure 27 Load driven by OTA ... 26
Figure 28 Simulation of input impedance of the load ... 26
Figure 29 Open-loop circuits of the second part with equivalent capacitor ... 27
Figure 30 Approximation of second part ... 28
Figure 31 Further simplified approximation of loop gain ... 29
Figure 32 Noise sources in the proposed filter ... 31
Figure 33 Circuits for noise analysis ... 31
Figure 34 Plots of noise transfer functions ... 33
Figure 35 (a) Inverting amplifier (b) Model of non-linearity ... 34
Figure 36 Non-linear model of proposed filter ... 35
Figure 37 Top level on-chip schematic ... 38
Figure 38 Class-AB OTA schematic ... 40
Figure 39 Input differential pair with mismatch ... 43
Figure 40 Simplified model of amplifier ... 45
Figure 41 Block diagram of CMFB ... 46
Figure 42 Transient response test setup for CMFB ... 47
Figure 43 AC response of CMFB for class-AB OTA ... 48
Figure 44 Transient response of CMFB for class-AB OTA ... 48
ix
Page
Figure 46 Differential output spectrum and transient of class-AB OTA ... 50
Figure 47 Typical linear voltage-to-current converter ... 51
Figure 48 Proposed voltage-to-current converter ... 52
Figure 49 Complete circuits of V-I converter with single stage OTA ... 52
Figure 50 Common-mode half circuits of Figure 49 ... 53
Figure 51 AC response of CMFB in Figure 49 ... 54
Figure 52 Current mirror OTA for proposed V-I converter ... 54
Figure 53 Common-mode half circuits of V-I converter with current mirror OTA ... 55
Figure 54 AC response of CMFB in V-I converter with current mirror OTA ... 56
Figure 55 Transient response of CMFB in V-I converter with current mirror OTA ... 56
Figure 56 Small signal model of loop gain in proposed V-I converter ... 57
Figure 57 Open-loop response of V-I converter ... 58
Figure 58 Output buffer schematic ... 59
Figure 59 Schematic of OTA used in output buffer ... 59
Figure 60 Common-mode half circuits of output buffer ... 60
Figure 61 AC response of CMFB in output buffer ... 61
Figure 62 Transient response of CMFB in output buffer ... 61
Figure 63 Top-level test circuits ... 62
Figure 64 Chip layout ... 63
Figure 65 Building blocks on the layout ... 64
Figure 66 Closed-loop AC response comparison (Magnitude) ... 65
Figure 67 Closed-loop AC response comparison (Phase) ... 66
x
Page
Figure 69 Transient waveform of two-tone test for in-band linearity ... 68
Figure 70 Output spectrum of two-tone test (9.6MHz and 9.8MHz) ... 68
Figure 71 IM3 performance versus frequency ... 69
Figure 72 Output spectrum of two-tone test (20MHz and 30MHz) ... 70
Figure 73 Output spectrum of two-tone test (30MHz and 50MHz) ... 71
Figure 74 Integrated noise of filter only from 1Hz to 10MHz ... 71
Figure 75 Output dynamic range of the proposed filter ... 72
Figure 76 Tow-Thomas Biquad ... 73
Figure 77 Noise analysis in Tow-Thomas Biquad ... 74
Figure 78 Proposed filter used along with PGA for comparison ... 75
Figure 79 Tow-Thomas Biquad for comparison ... 76
Figure 80 Class-AB OTA with Miller compensation ... 79
Figure 81 Closed-loop response comparison (a) Tow-Thomas Biquad (b) proposed filter ... 81
Figure 82 (a) Open-loop circuit (b) Open-loop AC response of the first amplifier ... 81
Figure 83 (a) Open-loop circuit (b) Open-loop AC response of the second amplifier .... 82
Figure 84 (a) Open-loop circuit (b) Open-loop AC response of proposed filter ... 82
Figure 85 Output spectrum comparison (a) Tow-Thomas Biquad (b) proposed filter .... 83
Figure 86 IM3 performance versus frequency comparison ... 83
Figure 87 Output spectrum of Tow-Thomas Biquad. Input tones at (a)20MHz and ... 84
Figure 88 Output spectrum of proposed filter. Input tones at (a)20MHz and 30MHz .... 85
xi
LIST OF TABLES
Page
Table 1 Target spec of proposed filter ... 12
Table 2 Final choice of component value ... 14
Table 3 Details of components for OTA in Figure 38 ... 40
Table 4 Class-AB OTA performance summary ... 50
Table 5 Details of components for OTA in Figure 52 ... 55
Table 6 Details of components for OTA in Figure 59 ... 60
Table 7 Pin connections of chip layout ... 64
Table 8 Target specifications for both cases ... 76
Table 9 Component values in Figure 78 ... 77
Table 10 Component values in Figure 79 ... 77
Table 11 Component details of OTA for proposed filter in Figure 78 ... 78
Table 12 Component details of OTA for PGA in Figure 78 ... 78
Table 13 Component details for OTA in Figure 80 ... 79
1
1. INTRODUCTION
1.1 Overview of analog filters
Analog filters have played an important role in telecommunications. Even though filtering is often preferred in digital domain due to the ease of implementation and immunity of manufacturing variations, analog filters have unique properties and must be used in some applications such as anti-aliasing filter for ADC in the receiver frontend [1].
0 90 PGA ADC PGA ADC LPF LPF BPF LNA LO
Figure 1 Direct-conversion receiver architecture
Figure 1 shows the architecture of Direct-conversion receiver which is very popular for fully integrated multi-standard receiver. And the low-pass analog filters are usually placed after the mixer to reject the blockers and adjacent channels to provide anti-aliasing for the Analog-to-Digital Converter (ADC).
There are three basic categories in analog filters: active-RC filters, OTA-C filters and switched-capacitor filter. The active-RC filters are featured as the amplifier in negative feedback configuration and an example is shown in Figure 2.
2 i
V
o
V
Figure 2 Example of Active-RC filter
This type of filter has the best linearity due to the feedback but the high performance relies on a high loop gain which is limited by stability. So the active-RC filters have limited cutoff frequency which is typically in the order of 107Hz. And the cutoff
frequency and quality factor usually depends on RC product and resistor ratio, which are quite sensitive to the process variation. And the accuracy can be as worse as 20% [2]. So the some tuning techniques are used to solve this issue.
OTA-C filters are using amplifier (OTA) in open-loop configuration so that it can provide cutoff frequency more than several 108 Hz. Besides, the time constant depends on the capacitor and the transconductance of the OTA which is proportional to bias current, so the tuning is easy to do. One disadvantage is the distortion. Since the OTA has very small linear range, some linearization techniques must be used to reduce distortion. Moreover, the parasitic capacitance must be negligible compared with the load capacitance, which sets the upper limit of the operation frequency [2]. And an example of OTA-C filters is shown in Figure 3.
3 i
V
o
V
Figure 3 Example of OTA-C filter
Switched-capacitor filter belong to discrete-time filters. As shown in Figure 4, two non-overlapping clocks are used to charge and discharge the capacitor C1so that it
behaves like a resistor with the value of 1/fclkC1, where fclk is the clock frequency. And
many switched-capacitor filters can be obtained by substituting the resistors in active-RC filters with this emulated one. Such emulated resistor has two great advantages. The first one is the value of resistor can be very large. For example, if C1is 1pF and fclk is 100kHz,
the emulated resistor will be 10MΩ. Thus, some low frequency filters requiring a large time constant can be easily integrated by using switched-capacitor filters. The other one is the accuracy. The time constant in switched-capacitor filters depends on the ratio of capacitors and the absolute value of clock frequency. The accuracy of capacitor ratio is around 0.2% [2] and the clock is usually from the phase-locked-loop (PLL), which is also very accurate indeed. The drawback is the signal frequency must be much lower than the clock frequency for proper operation.
4 o V i V 1 2 1 2 1 C 2 C
Figure 4 Example of switched-capacitor filters 1.2 Thesis organization
The thesis is organized with six sections. Section 1 briefly introduces the background of analog filter.
In section 2, the idea of the proposed novel filter is proposed. Some system level design considerations such as effect of real amplifier, stability, noise and distortion are explained.
In section 3, the transistor level design details of main building blocks are presented. Related design issues are also discussed.
In section 4, the chip layout, test setup and simulation results are presented. In section 5, the analysis and simulation results of Tow-Thmoas Biquad are presented. And a fair comparison is made between the Tow-Thmoas Biquad and this novel filter.
5
2. DESIGN OF THE NOVEL FILTER
2.1 The idea
Figure 5 Proposed filter idea in receiver frontend
Part of a typical Direct-Conversion Receiver is shown in Figure 5. The Intimidate-Frequency (IF) current is converted into voltage by the Trans-Impedance Amplifier (TIA) and then is amplified by a Programmable Gain Amplifier (PGA) for the baseband ADC. The purpose of this research is to find a low cost solution for filtering in the receiver frontend. And we want to synthesize a block connected to the middle point of the input resistor, which is intentionally divided into two pieces in the PGA. The target block should have very large impedance at low frequency and starts to decrease in a second order roll-off after the cutoff frequency. Since the amplifier in the PGA
provides a virtual ground at the negative input terminal. The part of target block is redrawn in the Figure 6.
Mixer
TIA PGA
Z
6 1 / g R 1 / g R o V i V 1 / Z Y
Figure 6 Concept of proposed filter
The transfer function of this part is Vo/Vi which can be easily obtained by using the admittance of components as the following.
o i
V g
V 2gY (2.1)
Since the DC gain of this network is one half and our target is to achieve a second order low pass transfer function, the target transfer function can be written as
2 o 0 2 0 2 i 0 V 1 V 2 s s Q (2.2)
After combining equation (2.1) and equation (2.2), we obtain
2 2 0 0 2g 2g Y s s Q Q (2.3)
Now the question is how to synthesize a network that has the admittance in equation (2.3). Obviously, this admittance Y can be seen as a capacitor in parallel with a ‘super’ capacitor [3], which can be realized by a General Impedance Converter (GIC) shown in Figure 7.
7 1 Z Z2 3 Z Z4 Z5 Z
Figure 7 Schematic of GIC The input impedance of GIC is given by
1 3 5 2 4 Z Z Z Z Z Z (2.4)
Evidently we can set the Z1 and Z5 as capacitors and let the other impedance as resistors as shown in Figure 8.
Figure 8 Impedance choice in GIC
Z 1 C 5 C 2 R 3 R R4
8 In this case, the input impedance will be given by
3 2 1 5 2 4 R Z s C C R R (2.5)
And that helps to synthesize the ‘super’ capacitor which is the second order term in equation (2.3). And the target admittance can be realized by adding a normal capacitor in parallel with it. However, neither the input of amplifier is connected to ground, which means all the inputs of amplifiers have the same signal swing as the input of the network. If the signal swing is large, the Op-amps have to accommodate large common mode input range, which complicates the design. Besides, there are two amplifiers in the network and five passive components, which is not a simple solution.
K
Z
0
Z
Figure 9 Concept of impedance scaler
In order to find a low-cost solution, the property of impedance scaler was examined. As shown in Figure 9, the input impedance of the impedance scaler is
0 Z Z 1 K (2.6)
It has the potential to get a second order denominator if K is implemented by an inverting amplifier, shown in Figure 10.
9 Z Z 2 C 1 C 1 R 0 Z 1 Z 2 Z
Figure 10 Implementation of impedance scaler Now the input impedance is
0 1 2 1 Z Z || Z Z 1 Z (2.7)
By setting Z0and Z1as capacitor, Z2 as resistor, we have the input impedance
2 1 2 1 2 1 1 Z s(C C ) s C C R (2.8)
Thus the input admittance is
2 1 2 1 2 1 1 Y s(C C ) s C C R Z (2.9)
The equation (2.9) has exactly the same form as equation (2.3). Thus, it turns out to be a simple and efficient solution because it has only one amplifier and three passive
components. Besides, the negative input terminal of the amplifier is a virtual ground and there is little signal swing. Thus this approach does not have the stringent common mode input range requirement for the amplifier.
10 2.2 Filter topology 1 R C2 1 C 3 C o V R R i V
Figure 11 Filter topology
The filter topology is shown in Figure 11 and we note that there is an additional capacitor C3 is added in parallel with the load resistor. At high frequency, the loop gain
of the filter is not high enough to support normal operation of the synthesized impedance. And the capacitor C3 will continue the job of synthesized impedance to provide high frequency filtering. The filter transfer function in Figure 11 is given by
o 1 2 1 2 1 2 3 i 3 1 2 1 1 2 1 1 2 V 1/ R 2 C C R R C C C 2 V 2 / R sC Y s s C C R C C R R (2.10) Where Ys(C1C ) s C C R2 2 1 2 1
11 2 0 2 0 2 0 1 H(s) 2 s s Q (2.11)
Then the Q and ω0 are obtained as follow:
0 1 2 1 2 C C R R (2.12) 1 2 1 1 2 3 2C C R 1 Q C C C R (2.13)
From equation (2.13), the Q has different form and unique parameter C3 compared with
ω0. Hence, the Q of the filter can be tuned by changing C3 when ω0 is fixed.
The DC gain is one half due to the resistive divider and thus half of input signal is wasted on the resistor in series with the voltage source. However, it will be more efficient to realize the filter driven by a current source. As shown in Figure 12, all the input current signal is injected to the load without wasting the input signal. In another words, the gain is not limited by one half if the filter is driven by a current source. In this design, we maintain an equivalence of the two cases for testing. According to Thevenin-Norton Equivalencies, the following relationships guarantee the same transfer function of two cases. i i V I R (2.14) 2 R R / 2 (2.15)
12 1 R 2 R 2 C 1 C 3 C i I
Figure 12 Filter driven by current source 2.3 General design considerations
2.3.1 Components value
The proposed filter is designed for a digital TV application and the target filter specs are given in Table 1.
Table 1 Target spec of proposed filter
Specs Value
Cutoff frequency 10MHz
Q 0.5~1
Order 2
DC Gain 0.5
13 For a second order system,
2 0 2 0 2 0 H(s) s s Q (2.16)
the magnitude at natural frequency ω0 is given by
0 2 0 2 0 2 0 0 0 H( j ) Q j Q (2.17)
So Q is the magnitude of the transfer function at ω0 shown in Figure 13.
Figure 13 Frequency response of second order system with different Q
10-3 10-2 10-1 100 101 102 -100 -80 -60 -40 -20 0 20 40 Frequency Normalized to ω0 M a g n it u d e ( d B ) Q=0.5 Q=1 Q=2 Q=10
14
The cutoff frequency is defined as the maximum frequency where the DC gain does not attenuate. For Q equal to unity, the natural frequency ω0 is just the cutoff
frequency according to the above definition.
According to equation (2.12) and (2.13), the component values have the following relationship assuming Q is unity.
1 2 1 2 0 2 C C R R (2.18) 1 2 3 0 2 C C C R (2.19)
The value of resistor R is critical. Large value of R can relax the specs of OTA but introduce more noise to the output node. Limited by the noise requirement, R is set to 2kΩ in this design. So the R2 in Figure 12 is 1kΩ according to equation (2.15). Since
ω0 is equal to the cutoff frequency 2π×10M rad/s, the sum of C1, C2 and C3 can be calculated as 16pF. The value of C1and C2 are both chosen as 2pF as an initial point. And thus C3 and R1 can be obtained as 12pF and 64kΩ respectively.
Table 2 Final choice of component value
Component Value
C1,C2 2pF
C3 8pF
R1 18kΩ
15
However, the total capacitance of 16pF is still quite large so that the OTA has to consume large power to provide enough AC current. In order to relax the power
consumption requirement of OTA, the values of components are modified according to simulation. And the values are given in the Table 2.
The R1and C3 are reduced so does the quality factor Q which is reduced to about 0.7 in this design. Hence, the natural frequency ω0 increases beyond 10MHz to meet the cutoff frequency definition.
2.3.2 Effect of real OTA and Op-amp
Operational Transconductance Amplifier (OTA) is a basic cell in analog circuits. The difference between the OTA and Operational Amplifier (Op-amp) is illustrated in Figure 14. in V Vin o V o V in V Vin OTA Op-amp
Figure 14 Example of OTA and Op-amp
Compared with OTA, the Op-amp circuit has an additional source follower stage as an output buffer. It can be seen that the Op-amp includes an OTA as well as an output buffer, so the OTA is only one part of the Op-amp. The output buffer provides a low
16
output impedance and makes Op-amp able to drive low impedance load. However, the output buffer usually consumes a great amount of power and complicates the circuit design. In the on-chip environment, the loads of the amplifier are usually capacitors or high-value resistance rather than low impedance. Hence, the OTA is typically an efficient solution and the OTA is used in the implementation of the filter. The ideal models of the OTA and Op-amp are also different and are shown in Figure 15. The OTA can be modeled as a voltage controlled current source with a transconductane Gm, while
the Op-amp is a voltage-controlled voltage source with a voltage gain of A.
in
V AVin
in
V G Vm in
OTA Op-amp
Figure 15 Ideal small signal model of OTA and Op-amp
i V 2 C 1 C 1 R x V i I x AV
17
The derivation of the driving point impedance in section 2.1 is based on ideal Op-amp. As shown in Figure 16, we first consider the Op-amp has a finite gain and use the model of Op-amp in Figure 15 to derive the input impedance. The node equation at the negative terminal of the Op-amp can be written as
x x i x 1 1 V AV (V V ) sC R (2.20)
And the input current is given by
i i x 2 i x 1
I (VA V ) sC (VV ) sC (2.21) By solving equation (2.20) and (2.21), the input impedance can be obtained as
1 1 i in 2 i 1 2 1 2 1 sC R 1 V 1 A Z I s(C C ) s C C R (2.22)
From equation (2.22), the finite gain of Op-amp introduces a zero at (1 A) / C R1 1 to
the input impedance. As long as the gain of the Op-amp is high enough, the zero should be at high frequency and have negligible effect to the overall transfer function of the filter. i V 2 C 1 C 1 R x V m x G V o V i I
18
Now we replace the Op-amp with an OTA model and derive the input impedance again as shown in Figure 17. The node equations can be written as
i i o 2 i x 1 m x I (VV ) sC (VV ) sC G V (2.23) x o i x 1 1 V V (V V ) sC R (2.24)
By solving the equation (2.22) and (2.23), the input impedance can be obtained as
2 1 2 1 1 2 i m m in 2 i 1 2 1 2 1 s C C R s(C C ) 1 V G G Z I s(C C ) s C C R (2.25)
The equation (2.24) will be reduced to the same form as equation (2.8), if Gm is infinity.
However, the OTA always has a finite transconductance Gm so that the input impedance will have a complex conjugate zero which directly appears in the closed-loop transfer function of the filter.
Figure 18 Input impedance by using different amplifier model
104 105 106 107 108 109 1010 -50 0 50 100 150 Frequency (Hz) M a g n it u d e ( d B ) Ideal Op-amp OTA
19
Figure 19 Filter response by using different amplifier model And the simulated input impedance of using different macro-models of
amplifiers are shown in Figure 18. Op-amp gain A is chosen as 100 and Gm of OTA is set as 30mS in the simulation. The corresponding filter transfer function is shown in Figure 19.
Compared with equation (2.22), the finite Gm of OTA introduces higher order of
zero than the Op-amp, which is a penalty of removing the output stage to save power. But the complex conjugate zero helps to get a steeper roll-off compared with using Op-amp. Generally, the OTA should have a large overall Gm as well as a high bandwidth to provide enough stopband attenuation.
From the numerator in equation (2.25), the Q and ω0 of the second order zero can be obtained similarly as the following.
104 105 106 107 108 109 1010 -80 -70 -60 -50 -40 -30 -20 -10 0 Frequency (Hz) M a g n it u d e ( d B ) Ideal Op-amp OTA
20 m 0 1 2 1 G C C R (2.26) m 1 2 1 1 2 G C C R Q C C (2.27)
Since the Q of zero is typically larger than 1 which means a complex conjugate zero, the filter response will have a big notch and the roll-off is actually large than 40dB/dec. In general, assuming the filter roll-off is 50dB/dec, in order to get at least K dB attenuation the ω0 of zero and the ω0 of pole should have the following relationship.
0 _ zero 0 _ pole
50 log K
(2.28)
Figure 20 Filter response by using different Gm of OTA
By substituting equation (2.26) and (2.12) into ω0_zero and ω0_pole respectively, we have
104 105 106 107 108 109 1010 -80 -70 -60 -50 -40 -30 -20 -10 0 Frequency (Hz) M a g n it u d e ( d B ) Gm=10mS Gm=40mS Gm=70mS Gm=100mS
21 K 25 m 2 G 10 R (2.29)
Given that the R is chosen as 2kΩ and K is 40dB in this design, the required Gm is about
40mS. By changing the Gm only, the filter response is shown in Figure 20.
We can see that increasing Gm too much the attenuation is improved slowly because increasing Gm will also increase the Q of the complex conjugate zero at the same time. So in this design, the optimum Gm is from 30mS to 40mS to get a 40dB
attenuation and that Gmis hard to achieve in a single-stage OTA with reasonable power
consumption. Considering three-stage OTA has more poles and zeros, which
complicates the design, typical class-A two-stage OTA is chosen first for the following analysis.
Figure 21 Filter response with different OTA bandwidth
104 105 106 107 108 109 1010 -80 -70 -60 -50 -40 -30 -20 -10 0 Frequency (Hz) M a g n it u d e ( d B ) w3dB=10wp w3dB=30wp w3dB=50wp w3dB=infinity
22
Regarding the bandwidth of the OTA, we assume the Gm has a finite 3dB bandwidth ωbw. Intuitively, ωbw should be larger than the high frequency pole ωp
introduced by additional capacitor C3 in Figure11. Without considering synthesized impedance, this pole is at 2/(RC3). The simulation with different bandwidth of Gm is
shown in Figure 21.
It seems that the 3dB bandwidth of Gm should be above 30 times the ωp to reduce the high frequency peaking. And that demands a 600MHz 3dB bandwidth for the OTA in this design. OTA with 600MHz 3dB bandwidth seems hard to realize if considering the stability. But section 2.3.6 and 3.1 show that the OTA is possible to realize in this design. The above analysis is pessimistic in reality. The OTA usually has more than one pole and other circuitries in the receiver also has additional high frequency pole, heling reducing such peaking.
2.3.3 Loop stability 1 R 2 R 2 C 1 C 3 C in V out V
23
For any feedback system, the stability is always an issue. In order to make a stable loop, the location of poles and zeros of open-loop transfer function or loop gain should be clearly analyzed. Typically, the open-loop transfer function is found by breaking at the input terminal of the amplifier shown in Figure 22 and defined as Vout/Vin. Note that the input current source is set to zero by being seen as open circuit.
From the analysis of section 2.2.2, a two-stage OTA should be used and thus the corresponding macro-model is used in the open-loop circuit shown in Figure 23.
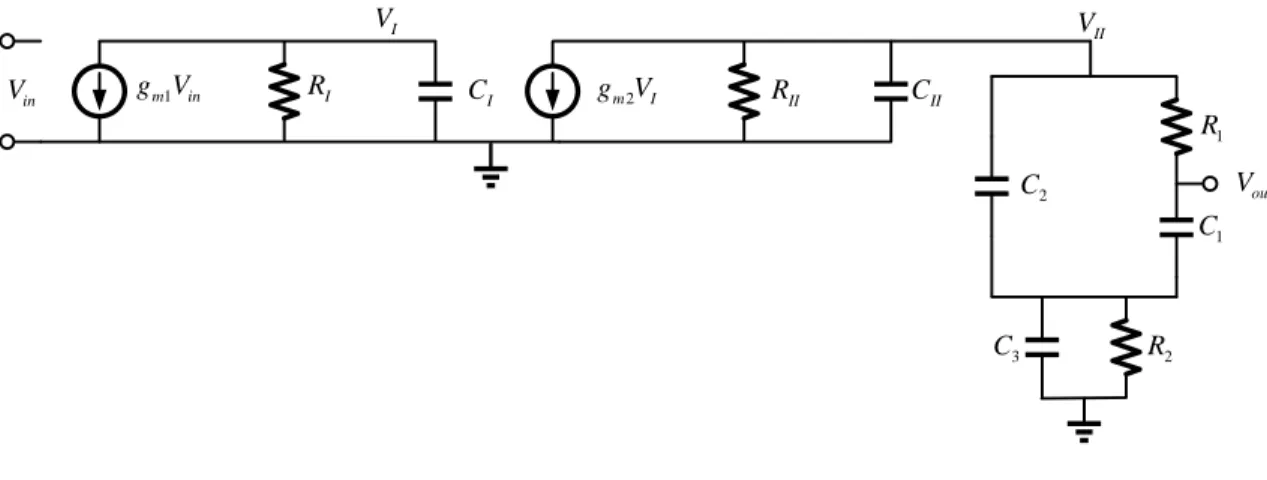
in V gm1Vin RI I V I C gm2VI RII CII II V out V 1 R 2 R 1 C 2 C 3 C
Figure 23 Open-loop circuits with macro-model of two-stage OTA The open-loop transfer function can be divided into two parts as follow.
out out II
in II in
V V V
V V V (2.30)
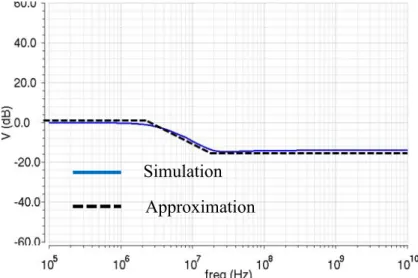
And the decomposition of the Vout/Vin from simulation is illustrated in Figure 24. And each part will be discussed separately.
24
Figure 24 Decomposition of filter loop gain in simulation
1
C
2C
2R
1R
IIV
V
out 3C
Figure 25 Circuit of first part
The circuit of the first part is illustrated in Figure 25. And the transfer function of Vout/VII can be obtained below by writing node equations.
2 out 1 2 1 2 1 2 3 2 2 II 1 2 3 1 2 1 1 1 2 3 2 V s C C R R s(C C C ) R 1 V s C (C C )R R s[C R (C C C ) R ] 1 (2.31) out out II in II in V V V V V V out II V V II in V V
25
If we assume the two poles are far away from each other [4], we can get
p1 1 1 1 2 3 2 1 C R (C C C ) R (2.32) 1 1 1 2 3 2 p2 1 2 3 1 2 C R (C C C ) R C (C C )R R (2.33)
Since the two zeros are very close to the second pole, the magnitude drops a little after the first pole and then is flatten out around the second pole. The approximation of the first part is shown in Figure 26.
Figure 26 Approximation of first part
The second part in Figure 23 is simply the OTA driving a large load. In order to obtain the second part, the input impedance of the load needs to be analyzed first shown in in Figure 27.
Simulation Approximation
26 out V 1 R 2 R 1 C 2 C 3 C in Z
Figure 27 Load driven by OTA
Figure 28 Simulation of input impedance of the load
At low frequency, R1is very small compared with C2and so do R2 and C3, which means the input impedance can be seen as C1 in parallel with C2 and then in series with R2. Since the impedance of C1 and C2 are much larger than R2 at low frequency, the
27
impedance of all the capacitors are much smaller than resistors. Thus, the input impedance is simply C2 in series with C3. As expected, the simulator shows the input impedance of the network in Figure 28. Since frequency beyond 10MHz is of more interest to find the phase margin in the open-loop analysis, this input impedance is
simplified as Ceq=C1C2/(C1+C2) to obtain the second part VII/Vin illustrated in Figure 29.
in V gm1Vin RI I V I C gm2VI RII II V eq
C
Figure 29 Open-loop circuits of the second part with equivalent capacitor The parasitic capacitance CII is much smaller than Ceq and thus neglected here.
Now the transfer function of second part is obviously given by
II m1 m 2 I II in p3 p 4 V g g R R V (s )(s ) (2.34) Where p3 2 3 II 2 3 1 C C R C C (2.35) p4 I I 1 C R (2.36)
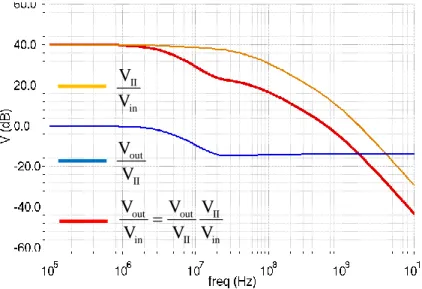
The comparison between the above approximation of VII/Vin and its simulation is
28
first pole due to the approximation of Ceq, the approximation yields a simple
mathematical equation for analysis.
Figure 30 Approximation of second part
After obtaining the two parts, the open-loop transfer function can be found as the following. 2 out m1 m2 I II 1 2 1 2 1 2 3 2 in p1 p2 p3 p4 V g g R R [s C C R R s(C C C ) R 1] V (s )(s )(s )(s ) (2.37)
Where the ωp1,ωp2,ωp3 and ωp4 are given by equation (2.32), (2.33), (2.35) and (2.36)
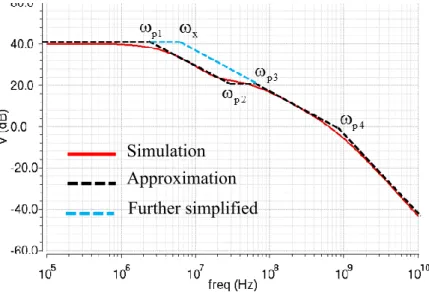
respectively. However, it is still not easy to get the phase margin from equation (2.37). Thus, the open-loop transfer function can be further simplified as a two-pole system shown in Figure31.
Simulation Approximation
29
Figure 31 Further simplified approximation of loop gain
Assuming the open-loop transfer function has a dominant pole at ωx. We notice that the region between ωx and ωp3 and the region between ωp1 and ωp2 are both -20dB/dec and
thus we have p 2 p3 p1 x (2.38)
By using equation (2.27), (2.28) and (2.30), ωx is given by
2 p1 p3 1 2 1 2 3 x 2 p2 1 3 II 1 1 1 2 3 2 R R C (C C ) C C R [C R (C C C )R ] (2.39)
For a two-pole system, the second pole must be set beyond the unity gain frequency to ensure stability, so the unity gain frequency is equal to the gain bandwidth product (GBW) which is given by
2 m1 m2 1 2 I 1 2 3 u m1 m2 I II x 2 2 3 1 1 1 2 3 2 g g R R R C (C C ) g g R R C C [C R (C C C )R ] (2.40) Simulation Approximation Further simplified
30
The phase margin of a two-pole system is equal to the following
1 u
p 4
PM90tan
(2.41)
Therefore, the stability of the loop gain is mainly depends on the ωp4, which
should be put around 2ωu for a phase margin of 60 degree. Interestingly, ωp4 is the pole at the output of the OTA’s first stage so that typical Miller compensation would degrade the phase margin. The above analysis indicates that the two-stage OTA should be implemented without Miller compensation and try to make the parasitic capacitance as small as possible at the output of the first stage. Without Miller compensation the 3dB bandwidth of the OTA will be improved remarkably so as to meet the bandwidth requirement in section 2.3.2.
2.3.4 Noise analysis
One of the big advantages of this filter is it introduces little in-band noise to the output. As illustrated in Figure 32, the capacitor C1and C2has very high impedance at
low frequency so that the noise of the OTA and resistor R1is blocked by these two capacitors. The only dominant noise source is R2, which can be controlled by limiting its value. Since the OTA noise is a great concern for many circuits and low noise usually requires high power consumption, the nice property of this filter alleviate the trade-off between noise and power to yield a low-noise power efficient filter.
31 1 R 2 R 2 C 1 C 3 C o V i I ,OTA n V 1 , n R V 2 , n R V
Figure 32 Noise sources in the proposed filter
1 R 2 R 2 C 1 C 3 C o V 2 , n R V ,OTA n V x V 1 , n R V
Figure 33 Circuits for noise analysis
To perform noise analysis, the input current source is set to zero by seeing it as an open circuit and then Figure 12 is redrawn in Figure 33. Assume the noise voltage
32
sources have the polarities in Figure 33, the node equations on the two terminals of C1can be written as the following.
2 o n,R o 3 o n,OTA 1 o x 2 2 V V V sC (V V ) sC (V V ) sC 0 R (2.42) 1 x n,R n,OTA o n,OTA 1 1 V V V (V V ) sC 0 R (2.43)
By solving equation (2.42) and (2.43), the output noise voltage due to the three noise sources is obtained as 2 1 o 1 n,R 2 n,OTA 3 n,R V H (s) V H (s) V H (s) V (2.44) Where 1 2 1 2 1 2 1 2 3 2 1 H (s) s C C R R s(C C C ) R 1 (2.45) 2 1 2 1 2 1 2 2 2 2 1 2 1 2 1 2 3 2 s C C R R s(C C ) R H (s) s C C R R s(C C C ) R 1 (2.46) 2 2 3 2 1 2 1 2 1 2 3 2 sC R H (s) s C C R R s(C C C ) R 1 (2.47)
It can be seen that the contributions of three noise voltage sources to the output are shaped by the transfer function H1(s), H2(s) and H3(s) respectively. Using the components value given in Table 2, their frequency responses are plotted in Figure 34. H1(s) is a second order low pass response. At low frequency, the gain of H1(s) is about unity so that the noise from R2 is directly showing up at the output, which is intuitively true. Besides of two poles, H2(s) has one zero at origin and another zero at
33
H2(s) has a gain less than unity until the cutoff frequency of the filter, meaning the noise
of the OTA is filtered out for the in-band signal. Similarly, H3(s) is a band-pass response
compared with the high-pass H2(s). Hence, the noise of resistor R1 is also filtered out for
the in-band signal. The above mathematical derivation validates our intuitive explanation that the capacitors C1 and C2 block the noise of the OTA and R1 at low frequency. The derivation even specifies the so called low frequency which in fact ranges from DC to the cutoff frequency of the filter.
Figure 34 Plots of noise transfer functions
103 104 105 106 107 108 109 1010 -100 -80 -60 -40 -20 0 Frequency (Hz) M a g n it u d e ( d B ) H1(s) H2(s) H3(s)
34 2.3.5 Distortion analysis 1 Z 2 Z + -1, 2, 3 A A A i V Vo i V o V (a) (b)
Figure 35 (a) Inverting amplifier (b) Model of non-linearity
Since the passive components are very linear, the distortion is mainly from the amplifier. For inverting amplifier, the gain can be modeled in Figure 35 (b). The gain of OTA is 𝐴1 and the second and third order coefficients are 𝐴2 and 𝐴3 respectively. The feedback factors are given by
2 1 2 Z Z Z (2.48) 1 1 2 Z Z Z (2.49)
From Figure 35 (b), the output can be easily obtained by
2 3
o 1 i o 2 i o 3 i o
V A ( V V ) A ( V V ) A ( V V ) (2.50)
And the non-linear relationship between the Vo and Vi is modeled by a new set of
coefficients B1, B2 and B3 as given by the following.
2 3
o 1 i 2 i 3 i
V B V B V B V (2.51)
35 1 1 1 A B 1 A (2.52) 2 2 2 3 1 A B (1 A ) (2.53) 2 3 3 3 2 1 3 3 2 5 4 1 1 2 A (1 A ) A A B (1 A ) (1 A ) (2.54)
Then this non-linear model of inverting amplifier is substituted in the filter shown in Figure 36. And node equation at the output can be written as
2 3 i o 3 1 o 1 o 2 o 3 o 2 2 1 I V ( sC sC ) [V (B V B V B V )]sC R (2.55)
Also the non-linear relationship between the Vo and Ii is modeled by the following
2 3
o 1 i 2 i 3 i
V Z I Z I Z I (2.56)
Where Z1, Z2 and Z3 are the total impedance, second order coefficient and third order coefficient of impedance respectively.
1 R 2 R 2 C 1 C 3 C o V i I 1, 2, 3 B B B 2 3 1 o 2 o 3 o B V B V B V
36
Similarly, by substituting equation (2.56) into equation (2.55) and ignoring the higher order terms, we obtain the following.
2 1 1 3 2 2 2 1 R Z 1 s(C C ) R sC R (1 B ) (2.57) 3 2 2 2 2 3 1 3 2 2 2 1 sC R B Z [1 s(C C ) R sC R (1 B )] (2.58) 4 2 2 3 3 4 1 3 2 2 2 1 sC R B Z [1 s(C C ) R sC R (1 B )] (2.59)
By using the equation (2.14) and (2.15), equation (2.56) can be rewritten as the voltage source equivalent form
2 3
o 1 i 2 i 3 i
V H V H V H V (2.60)
And the coefficient H1, H2 and H3 can be found easily from Z1, Z2 and Z3 respectively
by the following 1 1 2 2 1 2 3 2 1 2 1 2 Z 1 / 2 H 2R 1 s(C C C ) R s C C R R (2.61) 2 2 2 2 2 2 2 3 2 1 2 3 2 1 2 1 2 Z sC R B H 2R 4[1 s(C C C ) R s C C R R ] (2.62) 3 2 2 3 3 3 2 4 2 1 2 3 2 1 2 1 2 Z sC R B H 8R 8[1 s(C C C ) R s C C R R ] (2.63)
The IM3 of the filter is given by
2 3 3 i 1 H 3 IM V 4 H (2.64)
37
Where H1 is transfer function of the filter because it is exactly the same as equation
(2.10). By substituting equation (2.61) and (2.63) into equation (2.64), the IM3is reduced
to 3 3 2 2 2 3 1 3 4 i 1 12sC R A H IM V (1 A ) (2.65)
Since the passive components are determined by filter transfer function, the IM3 is mainly depends on the OTA gain A1 and third order distortion coefficient A3. Hence, increasing the gain of OTA and using large Vdsat for the input transistor of the second stage to reduce the distortion coefficient A3 are the two effective ways to improve the
38
3. CIRCUITS IMPLEMENTATION
In section 2, some system level design considerations are presented. In this section, the circuit level design details are explained.
In1+
In1-Out1+
Out1-Figure 37 Top level on-chip schematic
Figure 37 illustrates the top level building blocks on-chip and all the circuits are fully differential. The first block is a voltage-to-current converter which pumps ac current to the filter because the filter is designed driven by a current source. Then followed by the proposed low-pass filter. The output node of the filter is very sensitive
39
because any large load such as pad frame, pin or probe of oscillators would affect the filter transfer function. Therefore, an output buffer is needed to drive the large loads mentioned above for measurement. The design detail of each building blocks are discussed in the rest of this section.
3.1 Class-AB OTA
The OTA for the filter is the most critical block. According to the conclusions drawn in section 2, the total transconductance should be large to provide enough
attenuation of the filter transfer function. Also, the parasitic capacitance at the output of the first stage should be minimized for stability so that most of the transistors are designed with minimum channel length and no Miller compensation is used. Figure 38 shows the schematic of the proposed class-AB OTA and the dimensions and values of devices are listed in table 3. The input transistors M1 are designed with low value of Vdsat(96mV) to increase the gain of the first stage and better matching. For the transistor
M3 and M4 in the second stage, they are designed with relatively high Vdsat (120mV) for better linearity as well as a good current efficiency. Since M2 and M3 are 1-to-1 ratio current mirror, the total current in the second stage is about the same as the first stage whose current is 500uA. So the total current of the OTA is 1.1mA including the current of the error amplifier. With the power supply of 1.2V, the total power consumption is only 1.3mW.
40 M1 M2 M2 M3 M4 M1 M3 M4 M5 M5 M6 M6 cmfb V Vcmfb 2 R 2 R 1 C C1 1 R R1 2 C 2 C cmfb V ref V 3 R 3 R i V Vi o V o V o V o V 1 tail I 2 tail I
Figure 38 Class-AB OTA schematic
Table 3 Details of components for OTA in Figure 38
Device Dimensions/Value Device Dimensions/Value
M1 (24) 4.2um/120nm M4 (10) 2.2um/120nm M2 (8) 1um/120nm M5 (2) 2.2um/120nm M3 (8) 1um/120nm M6 (6) 1um/120nm Itail1 500uA R2 100kΩ Itail2 100uA R3 ||C2 32kΩ || 60fF R1 32kΩ C1 1.5pF
41 3.1.1 Input stage
The input stage is PMOS differential pair with local common-mode feedback. Compared with NMOS differential pair, the PMOS one has some advantages. First is the lower flicker noise. There are two main theories that have been developing in the past regarding the flicker noise. The one is called the number fluctuation theory stating that there are some traps in the SiO2 – Si interface, randomly trapping and releasing charge
carriers of the channel and thus fluctuating their number. The other one attributes the flicker noise to the random mobility fluctuations caused by lattice scattering. Today, these two theories combines together by correlating the traps’ capture and release of carriers to the mobility fluctuation due to Coulomb scattering [5]. The unified theory gives the input referred noise density of
n 2 ox K 1 V (f) C WL f (3.1)
Where K is not only a process-dependent constant, but also bias point dependent. The typical K for PMOS is around 10-32 C2/cm2 and 4*10-31 C2/cm2 for NMOS. The lower K factor of PMOS is because oftentimes the NMOS channel is right under the SiO2 – Si interface, while the PMOS channel is farther below the surface, less affected
by the traps. In addition, PMOS transistors have smaller larger area for a given gm and current because of the lower channel mobility. From equation (3.1), it is obvious that the larger the device area, the smaller the flicker noise.
Second, it helps to achieve a better matching and Common-mode rejection. In the process of fabrication, there are always variations among transistors that you want to be
42
the same. One of the sources is dopant fluctuation, which means the number of dopant ions implanted inside each channel of devices is different. This phenomenon is pretty substantial for modern sub-micron technology. Another one is called line-edge
roughness, meaning that we cannot get a perfect straight line for the edges of device but a rough line. Because these sources of variation are random, we can see from a statistic viewpoint the mismatch as a Gaussian distribution with zero mean. Threshold voltage mismatch is one of the major concern, which can be mathematically described by the following equation [4]. VTH TH A V WL (3.2)
Where AVTH is proportionality factor.
So the mismatch is inversely proportional to the square root of the transistor area. For example, 1.8nm variation of channel length is 1% of the 180nm device, while it could be 10% of the 18nm device. Thus the size of the device provides a sort of averaging for the process variation and thus yield better matching. For providing the same transconductance, PMOS transistors have bigger size than the NMOS and thus better matching.
Another benefit of PMOS is that the bulk terminal can be connected to the source terminal in N-well process. Recall that the threshold voltage is given by
TH TH0 SB F F
V V ( V 2 2 ) (3.3) VSB is not zero in the NMOS differential pair. There is also probably certain mismatch
43
mismatch of threshold voltage. Conversely, by shorting the bulk and source, VSB in the PMOS differential pair is equal to zero, eliminating the body effect. So the VTH
mismatch in PMOS differential pair is better than NMOS.
m g gm gm b V cm V out V
Figure 39 Input differential pair with mismatch
If a differential pair is perfectly symmetrical, the common mode input voltage will create the same output voltage at two branches and the differential output is zero. However, as shown in Figure 39, if the input transistors experience mismatch in gm, the output voltages at two branches are different, creating a certain differential output voltage. Thus, mismatch results in common- mode to differential-mode conversion. The definition of common-mode rejection ratio (CMRR) is given by [4]
DM CM DM A CMRR A (3.4)
44
So we can say that the PMOS differential pair has larger CMRR than NMOS because it has better matching and thus less common- mode to differential-mode conversion
Last but not least, since the common-mode voltage at the output of the PMOS differential pair is usually lower than half of Vdd (PMOS tail current source eats some
voltage headroom), the input device of the second stage should be NMOS to achieve a reasonable overdrive voltage. Thus, there is smaller parasitic capacitance at the first stage’s outputs, which is critical for the stability of the filter.
3.1.2 Class-AB operation
The output of the first stage is also ac-coupled to the PMOS transistors of the second stage. The resistor R2 and capacitor C1 forms a high pass filter with corner frequency of 1/R2C1. Below this frequency, the signal is attenuated by the high pass RC filter and thus the OTA just behaves like a class-A stage. Above the corner frequency, the path is active and PMOS transistors amplify the signal, meaning that the gm of the PMOS transistors is directly added to the total gm of the second stage. Compared with class-A OTA where the PMOS transistors in the second stage are only serve as current source, this class-AB operation reuses the wasted current on that PMOS loads for processing signal.
3.1.3 Common mode feedback
In fully differential circuits, the common-mode feedback (CMFB) is needed to define the common-mode level. There are unavoidable mismatches between the PMOS and NMOS current sources which are independently biased in fully differential circuits. As shown in Figure 40, the difference of the NMOS and PMOS current source flows
45
into the output resistor of the amplifier, creating the an voltage change of (IP-IN)(RP||RN). Because RP||RN is usually quite large, the error voltage may be substantial, deviating the
CM level from desired value a lot. In the worst case, the transistors may go to the triode region and the circuit would not work properly.
P N I I P R N R N I P I
Figure 40 Simplified model of amplifier
The CMFB is a negative feedback loop whose block diagram is illustrated in Figure 41. The loop senses the output CM level first and then compared with a reference voltage. The difference between the two is then amplified by an error amplifier, whose output is connected to one of the independent current source. The negative feedback will force the sensed CM level to be equal to the reference voltage by adjusting the tail current source in this example.
46
CM Sense
ref
V
Figure 41 Block diagram of CMFB
Typically for two stage OTA, the common-mode voltage of both stages should be stabilized. One way of doing this is to feed the common mode control signal to the first stage, then the common mode voltage of the second stage is automatically controlled. However, there are three stages in the CMFB loop including the error
amplifier, which complicates the compensation and limits the loop bandwidth. The other way is to apply the common mode feedback loop to the second stage only while using a local common mode feedback in the first stage. The proposed class-AB OTA utilizes the CMFB approach in Figure 38. The local common-mode feedback in the first stage is realized by two resistor R1 which forms a mode detector to sense the common-mode voltage at the drain of M2 and then feed to its gate. Since the differential signal is cancelled out at the gate of M2, this point is an AC ground. And thus the differential gain of the first stage is
47
v1 m1 P N 1
A g (R || R || R ) (3.5) As long as the R1 is much greater than the intrinsic output impedance of the amplifier, it will not degrade the gain of the first stage. Since the current in the first stage is relatively high and the RP and RN are around 5kΩ, the R1 is chosen as 32kΩ. So the
first stage is self-biasing due to the local common-mode feedback and the second stage is applied with an external CMFB circuit. This approach makes the CMFB loop easy to compensate and the detailed reason will be discussed in section 3.3.
The CMFB is usually verified in two ways. One way is to simulate frequency response of the CMFB loop to see the loop gain, bandwidth and phase margin. The other way is transient response as illustrated in Figure 42. The amplifier is kept in a closed-loop form and the input is connected to the same common-mode level, which means the differential input signal is muted. Then a pair of identical current pulse is connected to the output. And the peak value of the current pulse is set as 10% of the DC current of the output stage. The CMFB will adjust the bias and identical step response will appear at both output nodes.
R R R R pulse I pulse I out V
48
Figure 43 AC response of CMFB for class-AB OTA
The frequency response of the CMFB in the class-AB OTA at nominal point is shown in Figure 43. In order to improve the loop gain, the error amplifier in Figure 38 is using a single-ended OTA instead of OTA with diode connected load. The loop gain is around 40dB with a unity gain frequency of 82MHz. The phase margin is 52 degree in this case and it is greater than 45 degree for all the different corners and temperature.
Figure 44 Transient response of CMFB for class-AB OTA Gain
49
Figure 44 shows the transient response of the common mode feedback loop. The CMFB settles the final output voltage with an offset about 1mV.
3.1.4 Performance summary
The AC response of the class-AB OTA without loading is shown in Figure 45. The gain of OTA at DC is 36dB and begins to increase around 300kHz due to the class-AB operation. The gain achieves the peak value of 41dB at 10MHz. Since the open-loop transfer function of filter determines the stability, the phase margin of the OTA alone is meaningless.
Figure 45 AC response of the class-AB OTA without loading
Figure 46 shows the spectrum and transient at the class-AB OTA differential output, when the full-scale input of the filter is used for two-tone test.
Gain Phase
50
Figure 46 Differential output spectrum and transient of class-AB OTA And the performance is summarized in Table 4. The in-band integrated noise is relatively large in the OTA because of the considerable flicker noise caused by using minimum channel length in the transistors. From the analysis in section 2.3.5, the noise of OTA has little effect on the output noise of the filter and thus it is more important to guarantee the stability by using small transistors.
Table 4 Class-AB OTA performance summary
Performance parameter Value
DC gain 36dB
Peak gain 41dB
Unity gain frequency 5.2GHz
Input referred integrated noise (1Hz- 10 MHz) 80uV
IM3 (1.46Vppd) -71.8dBc
51 3.2 Voltage-to-current converter
Since the filter is designed driven by a current source, an on-chip voltage-to-current converter is needed to perform this task and also serves as a good interface with external test circuits. The main design challenge is the linearity because the filter has an in-band IM3 above 70dBc. Thus, the voltage-to-current converter (V-I converter) must
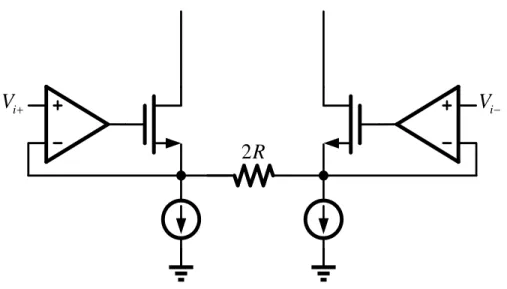
be very linear without limiting the linearity performance of the filter. For such a high linearity requirement, the negative feedback is necessary to be used and a common solution is illustrated in Figure 47. The input voltage is copied at the negative terminal of the amplifier and then converted to linear current by the resistor R. Nevertheless, the difference between the input and output of the amplifier has to be the VGS of the NMOS transistor, which is difficult to realize in 1.2V power supply.
i
V
V
i2
R
52 1 C 1 R 1 C 1 R 2 R 2 R 3 tail I Itail3 3 tail I Itail3 o I o I IN IN M7 M7 M7 M7
Figure 48 Proposed voltage-to-current converter
The proposed topology of voltage-to-current converter is shown in Figure 48. The amplifier makes the input terminal a virtual ground and the input voltage is converted to current by the resistor R1 and flow into M7. The replica of M7 stage is made to copy the linear current and feed it to the filter. The R2 and C1 are the typical Miller compensation for the loop stability.
M4 M4 ref V cmfb V M3 M3 o V o V 2 C 2 C 3 R 3 R 2 tail I M1 M2 M2 M7 M1 M7 cmfb V i V Vi o V o V 1 tail I 1 C 2 R C1 R2 M7 M7 3 tail I o I Io 3 tail I Itail3 Itail3 1 R R1
53
For simplicity, the amplifier can be a single-stage differential pair with common-mode feedback circuit. The complete circuits of voltage-to-current converter with this simple OTA is shown in Figure 49. However, this simple OTA causes a CMFB issue that actually exists in many closed-loop application of the amplifiers.
1 R 2 R 1 C M2 M1 M7 3 R 2 C tail R ref V 3 tail I EA loop2 loop1
Figure 50 Common-mode half circuits of Figure 49
The common-mode half circuits are shown in Figure 50, where the error amplifier (EA) is illustrated as a symbol. Besides of the typical CMFB loop (loop1), there is also another positive feedback loop (loop2) which is formed by the negative feedback configuration of amplifier. Ideally, the gain of loop2 is below unity because the source degeneration of the first stage. However, when the bias current is high in
submicron technology, the output resistor of the tail current source Rtail is no more than 10kΩ. By using the small signal parameters given by DC simulation, it is found that the gain of loop2 is actually greater than unity and even comparable with loop2. Then the
54
frequency response shown in Figure 51 somehow becomes a positive feedback because the phase starts at zero. And there is even oscillation in the transient response, which will fail the normal operation of circuits.
Figure 51 AC response of CMFB in Figure 49
M1 M2 M2 M3 M4 M1 M6 M6 cmfb V ref V i V o V cmfb V M3 M4 cmfb V M5 M5 o V i V 2 C 2 C 3 R 3 R 1 tail I 2 tail I o I o I
Figure 52 Current mirror OTA for proposed V-I converter Gain
55
In order to solve this issue, a current mirror OTA is proposed as shown in Figure 52. And its device dimensions and components values are listed in Table 5.
Table 5 Details of components for OTA in Figure 52
Device Dimensions/Value Device Dimensions/Value
M1 (4) 3um/200nm M5 (12) 4um/200nm M2 (4) 4um/200nm M6 (4) 3um/200nm M3 (4) 3um/200nm M7 (4) 4um/300nm M4 (4) 4um/200nm R1 1.5kΩ Itail1 240uA R2 1.1kΩ Itail2 270uA R3 ||C2 32kΩ || 60fF Itail3 260uA C1 200fF 1 R 2 R 1 C M2 M1 M7 3 R 2 C tail R ref V 3 tail I EA M3 M4 loop2 loop1
56
The common-mode half circuits of the voltage-to-current converter with proposed current mirror OTA are drawn in Figure 53. The reason why using current mirror OTA is that it provides an additional stage in the common-mode circuit analysis compared with single-stage OTA. So the loop2 becomes a negative feedback one, eliminating the positive feedback problem.
Figure 54 AC response of CMFB in V-I converter with current mirror OTA
Figure 55 Transient response of CMFB in V-I converter with current mirror OTA Gain
57
Figure 54 shows the frequency response of the CMFB loop. It has a gain of 18dB, unity gain frequency of 335MHz and a 103 degree of phase margin. When injecting the common-mode current pulses to the output, the transient response is shown in Figure 55. The output voltage settles with an offset of 1mV.
in V gm1Vin I V I C gm2VI RII CII out V 1 R 2 R C1 2 1 / gm VI CIII II V 7 m g
Figure 56 Small signal model of loop gain in proposed V-I converter
Figure 56 shows the small signal model of the open-loop transfer function, where CI, CII and CIII are the parasitic capacitance at the mirror node, output of the OTA and
drain of M7 respectively. And RII is the output resistor of the OTA. The open-loop has
three poles and one zero at the following locations.
p1 II I m7 1 1 R C g R (3.6) m2 p2 I g C (3.7) m7 p3 II g C (3.8) z 2 m7 1 1 (R 1 / g ) C (3.9)
58
The Miller capacitor C1 makes ωp1 the dominant pole and ωp2 is lower than ωp3
because CI contains two Cgs at the mirror node. The right-half plane zero ωz is compensated by resistor R2 which is chosen to be equal to 1/gm7 to push the zero to
infinite frequency in this design. For obtaining a phase margin of 60 degree, the two non-dominant pole ωp2 and ωp3 should be beyond twice the unity gain frequency. Thus the transistor M2, M4 and M7 are designed with high Vdsat (200mV), which is also
benefit for low distortion.
Figure 57 Open-loop response of V-I converter
Figure 57 shows the open-loop frequency response of the voltage-to-current converter. The open-loop gain is 35.5dB and 3-dB bandwidth is around 10MHz. Also, the phase margin is about 60 degree.
Gain Phase
59 3.3 Output buffer
The output buffer is an inverting amplifier with the gain of unity shown in Figure 58. A typical class-A two-stage OTA shown in Figure 59 is used for the amplifier, whose design details are summarized in Table 6. Since the buffer has to drive the pad frame, bond wire and off-chip components, large bias current must be used for stability and linearity. in V in V out V out V R R R R
Figure 58 Output buffer schematic
M1 M2 M2 M3 M4 M1 M3 M4 M5 M5 M6 M6 cmfb V Vcmfb 1 R R1 2 C 2 C cmfb V ref V 3 R 3 R i V Vi o V o V o V o V 1 tail I 2 tail I 1 C 2 R C1 R2
60
Table 6 Details of components for OTA in Figure 59
Device Dimensions/Value Device Dimensions/Value
M1 (24) 4.6um/150nm M4 (34) 4um/150nm M2 (12) 1.4um/150nm M5 (2) 4um/150nm M3 (24) 1.4um/150nm M6 (4) 1.4um/150nm Itail1 800uA R1 32 kΩ Itail2 100uA R2 1kΩ C1 940fF R3 || C2 32kΩ || 60fF
The OTA uses a local CMFB in the first stage and a typical CMFB for the second stage, similar to the class-AB OTA used in the filter. It also has the same CMFB issue discussed in section 3.2, but this local CMFB alleviates the problem. Again, the common-mode half circuits are drawn in Figure 60.
1 R 2 R 1 C M2 M1 M3 3 R 2 C tail R ref V EA M4 loop2 loop1 R R
61
Even though the loop2 is still a positive feedback, loop1 is less coupled with loop2 so that the open-loop frequency response is less affected and is shown in Figure 61. Also the transient response is shown in Figure 62.
Figure 61 AC response of CMFB in output buffer
Figure 62 Transient response of CMFB in output buffer Gain
62
4. LAYOUT AND POST-LAYOUT SIMULATION
In1+ In1-In2+ In2-Out1+ Out1-Out2+ Out2-pad C pad C pad C pad C pin C pin C pin C pin C 1k 1k 1k 1k
Figure 63 Top-level test circuits
Figure 63 shows the overall top-level test circuits. A replica of the voltage-to-current converter and output buffer is also placed on chip for noise characterization. The rms value of the noise from voltage-to-current converter, output buffer and filter can be measured at the output1. And at the output2, the rms noise from the voltage-to-current converter and output buffer can be measured. Then the rms value of noise from the filter itself can be obtained by subtracting the previous two noise measurement results. After