Structural model constructing for optical handwritten
character recognition
P A Khaustov, V G Spitsyn and E I Maksimova
Department of computer engineering, Tomsk Polytechnic University, 30, Lenin Avenue, Tomsk, 634050, Russian Federation
E-mail: [email protected]
Abstract. The article is devoted to the development of the algorithms for optical handwritten character recognition based on the structural models constructing. The main advantage of these algorithms is the low requirement regarding the number of reference images. The one-pass approach to a thinning of the binary character representation has been proposed. This approach is based on the joint use of Zhang-Suen and Wu-Tsai algorithms. The effectiveness of the proposed approach is confirmed by the results of the experiments. The article includes the detailed description of the structural model constructing algorithm's steps. The proposed algorithm has been implemented in character processing application and has been approved on MNIST handwriting characters database. Algorithms that could be used in case of limited reference images number were used for the comparison.
1. Introduction
The optical handwritten character recognition is a technique that is widely used as a form of information entry from printed paper data records. It is applied in different areas such as medicine, education and sociology for processing questionnaires, task forms, case-records and other types of documents which can be processed automatically [1, 2]. A variety of handwriting makes the problem of the handwritten data recognition singificantly more sophisticated.
The most part of approaches to handwritten characters recognition are based on the features extraction. In these approaches the input image is represented as a feature vector that is used for classification, but this representation is inconvenient to keep track of the classification logic. Such logic monitoring may be required for an assessment of the similarity degree with the reference character images. In turn, this assessment can be used during the preparation for the Unified State Exam (USE). As known, the organizers of the Unified State Exam are often notice the problem of inability of Russian schoolchildren to properly fill the exam forms, according to the offered examples of characters representation. Schoolchildren often neglect the provided rules of answer forms filling and given examples.
That way, one can suppose that an implemention of the optical handwritten character recognition algorithm supporting the writing characters quality assessment in the answer sheets of USE is a relevant task. The main difficulties in the developing process of such algorithm include the ambiguity of writing characters methods, the similar ambiguity of selecting the way for characters similarity estimation, as well as the need for clarifying for the test-taker the difference between his way of
character representation and the reference one.
A usage of approaches based on features extraction and fuzzy classifiers is not appropriate for the described problem because of the requirement regarding an explanation of the characters similarity. The methods based on a structural components extraction can be used for optical character recognition with classification logic tracking. In these approaches there are no inconvenient for the human perception features, instead, the components of the character image are representated in form of geometric primitives in conjunction with the topological model. Such combination of topological model and structural geometric components is called a structural model. Also, these approaches are handy in case of a small reference images number that is insufficient to train or tune the classifier.
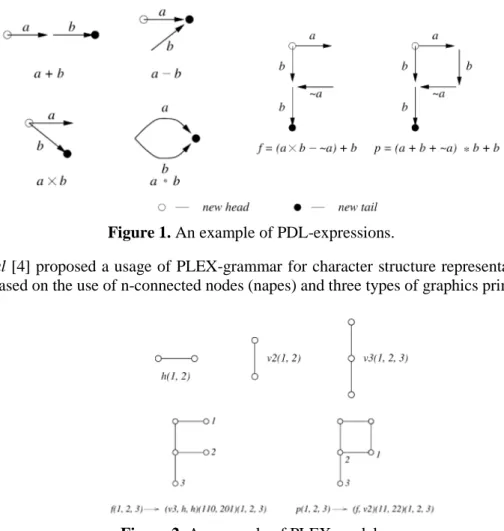
Researchers have made numerous attempts to develop a convenient model for both optical character recognition and classification logic tracking. One of the earliest attempts of Shaw etal [3] was to represent a character in form of PDL-expressions. These expressions allow to specify only a small part of the geometrical representations of certain character. Many characters can be defined in many different PDL-expressions.
Figure 1. An example of PDL-expressions.
Feder etal [4] proposed a usage of grammar for character structure representation. PLEX-grammar is based on the use of n-connected nodes (napes) and three types of graphics primitives.
Figure 2. An example of PLEX-model.
There were some other attempts to describe a character representation in a simple way. One of them is Berthod and Maroy's encoding scheme [5]. This scheme is based on the use of the five graphic primitives to describe the character image:
• straight line – T;
• minus (counter-clockwise) curve – M;
• pen-lift – L;
• cusp – R.
Figure 3. An example of character encoded with Berthod and Maroy’s encoding scheme. The most significant shortcoming of the described model constructing methods is an ability to construct mutliple models for the same character image. Also, multiple character representations may correspond to the same model. The numerous chain codes were proposed to reduce the ambiguity [6, 7].
Due to the ever-increasing power of computers methods based on character model constructing were replaced by the methods based on the artificial neural networks [8], support vector machines [9] and other classifiers [10]. But the same increasing of computing power leads to the new opportunities for models constructing. Now it is possible to obtain more detailed model of character's representation and to use it for the high-performance comparison of two models with respect to both topology and geometry of these models.
In this paper we present a novel approach to optical handwritten character recognition based on constructing a structural model that consists of key points, bends, edges, composite edges and a planar topological model. Also, we propose three different algorithms for structural models comparison. 2. Preprocessing
Firstly, to separate character's pixels from the background a binarization of the original image is performed. To obtain the information about the character's topology it is necessary to perform a skeletonization (thinning) of its graphical representation. The process of skeletonization reduces the variety of graphical representations corresponding to one character.
Since all well-known skeletonization algorithms with high performance have the certain drawbacks, we proposed to use two well-known algorithms one after the other: the Zhang-Suen thinning algorithm [11] and the Wu-Tsai algorithm [12].
During the testing we noted that there are some parts of character representation that are not fully skeletonized after the Zhang-Suen algorithm processing. This is due to the fact that the algorithm aims to preserve the initial topology of the object. During the structural components extracting the cases when there is more than one shortest path between two pixels of not fully skeletonized representation usually happen. Such ambiguity does not allow a proper extracting of the geometric characteristics of the connection between the two key points, and, as a result, the information about the structural components is lost. To avoid of the described problem we suggested to use the Wu-Tsai algorithm in order to eliminate the areas where skeletonization is not fully performed.
It should be noted that the Wu-Tsai algorithm quite often removes small elements belonged to the graphical representation of the character (important in terms of topology inference from a graphical representation). Thus, the usage of a single skeletonization algorithm leads to either a loss of information about the topology of a character graphical representation or to an ambiguity while attempting to retrieve the structural components. In turn, using the Zhang-Suen algorithm, and then the Wu-Tsai algorithm resolves both types of drawbacks.
3. Structural components extraction
To obtain the character's topological model the image obtained after the skeletonization should be processed with multiple runs of Lee algorithm [13], which is, basically, the breadth-first search algorithm for eight-connectivity components. All pixels corresponding to the character graphical representation are considered as vertices.
Figure 4. The visualization of the Lee algorithm process.
Then one can select the key points on the skeletonized image as shown in Fig. 4. These points will be considered as the vertices of the graph that corresponds to the final character model. The remaining pixels will be applied for constructing the edges. At first glance, the key points can be attributed only to the pixels, which can be determined based on the positions of black neighboring pixels. However, there are some pixels that cannot be referred to the key points but the connecting edge passing through them significantly changes its direction at such pixels. We will use the term bend for denoting such points. Thus, the most important pixels are divided into two groups:
• pixels, that are the key points of the character's graphical representation (the points where the drawing tool has been lifted, lowered or the direction of its path has been changed);
• pixels, that are related to the bend points, but do not belong to the key points (such points are used to define the shape of connecting edges between the key pixels). Their search can be performed using an iterative algorithm.
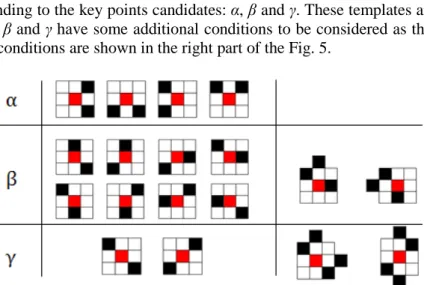
Initially we start with an assumption that the key points and bends are indistinguishable. So we need to find the key points candidates. During the experiments we have identified three groups of templates corresponding to the key points candidates: α, β and γ. These templates are shown in Fig. 5. Pixels from groups β and γ have some additional conditions to be considered as the corresponding to the template. Such conditions are shown in the right part of the Fig. 5.
Figure 5. The groups of templates and the corresponding conditions for the key point candidates. We start iteratively run Lee algorithm to detect the edges connecting the key points of the structural model. We run the bread-first-search waves simultaneously from all the key points which are found at
the moment. If two waves from different key points met at some point of the image, we assume that these key points are connected with the edge. One can easily restore the path and, as a result, a direction and a curvature of the corresponding edge. After the current run of the Lee algorithm is finished, all the key points that have only two incident edges with the angle of no less than 120 degrees between them, are considered as bends. If at least one such key point detected, the next run of the Lee algorithm is performed.
The complexity of the algorithm is determined by the complexity of each its iteration. Each iteration includes a separate running of the Lee algorithm that is the breadth-first search algorithm for eight-connectivity components. The complexity of this algorithm is O(H·W), where W and H are the image width and height respectively. Moreover, only black pixels after the performed skeletonization will be considered during the image processing. The number of such pixels for the real graphical representation of characters is much less than the total number of image pixels – W·H, so the described complexity estimation is unreachable. The number of iterations linearly depends on the number of bends B in the final representation of the model. The value of B, in turn, rarely exceeds the value of 15 for handwriting characters of Russian and English alphabets. Thus, the total complexity of the algorithm is O(B·H·W).
As one can notice, any pixel of the image, except for the key pixels and bends, corresponds to the connecting element between the key points. So, the graphical image of a character can be represented as a planar graph.
We introduce a term of composite edge. A composite edge is a sequence of edges with the bends between them. An edge – is the sequence of pixels forming a path between two pixels, each of which is either a key point or a bend.
4. Structural model constructing
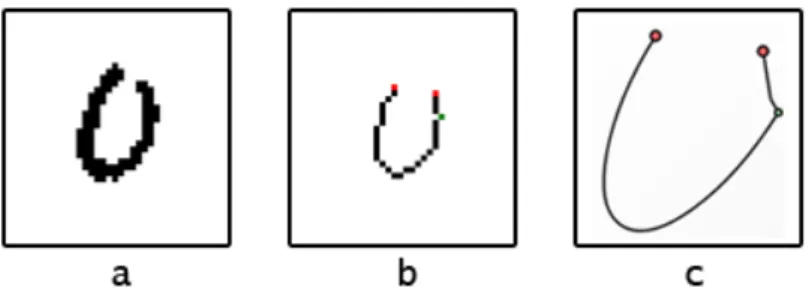
To simplify the graph structure it is necessary to approximate each composition of black pixels between the two bend points by some geometric primitive. The segment or the pair of segments composing the edge is the trivial case of such primitive. However, the cases are possible when the edge cannot be represented as one or two line segments, due to the high curvature of line which connects the considered points. In this case, it is reasonable to approximate the edge with an arc. In such approximation the radius and the position of the circle arc should be computed according to the coordinates of the key points and the curvature of the connecting line. When the curvature degree of the connecting line corresponds to the large circle radius, the larger part of a circle can violate the image bounds, strongly distorting the topological model of the character's graphical representation. So, it is reasonable to approximate such curve by the elliptical arc as it shown in Fig. 6.
Figure 6. An example of the necessity of the elliptical arc usage in the structural model (c) and the corresponding input image (a) and skeletonized image (b).
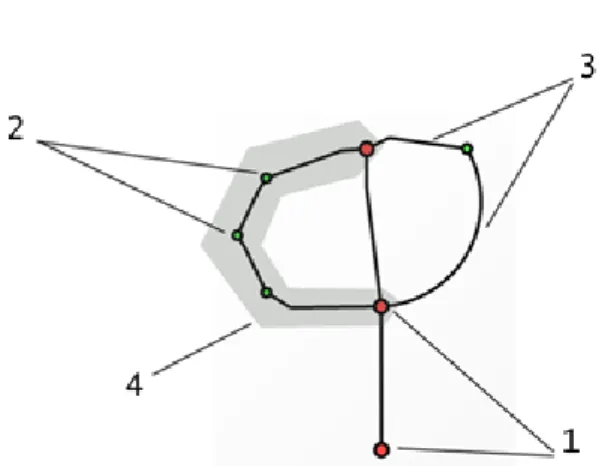
The structural model can be represented in the form of a planar graph whose vertices correspond to the key pixels of the character's graphical representation, and the edges – to the sequence of lines and curves connecting these key pixels. Each vertex is described by its position. Each edge, in turn, is described by the identifiers of connected vertices and by its curvature. Moreover, the segments of the connecting edges can be approximated both by line and by circle or ellipse arc. An example of the
structural model is shown in Fig. 7.
After being constructed the obtained structural models can be stored on a disk, for instance, in the XML format.
Figure 7. An example of the necessity of the elliptical arc usage in the structural model (c) and the corresponding input image (a) and skeletonized image (b).
5. Structural models comparison
In this paper we propose three algorithms of structural models comparison.
The first one is the algorithm based on the intersection method. This method is a typical intersection method used in assumption that all the graphic primitives of the structural model are considered as a separate planar object.
The second one is the algorithm based on the maximum matching of the minimum weight computation. The example of similarity assessment for two lines is the area of geometric shape between them: the smaller the area – the more similar these lines are. For each pair of edges of the first and the second topological models the numeric value of this area should be computed. Then we can create a bipartite graph. The vertices of the first partite set will correspond to the edges of the first topological model and the vertices of the second partite set – to the edges of second topological model. Each of the edges of obtained graph will correspond to a particular pair of connecting lines of two compared topological models. The weight of an edge in this case will be expressed as the area enclosed between two curves corresponding to this edge. It is required to find the maximum matching of the minimum weight for this graph. Such problem can be solved by an algorithm similar to the of Edmonds-Karp algorithm for searching of maximum flow. The computed weight of matching can be used as a quantitative measure of similarity between two topological models and, as the result, of characters corresponding to these models.
The third algorithm for structural models comparison is based on the probabilistic test to assess the degree of structural models similarity. In this test we represent the structural model as a track for some point. There are two types of actions:
• move a point along the edge to a distance d in some direction v;
• move a point to the nearest key point of the model.
After performing some random set of actions a distance between the resulting point locations is used as measure of similarity.
6. Results
The algorithm was implemented as a console application on C++ programming language using the tools of Open Source Computer Vision Library OpenCV. The training set for an artificial neural network has been generated from a database of CT scans of human lungs provided by the medical establishment. Its images are grouped by the type of disease: cancer, tuberculosis, sarcoidosis and all the others. For each of these four groups the recognition quality has been estimated.
As it was previously mentioned, the proposed method is appropriate in the case when the number of reference images for each of the classes is small.
When the number of reference images is large, the proposed algorithms will have a low performance due to the linear dependence the algorithm's time consumption on the reference images number.
The assessment of the proposed recognition approaches is being performed using the wide-known MNIST dataset of handwritten characters (70000 characters of 10 classes).
Our assessment includes the comparison of the three proposed optical character recognition algorithms based on a structural models constructing:
• method based on the maximum matching of the minimum weight computation (SMM);
• intersection method for a structural models (SMI);
• probabilistic test to assess the degree of structural models similarity (SMT).
Also, to estimate the quality of the optical character recognition, the proposed methods were compared with analogues which can operate with a small number of reference images:
• intersection method for bitmaps [14] (IM);
• algorithm based on the support vector machine usage (SVM);
• method based on using the probabilistic neural network (PNN);
• histogram method (HM);
• histogram method with in-out and out-in profiles (HMP).
A variable number of reference images E has been used for training or tuning in each of the experiments. Experiments were carried out for odd E values from 3 to 15.
The results of the experiments on MNIST dataset are given in the Table 1.
Table 1. The percentage of correctly recognized characters of MNIST dataset for each of the compared algorithms. E SMI SMM SMT IM SVM PNN HM HMP 3 89.1 93.2 78.1 87.4 83.8 70.9 71.5 74.1 5 90.8 95.1 79.4 88.7 85.5 73.2 72.2 74.3 7 91.2 95.1 80.0 88.9 87.0 74.2 72.6 74.8 9 91.3 95.2 80.0 90.4 88.2 74.7 72.8 75.0 11 91.3 95.2 80.2 90.4 88.5 75.3 72.9 75.1 13 91.3 95.3 80.2 90.6 88.6 75.5 73.0 75.1 15 91.4 95.3 80.3 90.7 88.6 75.8 73.1 75.2
As one can see from the results, the algorithm based on the maximum matching of the minimum weight for the given values of E performs better than the others. An advantage of this method is the most significant when the value of E is equal to 5.
Also, it should be noted that the algorithm based on a probabilistic test turned to be insufficiently effective and excelled in quality of recognition only the PNN and methods based on the histograms comparison.
In case of increasing the reference images number to a few thousands the recognition quality of the proposed algorithms improves insignificantly, while their performance becomes much worse. At the same time, when increasing the number of reference images to a few thousand the recognition quality of algorithms based on the support vector machine and PNN significantly improves.
To determine the classes which characters were incorrectly recognized more often than others, and to find the classes to which they have been wrongly classified, we can construct a confusion matrix for the high-efficiency algorithm based on the maximum matching of the minimum weight. The Table 2 contains the experimental data for the reference image number E = 15.
The diagonal elements of the matrix are expressed quite clearly. It approved that for each character class the proposed algorithm frequently classifies the corresponding image correctly. Nevertheless,
there are pairs of classes, whose structural models are similar enough that, together with the imperfections of the proposed approach, leads to misclassification.
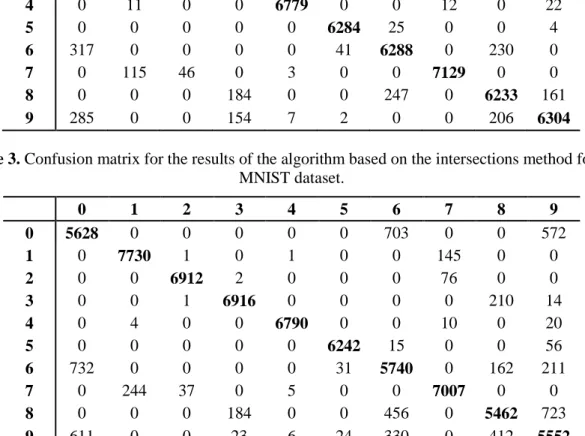
A similar confusion matrix is shown in Table 3 for the proposed algorithm based on the intersections method.
Despite the fact that the number of incorrect classifications is almost doubled (6021 compared to 3288), some pairs of classes became more distinguishable. For instance, the proposed algorithm based on the intersections method significantly better distinguishes classes that correspond to the numbers ‘3’ and ‘9’. However some classes became much less distinguishable. Those are, for example, classes corresponding to the digits ‘0’, ‘6’ and ‘9’.
Table 2. Confusion matrix for the results of the algorithm based the maximum matching computation for the MNIST dataset.
0 1 2 3 4 5 6 7 8 9 0 6239 0 0 0 0 0 379 0 0 285 1 0 7775 2 0 2 0 0 98 0 0 2 0 1 6896 2 0 0 0 91 0 0 3 0 0 1 6785 0 0 0 0 210 145 4 0 11 0 0 6779 0 0 12 0 22 5 0 0 0 0 0 6284 25 0 0 4 6 317 0 0 0 0 41 6288 0 230 0 7 0 115 46 0 3 0 0 7129 0 0 8 0 0 0 184 0 0 247 0 6233 161 9 285 0 0 154 7 2 0 0 206 6304
Table 3. Confusion matrix for the results of the algorithm based on the intersections method for the MNIST dataset. 0 1 2 3 4 5 6 7 8 9 0 5628 0 0 0 0 0 703 0 0 572 1 0 7730 1 0 1 0 0 145 0 0 2 0 0 6912 2 0 0 0 76 0 0 3 0 0 1 6916 0 0 0 0 210 14 4 0 4 0 0 6790 0 0 10 0 20 5 0 0 0 0 0 6242 15 0 0 56 6 732 0 0 0 0 31 5740 0 162 211 7 0 244 37 0 5 0 0 7007 0 0 8 0 0 0 184 0 0 456 0 5462 723 9 611 0 0 23 6 24 330 0 412 5552 7. Conclusion
In this paper the algorithm for optical character recognition has been proposed. This method is based on structural components extraction and has no requirements to the number of reference images.
The proposed approach outperforms its analogues in conditions of a small number of reference images. Another advantage of our method is its high performance as well as low memory consumption.
References
[1] Wang T, Wu Dj, Coates A and Ng Ay 2012 End-to-End Text Recognition with Convolutional Neural Networks Proc. of the Twenty-First Int. Conf. on Pattern Recognition 3304-3308 [2] Jaderberg M, Simonyan K, Vedaldi A, Zisserman A 2016 Reading Text in the Wild with
Convolutional Neural Networks Int. Journal of Computer Vision 116(1) 1-20
[3] Shaw A C 1969 A formal picture description scheme as a basis for picture processing system
Inform. Control14 9-52
[4] Feder J 1971 Plex Languages Inform Sci.3 225-241
[5] Berthod M, Maroy J P 1979 Learning in syntactic recognition of symbols drawn on a graphic tablet Comput. Graphics Image Process9 166-182
[6] Freeman H 1961 On the encoding of arbitrary geometric configurations IRE Transactions on Electronic Computers10 260-268
[7] Bribiesca E 1999 A new chain code Pattern Recognition32 235-251.
[8] Mehdi L, Solimani A and Dargazany A 2009 Combining wavelet transforms and neural networks for image classification 41st Southeasten Symposium on System Theory, Tullahoma, USA 44-48
[9] Vapnik V N and Cortes C 1995 Support Vector Networks Machine Learning20(3) 273-297 [10]Breuel T M, Ul-Hasan A, Azawi M Al and Shafait F 2013 High-Performance OCR for Printed
English and Fraktur using LSTM Networks Proc. of 12th Int. Conf. on Document Analysis and Recognition 683-687
[11]Zhang T Y, Suen C Y 1984 A Fast, Parallel algorithm for thinning digital patterns Image Processing and Computer Vision3 236-239
[12]Wu R-Y, Tsai W-H 1992 A new one-pass parallel thinning algorithm for binary images Pattern Recognition Letters13 715-723
[13]Lee C Y 1961 An Algorithm for Path Connections and Its Applications IRE Transactions on Electronic Computers10(2) 346-365
[14]Khaustov P A, Spitsyn V G and Maksimova E I 2014 Geneticheskij algoritm poiska mnozhestva krivyh dlja opticheskogo raspoznavanija simvolov s ispol'zovaniem metoda peresechenij [In Russian] Sovremennye problemy nauki i obrazovanija6 1-7