Improving the Accuracy of Real-Time Traffic
Data Gathered by the Floating Car Data
Method
Fajar Yoseph Chandra
Binus Graduate Programs, Bina Nusantara University Jl Kebon Jeruk Raya 27, Jakarta 11530
Email: [email protected]
Fergyanto E. Gunawan
Binus Graduate Programs, Bina Nusantara University Jl Kebon Jeruk Raya 27, Jakarta 11530 Email: [email protected] (corresponding author)
Garry Glann
School of Comp. Science, Bina Nusantara University Jl KH Syahdan 9, Jakarta 11480, Indonesia
Email: [email protected]
Alexander AS Gunawan
School of Comp. Science, Bina Nusantara University Jl KH Syahdan 9, Jakarta 11480, Indonesia
Email: [email protected]
Abstract—Despite the concern of privacy, the method of Floating Car Data (FCD) is clearly one of the cheapest methods to provide real-time or near real-time traffic in-formation. The method has become more affordable with the proliferation of smart-phones and with the existing infrastructure of the wireless network. In conjunction with the virtual trip lines (VTL), the FCD method can mimic the traditional traffic monitoring method on the basis of loop detectors. In addition, the use of VTL also helps the FCD method in preventing the potential of tracking the probe vehicle, which is used to gather and report the traffic information. Although vast publications regarding the FCD method are available, the issues of the optimal length of the VTL, the timeliness of the data, and the accuracy of the geo-location data have not been discussed. This article focuses and addresses these issues empirically using data collected by a probe vehicle traveling along Jakarta Inner Road Highway in Jakarta, Indonesia. Those data are collected using ten smart-phones of the same type. As the result, the optimal trip line length can be established as a function of the level of accuracy of the geo-location data. In the case where the level of accuracy is 32 m, we determine a VTL length of 26 m should provide 95% chance that the probe vehicle will cross the line. In addition, the currently developed system can also provide about 80% of the traffic data in less than 1 min, and the remaining 20% data within 1–5 min interval. Finally, by applying a simple moving average filter, the prediction of the traffic velocity can be increased significantly, and the geo-location data error can be reduced up to 20%.
Keywords—Floating Car Data, Advanced
Trav-eler Information System, Global Positioning Sys-tem, Intelligent Transportation Systems.
I. INTRODUCTION
Providing real-time traffic information is of interest of many parties. The information can help travelers for a better route choice [1] by avoiding traffic congestion.
The use of traffic information can also increase the efficiency of the transport network.
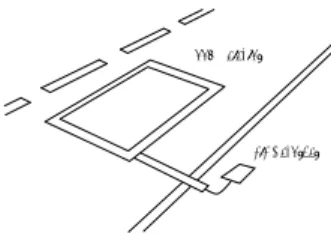
Traditionally, traffic data are collected using loop detectors implanted beneath road surface (see Fig. 1). However, the use of loop detectors is limited in term of coverage area and is prone to errors and malfunction. In California, about 30% of 25,000 loop detectors do not work properly in the daily basis [2].
Data Recorder Loop Detector
Fig. 1. Traffic measurement using a loop detector. Another method, so called Floating Car Data (FCD) method, has shown having great potential to acquire the traffic information at lower cost. The method uses probe vehicles enriched with an equipment to measure the vehicle velocity and position, and to transmit those data via a wireless network.
Nowadays, many cities collect traffic information using both methods: the traditional method using loop detectors and CCTV, and the FCD method. For exam-ple, the city of Seoul uses taxis as the probe vehicles with GPS positioning and wireless communication beside loop detectors and CCTVs [3].
For the reason, many previous publications were directed to discuss various issues related to FCD. Ref. [4] was one of the earliest publications prior the smartphones era. Ref. [5] discussed the use of transit vehicles, proposed the Kalman filter to estimate the
INSPEC Accession Number: 14649755 DOI: 10.1109/ICoICT.2014.6914094
http://dx.doi.org/10.1109/ICoICT.2014.6914094
Published in: Information and Communication Technology (ICoICT), 2014 2nd International Conference on Date of Conference: 28-30 May 2014
vehicle position and velocity, compared the estimated velocity to those measured by a speed-trap, and de-veloped a graphical application to display the data in real-time. Ref. [6] studied the use of FCD using a microsimulation model, and evaluated the technique performance in terms of accuracy, reliability, timeli-ness, and coverage. Finally, they concluded that the number of probe vehicles was critical for coverage and accuracy, and recommended a penetration rate of 3% for freeways and 5% for surface roads to provide a reasonably accurate data. The penetration rate was defined as the number of probe vehicles during an averaging time interval (ta) on a traffic link having
a flow rateQ.
In addition, Ref. [7] presented a large scale im-plementation of a traffic management system, which was called OCTOTelematics FCD system. At that time, the system received traffic data from 600 000 private vehicles. The paper also proposed the artificial neural network and pattern matching algorithms to predict the short-term travel speed. They evaluated their algorithms using the traffic on the Rome Ring Road in Rome, Italy, having a length of 68.2 km with 2.4% penetration rate, 33 entries/exists, and 15 000 floating cars in workdays. Ref. [8] proposed a method to use transit buses enriched with GPS sensor as probe vehicles. The buses were used to measure the travel time data, and a procedure was proposed to estimate the associated road travel time. Ref. [9] evaluated the reliability of using a taxi dispatch system for real-time traffic information. They found that the taxi, among commercial vehicle operations, was the most appropriate for the purpose; however, the taxi suffered a number of issues. Their findings were: the taxi provided good traffic data on high demand links, the dispatch system could not be a single source of real-time data, the data from the vacant taxis needed careful consideration, GPS location errors had little impact on traffic monitoring, and finally, the system provided good data for a long road segment. Ref. [10] developed an integrated smartphone-based platform to acquire, transfer, process, and display traffic and vehicle related data.
In 2010, Ref. [2] demonstrated the use of FCD method in conjunction with smart-phone to provide real-time traffic information, and performed the first field experiment that capable to maintain 2–5% pene-tration rate involving 100 vehicles to cover a 10–16 km long freeway. Proliferation of smart-phones brings the cost to develop the FCD infrastructure to very low level [11].
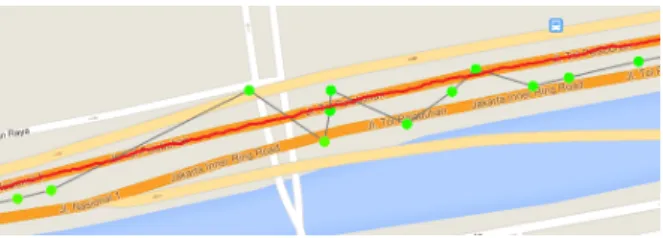
However, the use of the low cost smart-phone suffers a number of issues. The first issue is that the geo-location data collected by the device usually has low accuracy (see Fig. 2). To avoid this issue, the col-lected data usually required some sort of map-matching
scheme to project the data to a correct road. However, this process requires a significant computation resource and is often executed in the server side.
Fig. 2. Reported off-road geo-locations due to GPS error. The actual vehicle trajectory is depicted by a continuous red line.
The second issue is related with the privacy of those parties who contribute to provide the traffic data. When a probe vehicle continuously submits its location, there is potential that the vehicle position can be traced. To minimize this issue, Ref. [2] proposed the use of the virtual trip line (VTL), which is a virtual line connecting two pre-defined geo-coordinates (see Fig. 3). The use VTL has many benefits; a few are: it mimics the traditional system on the basis of the loop detector, it can be located where the traffic velocity data are important and can be measured accurately, and privacy can better be protected.
Probe vehicles Undetected Trajectory
Detected Trajectory
Virtual Trip Line
Fig. 3. Undetected and detected probe vehicle recorded trajectories around a virtual trip line.
II. DESCRIPTION OFFLOATINGCARDATASYSTEM The present infrastructure for the floating car data system is depicted in Fig. 4. The system has three main components, namely, a probe client, a web server, and a web client. Probe Vehicle Cellphone Web Database Web Client Internet
Fig. 4. Framework of traffic monitoring using the floating car data method.
Currently, the probe client utilizes a smartphone, which is a hand-held device that integrates the func-tionality of a mobile phone with other features but mainly with geo-location functionality. The probe
client is attached to a probe vehicle and is used to measure the probe vehicle position, velocity, and heading. Finally, those data and related timestamps will be transmitted to a server via a wireless network.
In the current development, the probe client is an Android application installed in a mobile phone, and the phone will be attached to a probe vehicle. The Android application is designed according to the soft-ware architecture depicted in Fig. 5. The application
Android System
GPS 3G
Probe Client Application
Android API
Hardware
Fig. 5. The software architecture of the probe client application. uses Android API and its underlying system to access the built-in GPS receiver unit. The GPS unit provides data related to the phone position, velocity, bearing, accuracy and timestamps. Those data are then prepro-cessed and finally are transmitted to the web server via the 3G network.
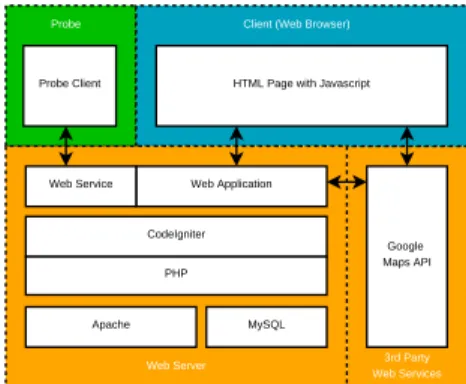
Meanwhile, the software architecture of the server side applications for FCD traffic monitoring is shown in Fig. 6. The server side consists of web server, client,
Web Application
CodeIgniter
PHP
MySQL Apache
HTML Page with Javascript
Client (Web Browser)
Web Server Google Maps API Probe Client Web Service Probe 3rd Party Web Services
Fig. 6. The software architecture of the server side application. 3rd party web services, and probe subsystems. The web server is the core system that collect, process, store, and provide traffic information. The system has two features: web service and web application. The web service communicates with probe clients to receive updates of the traffic data. The other feature, web application, is accessible from client web browser to retrieve traffic information. The client web browser is the only component accessible by end users. The web
application will instruct a client web browser to load map provided by Google Maps API, and will overly traffic information on the map.
The web service and web application is a single sys-tem build on top of CodeIgniter framework, which uses PHP programming language. The use of CodeIgniter framework is preferred since it offers numerous techni-cal advantages and organizational advantages, such as faster development and cleaner application structure, in comparison to developing native PHP application [12]. PHP is installed as a module on Apache web server and also integrated with MySQL database server.
III. METHOD
This work is intended to address the three following issues: how to determine the optimal length of the VTL, how to improve the accuracy of the vehicle location and velocity recorded by a smart-phone, and the extent of the delay time.
The first two issues were addressed by the follow-ing approach. The optimal length of the virtual trip line was determined empirically on the basis of data recorded using ten units of smart-phones of similar type. In the current experiment, we utilized Samsung Galaxy Fame S6810. Those phones were installed with a custom-made application (see Fig. 7), which was designed to track the movement of a probe vehicle.
Fig. 7. The GUI of the client-side application for traffic monitoring using floating-car data system.
The application was designed to record the vehicle position, longitude and latitude, and also the vehicle instantaneous velocity, and transmitted those data to a designated server. Those data were established by a Global Navigation Satellite System (GNSS). In the current investigation, the application also transmitted the capture time of the data.
The data were recorded on January 3, 2014 where the probe vehicle was driven along Jakarta Inner Ring Road, which has three vehicular lanes on each direction for the majority of the road segments. During the test, the probe vehicle was maintained to move along the central vehicular lane of the road. In total, 16,363 GPS location data were obtained during the test.
The GPS location data were projected to the road GIS line using the algorithm explained in the follow-ing. Finally, the projection length was used to establish the optimal length of the virtual trip line.
For a given GIS line, and two GIS points,x1
r and
x2
r, we can establish the direction of the line segment
by (see Fig. 8): ˆ r= x 2 r−x1r kx2 r−x1rk ,
wherekkdenotes the Euclidian norm. We project the GPS pointxonto the line by the vectord, which is:
d= x−x1r − x−x1r ·ˆrˆr.
The projection length is simplykdk, and this algorithm was applied to those 16,363 data, and the statistical distribution of the deviationkdk was established from which an optimal length of the VTL was determined.
d GIS Line GPS Point x xr xr 1 2
Fig. 8. Projection of a GPS point to a GIS line. The improvement of the vehicle position was studied by applying the moving average (MA) filter with weight, which was set to inversely proportional with the recorded level of accuracy. We should note that the GNSS system also provides the level of accuracy data for each reported location data. The length of the filter was varied and its effect to the vehicle position improvement was studied.
The improvement of the vehicle velocity was em-pirically studied based on the data recorded in the experiment performed by Ref. [13] and by applying the ergodicity principle [14].
IV. RESULTS ANDANALYSIS
A. Optimal Length of the Virtual Trip Line
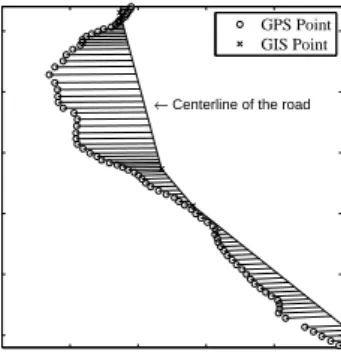
By applying the algorithm developed earlier, we can now analyze characteristics of the GPS data error. This error is clearly seen in Fig. 9, where a small segment of the observed road is shown in addition to the GPS recorded geo-location data. The figure also shows the
projection lines connecting the GPS points to the points on the GIS line.
106.8731 106.8732 106.8733 106.8734 106.8735 106.8736 −6.2045 −6.204 −6.2035 −6.203 −6.2025 −6.202
← Centerline of the road
Longitude (Deg)
Latitude (Deg)
GPS Point GIS Point
Fig. 9. An example of the recorded GPS points and their projection to the GIS line, which represent the centerline of the road where the probe vehicle traveled.
The GPS recorded data also contain the GPS level of accuracy for each reported geo-location data. Thus, the statistical analysis of the GPS error data must be performed on each level of accuracy.
Furthermore, in order to determine the confidence interval, associated with the length of VTL, we should establish the statistical distribution of the GPS error data. We assume the data are normally distributed, and the data are numerically and visually inspected for the distribution. The following criteria are used to evaluate the normality of the GPS error data:
• Skewness and kurtosis z-values should be some-where in the span of−1.96 to+1.96,
• The Shapiro-Wilk test p-value should be above 0.05, and
• Histogram and normal Q-Q plots should indicate normality.
Evaluation on these criteria—skewness and kurtosis in Table I, Shapiro-Wilk test in Table II, histograms in Fig. 10, and Q-Q plots in Fig. 11—leads us to conclusion that the GPS error data are approximately normally distributed with skewness of 0.199 (SE = 0.403),−0.496(SE = 0.403),0.406(SE = 0.394), and
0.394 (SE = 0.403) for accuracy level of 4 m, 6 m, 8 m, and 32 m, respectively.
In order to provide a reliable monitoring system, the VTL length should be determined based on the GPS error data of the lowest possible measurement accuracy given by the equipment/smart-phone. For the present case, the smart-phone can provide the level of accuracy of 32 m on the worse case scenario. Therefore, the length is set at 95% confidence interval withz = (d−µ)/σ, where z = 1.96, µ = 0.956 m, andσ= 6.21 m (see Table I). Finally, we obtain a VTL length ofd=±13 m. Therefore, with the total VTL length of 26 m, a probe vehicle will be detected by the VTL at 0.95 probability at the worst scenario or the lowest level of accuracy.
Statistics Std. Error Statistics Std. Error Statistics Std. Error Statistics Std. Error Mean -2.61E-01 2.85E-01 -5.32E-02 7.04E-01 -2.61E+00 4.12E-01 9.56E-01 1.07E+00 Lower Bound -8.40E-01 -1.49E+00 -3.45E+00 -1.21E+00 Upper Bound 3.19E-01 1.38E+00 -1.77E+00 3.12E+00 5% Trimmed Mean -2.69E-01 4.58E-02 -2.69E+00 8.42E-01 Median -6.74E-01 8.90E-01 -2.94E+00 -5.34E-02 Variance 2.757 1.69E+01 5.77E+00 38.599 Std. Deviation 1.66E+00 4.11E+00 2.40E+00 6.21E+00 Minimum -3.70E+00 -9.43E+00 -6.79E+00 -8.92E+00 Maximum 3.71E+00 8.87E+00 2.67E+00 1.28E+01 Range 7.42E+00 1.83E+01 9.45E+00 2.17E+01 Interquartile Range 2.38E+00 5.56E+00 2.91E+00 8.95E+00 Skewness 0.199 0.403 -0.496 0.403 0.649 0.403 0.394 0.403 Kurtosis -0.117 0.788 0.024 0.788 0.055 0.788 -0.743 0.788 z-value of skewness 0.494 -1.231 1.610 0.978 z-value of kurtosis -0.148 0.030 0.070 -0.943
95% Confidence Interval for Mean
GPS Accuracy 4 m 6 m 8 m 32 m TABLE I
THE STATISTICAL DESCRIPTION OF THEGPSERROR DATA.
Statistic df Sig. Statistic df Sig.
4 0.117 34 0.2 0.982 34 0.824 6 0.162 34 0.024 0.951 34 0.133 8 0.18 34 0.007 0.943 34 0.073 32 0.111 34 0.2 0.953 34 0.146 GPS Accuracy (m) Kolmogorov-Smirnov Shapiro-Wilk TABLE II
THE RESULTS OF THE NORMALITY TEST OF THEGPSERROR
DATA.
B. Position Accuracy
Many present smart-phones offer the level of accu-racy of a few 10-m for their geo-location data. Thus, the position data are sometimes rather far from the actual vehicle position as typically shown in Fig. 12. To use such data, traditionally we need to perform a map-matching procedure to correct the data error. This procedure is rather computationally demanding; thus, it is often performed in the server side of the system. Many commercial mapping system also limit the use of the procedure. Thus, it is a great importance, in regards
−40 −2 0 2 4 2 4 6 8 10 12 Accuracy = 4 m Distance (m) Frequency −100 −5 0 5 10 15 2 4 6 8 10 12 14 16 Accuracy = 32 m Distance (m) Frequency
Fig. 10. Histogram of the GPS error data.
−3 −2 −1 0 1 2 3 −4 −3 −2 −1 0 1 2 3 4
Standard Normal Quantiles
Quantiles of Input Sample
Accuracy = 4 m −3 −2 −1 0 1 2 3 −8 −6 −4 −2 0 2 4
Standard Normal Quantiles
Quantiles of Input Sample
Accuracy = 32 m
Fig. 11. Q-Q plot of the GPS error data.
to the floating car data system, to be able to correct the geo-location error with the limited computational resource in the client side.
In the following, we present the level of improve-ment when a simple weighted moving averaging filter is applied to the recorded geo-location data. In partic-ular, Fig. 13 shows the reduction of the largest data error when the filter length is increased from 3-point to 31 point. For this particular case, the use of 11-point MA has reduced the position error by 20%.
The fact that the simple MA filter can quickly reduce the error of the geo-location data is assuring because the filter can be applied sequentially and requires very low computational resource.
106.8737 106.8744 −6.215 −6.206 Longitude (degree) L a ti tu d e (d eg re e) GIS Line GPS Track Smoothed Track
Fig. 12. The actual and corrected position of the probe vehicle and GIS line.
0 10 20 30 40 14.5 15 15.5 16 16.5 17 17.5 18 18.5 19 Number of Points in MA D is ta n ce to G IS L in e (m ) Without weighting With weighting
Fig. 13. Reduction of the distance of the probe vehicle to the GIS line as a function of the number of points of the moving average filter.
C. Delay Time
The delay between the time when the traffic data are gathered and the time when the data are presented to the traveler is unavoidable. However, this delay time should be minimized in order to provide near real-time traffic information.
We analyze the characteristics of the delay time of the current system by comparing the time when the traffic data reach the server and the time when the data are captured by the client application.
The typical delay time data are shown in a scatter plot in Fig. 14. Those data were recorded in an exper-iment where the probe vehicle was set to transmit the data for each second of the measurement. Those data are summarized in a histogram in Fig. 14, and conclude that more than 80% of the data were successfully transmitted within 1 min interval, and the rest of the data were transmitted within 1–5 min interval.
0 1000 2000 3000 4000 5000 6000 0 1000 2000 3000 4000 5000 6000
Line of zero delay time→
Client Submission Time (s) N= 4533 S er v er R ec ei v in g T im e (s ) 0 60 120 180 240 300 360 0 10 20 30 40 50 60 70 80 90 100 N= 4533 Transmission Time (s) P ro p o rt io n (% ) 83.3 6.5 4.9 3.1 2.2
Fig. 14. Typical relation between the client data submission time and the server data receiving time, and proportion of the delay time for various delay time intervals.
V. CONCLUSION
To provide real-time traffic information at low cost, the present Floating Car Data system with virtual trip line (VTL) that exploits the proliferation of smart-phones faces a few challenges such as the privacy
protection of the probe vehicle, the optimal length of the VTL line, and minimizing huge error in the geo-location and velocity data. This work has addressed some of those issues by deploying a few simple pre-diction methods. The work leads us to conclusions: a VTL length of 26 m can provide 95% chance that the probe vehicle will cross the line, the delay time can be maintained below 1 min for 80% of the cases, and the prediction of the velocity and position can be improved significantly by applying the weighted moving average method.
ACKNOWLEDGMENT
We offer our highest appreciation to Dir. General Higher Education of Rep. Indonesia for the support via the Competitive Res. Grant No.: 017.A/DRIC/V/2013.
REFERENCES
[1] R Arnott et al., “Does providing information to drivers reduce traffic congestion?” Transp. Res. Part A, 25A(5):309–318, 1991.
[2] J C Herrera et al., “Evaluation of traffic data obtained via gps-enabled mobile phones: The mobile century field experiment,” Transp. Res. Part C: Emerging Tech., 18:568–583, 2010.
[3] J D Nelson et al., “Intelligent trans. systems solutions in transitional countries: The case of Korea,” Trans. reviews, 21:51–74, 2001.
[4] K. K. Sanwal and J. Walrand, “Vehicles as probes,” University of California, Berkeley, California PATH Working Paper UCB-ITS-PWP-95-11, 1995.
[5] F Cathey and D Dailey, “Transit veh. as traffic probe sensors,” inProc. IEEE ITS, 579–584, Aug. 2001. [6] X. Dai et al., “A simulation evaluation of a real-time
traffic information system using probe vehicles,” in
ITS, Proc. 2003 IEEE, vol. 1, 2003.
[7] C. D. Fabritiis et al., “Traffic estimation and prediction based on real time floating car data,” in 11th Int. IEEE Conference on ITS, 2008.
[8] N. Uno et al., “Using bus probe data for analysis of travel time variability,”ITS, 13(1):2–15, 2009. [9] K. Liu et al., “Feasibility of using taxi dispatch sys.
as probes for collecting traffic info.,” J. of ITS, 13, 16–27, 2009.
[10] C. Campolo et al., “Smartcar: An integrated smartphone-based platform to support traffic management app.,” in 1st Int. workshop on veh. traffic management for smart cities, 2012.
[11] T. Jeske, “Floating car data from smartphones: What google and waze know about you and how hackers can control traffic,” in Black hat Conf., Las Vegas, Nevada, July 27–Aug. 1, 2013.
[12] I P Vuksanovic et al., “Use of web app. frameworks in the development of small app.,” in MIPRO, IEEE proc. of the 34th int. conv., 458–462, 2011.
[13] Y. Sugiyama, et al., bottlenecks—exp. evidence for the physical mechanism of the formation of a jam,”
New Journal of Physics, 10:033001, 2008.
[14] F E Gunawan, et al., “Ergodicity of traffic flow with constant penetration rate for traffic monitoring via floating vehicle tech.,” in ICASCE, 2013, Jakarta, Indonesia