Convolutional Neural Network Based Chart Image
Classification
Jihen Amara Digital Research Center of Sfax (CRNS), MIRACL
Laboratory University of Sfax, Tunisia
Pawandeep Kaur Heinz-Nixdorf Chair for Distributed Information Systems, Friedrich-Schiller-Universität Jena, Germany [email protected] Michael Owonibi Heinz-Nixdorf Chair for Distributed Information Systems, Friedrich-Schiller-Universität Jena, Germany [email protected] Bassem Bouaziz Higher Institute of Computer Science and
Multimedia, MIRACL Laboratory University of Sfax, Tunisia [email protected]
ABSTRACT
Charts are frequently embedded objects in digital documents and are used to convey a clear analysis of research results or commercial data trends. These charts are created through different means and may be represented by a variety of patterns such as column charts, line charts and pie charts. Chart recognition is as important as text recognition to automatically comprehend the knowledge within digital document. Chart recognition consists on identifying the chart type and decoding its visual contents into computer understandable values. Previous work in chart image identification has relied on hand crafted features which often fails when dealing with a large amount of data that could contain significant varieties and less common char types. Hence, as a first step towards this goal, in this paper we propose to use a deep learning-based approach that automates the feature extraction step. We present an improved version of the LeNet [LeCu 89] convolutional neural network architecture for chart image classification. We derive 11 classes of visualization (Scatter Plot, Column Chart, etc.) which we use to annotate 3377 chart images. Results show the efficiency of our proposed method with 89.5 % of accuracy rate.
Keywords
Chart Image Classification, Data Visualization, Deep Learning, Dataset Annotation.
1
INTRODUCTION
In recent years, there has been growing interest in data visualization due to its ability to present meaningful insights into the complex and data of ever increasing sizes. Thus, Visualization is important for scientists as it helps them in exploring, analyzing, and publishing their results.
Most of the different types of visualizations and graphs, produced in papers, are designed to be human understandable and are not typically machine readable. In most cases, these visualizations (which are typically in raster image format) are hard to decode by machines. However, there is a growing need in many applications and domains for machine’s ability to read, extract and interpret insights presented in chart images automati-cally. The major challenge when attempting to interpret such charts automatically is the variant structure and
Permission to make digital or hard copies of all or part of this work for personal or classroom use is granted without fee provided that copies are not made or distributed for profit or commercial advantage and that copies bear this notice and the full citation on the first page. To copy otherwise, or re-publish, to post on servers or to redistribute to lists, requires prior specific permission and/or a fee.
visual appearance of these images. Thus, it is difficult for machines to automatically classify the chart type and understand the encoded information efficiently. The field of Document Analysis and Recognition addresses this problem by using Computer Vision techniques to decode the information from charts. This has led to the emergence of a sub field which is known as ’Chart Image Analysis’. Techniques in ’Chart Image Analysis’ extract, classify and interpret charts to provide valuable information. This information then helps in chart redesigning, knowledge mining and domain-based visualization recommendation studies. Motivated by advances in pattern recognition tech-niques, especially convolutional neural networks (CNNs), which has managed to produce remarkable results in the field of image classification, we propose a new system based on CNNs for chart analysis. The model can learn visual features directly from images and is able to recognize eleven types or classes of charts (Categorical Boxplot, Column Chart, Dendrogram, Heatmap, Line Chart, Map, Node-Link Diagram, Ordi-nation scatterplot, Pie Chart, Scatterplot and Stacked Area Chart). While the identification of a visualization class does not on its own generate the full information that the visualization presents, it can provide basic
and important clues about the representational goal of the statistical graph. For example, whether the graph is representing a comparison among data entities (variables) or is showing the distribution of some entities (variables) over the temporal scale, etc. This information can then be combined with some auxiliary information (e.g. knowledge extracted from carrying out Natural Language Processing on the caption of the statistical graph) to derive the concrete message that visualization conveys.
The rest of the paper is organized as follows. In Section 2, we present the motivation behind this work. The literature review is presented in Section 3. Our proposed method is described in Section 4. Experimental evaluation and results are reported in Section 5. Finally, Section 6 concludes the paper and provides an outlook to future work.
2
MOTIVATION
The motivation behind this work is to automatically classify the chart image types from an image dataset and to use this classification in tagging captions from these chart images. This will help in the creation of domain (biodiversity in our case) knowledgebase which will provide the contextual information about the dataset that needs to be visualized. This further will be an assistant to our visualization recommendation en-gine. Visualization recommendation is a subdomain in data visualization research that uses different strategies to assist user in the selection of suitable visualization for representing their data. With the growing amount of data and increasing availability of different visualiza-tion techniques, the selecvisualiza-tion of suitable visualizavisualiza-tion become more critical especially for users who are not well versed in visualization creation process. Hence, visualization recommendation strategies can effectively assist the user in making a choice of an appropriate visualization by considering different aspect of data, domain, user and goals. To provide visualization suggestions for the specific domain, it is important to first understand the visualization usage pattern from this domain. To fulfil that, we have gathered a dataset of 96837 images from 26588 biodiversity publications. To automatically classify this big dataset of chart images into different visualization classes or chart types, we used a model based on Convolutional Neural Network (CNN).
3
LITERATURE REVIEW
Chart image classification is an important step in chart recognition and understanding. One of the major chal-lenges in chart image classification is the variability of the structure and visual appearance of each chart type. To address this challenge, techniques from im-age processing, raster to vector conversion, layout and
pattern analysis have been used. These techniques are broadly divided into model based approaches and ma-chine learning based approaches.
Model Based Approaches
A distinctive model is designed for each chart type that constitutes of specific features of the chart. These fea-tures include: (1) graphical elements of the charts, e.g., axis, colors etc. [Shao 05], (2) layout of the chart, e.g., rectangular (for xy charts), circular (for pie charts) etc. [Yoko 97], and (3) patterns or local structures appearing frequently in charts [Inok 00]. By extracting the feature information, a model is developed for each chart type that contain specific feature information about the spe-cific chart and governs some rules and constraints to distinguish one chart from other. The main drawback of the model based approaches is that such a system can handle only predefined charts for which the graph-ical model was available. Even a slight change in the chart style will be considered different and would need a new model. Thus, such technique cannot be used to classify wide styles of chart. Therefore, machine learning techniques that considers graphical elements of charts as whole object instead of different segments were adopted.
Machine Learning Based Approaches
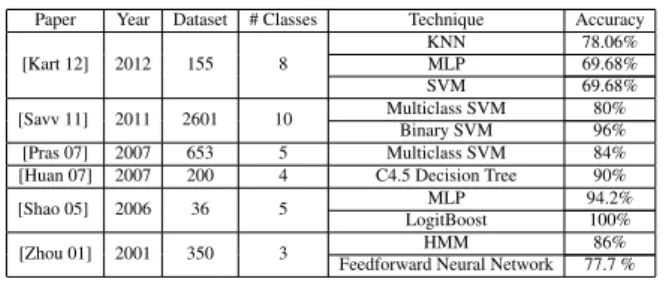
We have done a survey of the different machine learn-ing techniques used for recognition and classification. Table 1 summarize some work.Paper Year Dataset # Classes Technique Accuracy [Kart 12] 2012 155 8 KNN 78.06% MLP 69.68% SVM 69.68% [Savv 11] 2011 2601 10 Multiclass SVM 80% Binary SVM 96% [Pras 07] 2007 653 5 Multiclass SVM 84% [Huan 07] 2007 200 4 C4.5 Decision Tree 90% [Shao 05] 2006 36 5 MLP 94.2%
LogitBoost 100% [Zhou 01] 2001 350 3 HMM 86% Feedforward Neural Network 77.7 %
Table 1: Machine learning based approaches
Even though different methods have achieved good classification results for identifying and recognizing certain types of chart images, they mostly rely on hand-crafted features such as color histograms, texture features, shape features and Scale-invariant feature transformation (SIFT). Also, these methods do not generalize well and they are not effective when dealing with a large amount of data that could contain signifi-cant varieties as in the case of our chart image dataset. For example, the bar chart and column chart are considered the same but their orientation is different. Furthermore, the problem of multi-chart images with same or different chart types hinders the accurate detec-tion. Recently, [Lee 15] have proposed an algorithm to automatically segment multi-chart visualizations into a
set of single-chart visualizations. Besides, due to the lack of standardization in chart construction and chart templates, there exist great diversity of chart types and styles, which are somehow very subjective. Moreover, the accurate detection becomes more difficult when handling degraded, distorted or rotated charts with different scales, noisy and hand-drawn inputs.
Hence, in our work we designed a convolutional neural network (CNN) based model to automatically classify chart images and consequently avoid segmentation and hand-crafted features extraction.
4
PROPOSED METHOD
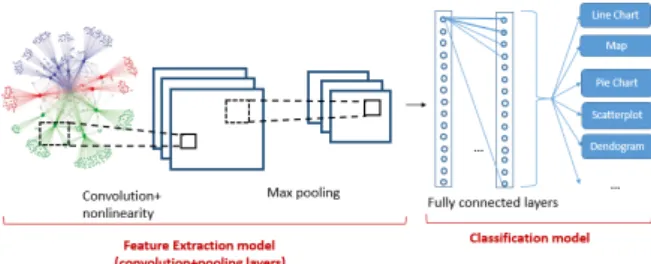
As described above, different approaches have been proposed in the literature to deal with the problem of chart image classification, the variation in chart style, size, color, resolution and content are not yet resolved (i.e. marks within data graphics are discrete and ar-eas are in uniform color). Hence, following the suc-cessful application of convolutional neural networks [Deng 14, Arel 10] in many computer vision tasks, we propose a method based on CNN to classify chart im-ages into eleven types. More specifically, we designed a CNN based model inspired from the LeNet architec-ture [LeCu 89]. It has a total of eight layers comprising one initial input layer, five hidden layers followed by one fully connected layer and ending with the output classifier layer. The hidden layers are convolution and pooling layers which act as feature extractors from the input images while the fully connected layer acts as a classifier. In fact, the main purpose of convolution is to extract features automatically from each input image. The dimensionality of these features is then reduced by the pooling layer. At the end of the model, the fully con-nected layer with a softmax activation function makes use of the learned high-level features to classify the in-put images into predefined classes.
Figure 1: A graphical depiction of the proposed ap-proach
Consequently the proposed model, illustrated in Figure 1, is composed of two main parts: the first part is the self-taught feature extraction model and the second part is the classification model. In the rest of this section, we will detail these two components.
4.1
Feature extraction model
The feature extraction model is the part where the net-work learns to detect different high-level features from the input images. It consists of a sequence of convolu-tion and pooling layers.
Convolution map:The convolution layer is an elemen-tary unit in a CNN architecture. The goal of convolu-tion is to extract features from the input image. It con-sists of a set of learnable filters. Each filter is applied to the raw pixel values of the image taking into account the red, green and blue color channels in a sliding win-dow fashion, computing the dot product between the filter pixel and the input pixel. This will result in a 2-dimensional activation map of the filter called fea-ture map. Hence, the network learns filters (i.e., edges, curves) that will activate when they find known features in the input.The CNN learns the values of these filters on its own during the training process.
The Convolution operation is presented in Equation 1. A convolution layer is configured by the number of convolution maps it containsMi, the size of the filters
which are often squaredkx·ky. The feature mapMi is
computed as follows:
Mi=bi+
∑
kWik?Xk (1)
where?is the convolution operator,Xkis thekth input
channel,Wikis the sub kernel of that channel andbi is
a bias term. In other words, the convolution operation being performed for each feature map is the sum of the application ofkdifferent 2D squared convolution fea-tures plus a bias term. Hence, In comparison with tra-ditional image feature extraction that relies on crafted general feature extractors (SIFT, Gabor filter, etc), the power of CNN is noted in its ability to learn the weights and biases of different feature maps which lead to task specific powerful feature extractors.
Moreover, Rectified nonlinear activation function (ReLU) is performed after every convolution. ReLU is a very popular activation function which is defined as f(x) =max(0,x)wherexis the input to a neuron. areIts role is to introduce nonlinearity to the CNN.
Max-pooling map:In the architecture of convolutional neural networks, convolution layers are followed by subsampling layers. A layer of sub-sampling reduces the size of the convolution maps, and introduces invari-ance to (low) rotations and translations that can appear in the input. A layer of max-pooling is a variant of such layer that has shown different benefits in its use. The output of max-pooling layer is given by the maximum activation value in the input layer over sub windows within each feature map. The max-pooling operation reduce the size of the feature map.
4.2
Classification model
Within the classification step we use fully connected layers where each neuron provides a full connection to all learned feature maps issued from the previous layer in the convolution neural network. These connected layers are based on the softmax activation function in order to compute the class scores. The input of the soft-max classifier is a vector of features resulting from the learning process and the output is a probability that an image belongs to a given class. The softmax function ςtakes as input a C-dimensional vectorzand outputs a C-dimensional vectoryof real values between 0 and 1. This function is calculated as below:
yc=ς(z)c=
ezc ∑Cd=1ezd
f or c=1,· · ·,C (2) In the next section, we will present the conducted ex-periments and results.
5
EXPERIMENTS
In this section, we evaluate the proposed method on our collected dataset for image chart classification. Exper-iments were conducted on an Intel Xeon CPU E5 PC with 32 GB of RAM. In our implementation we used deeplearning4j the open source deep learning library in Java. We start by describing the dataset then we present the performance of our approach before comparing ob-tained results to relevant proposed method from the lit-erature.
5.1
Datasets
We have collected our data set from images presented in biodiversity publications. We have downloaded all available volumes and issues using a Python script from seven different biodiversity journals. This resulted in 26588 publications downloaded, out of which we were able to extract 96837 images. This corpus of 96837 im-ages have mixed content. The majority of the imim-ages are related to data visualization and the rest are general images such as camera clicked pictures, conceptual di-agrams and flowcharts.
To annotate our dataset we have used the Viper GT tool which is a Java based Ground Truth Software. This tool allows the user to mark up a media file (image file in our case) with the information about its content. This infor-mation is then stored in an xml format. So each image has a respective xml file defining the class label of the marked content in the image file.
5.1.1
Annotation Process
In the beginning, we were not aware of different chart types available in the collected dataset. Hence, we created the classes as they appeared in the images and have labeled them. Following this procedure, we ended
up with 51 different classes from 1000 images. There was a huge variation in the samples’ count per class. To solve this problem of unequal class distribution and to gather more training data, we did another round of annotation. This time, we preselected 11 different classes to annotate this dataset. Then, we had randomly selected 3377 images for our training dataset.
These 11 classes or superclasses were derived accord-ing to two important criteria that we have observed from our previous annotation phase: count of images per class and visualization shape similarity. Classes or chart types which are associated with a significant amount of images like Ordination Scatterplot, Map and Line Chart were retained. However, those who had less than 5 images were excluded from further processing unless they have a visual shape similarity to other re-tained classes. Hence, chart types that use the same coordinate space (e.g. xy plot) and same visual marks (e.g. bars) can be considered visually similar and then merged into one super class. For example, all the chart types which are visually similar to Column Chart e.g. Bar Chart, Stacked Bar Chart, Muli-set Bar Chart and Dual Axis Bar Chart are all merged into one super class as ’Column Chart’. Besides, to increase the number of images per class, we have included additional im-ages for classes whose count was less than 200. These images were gathered from the dataset provided by [Savv 11] and from the Internet. In Table 2, we have presented our final training set count for each class.
5.2
Results
To validate the performance of the proposed approach, we conducted a set of experiments using our collected and annotated dataset containing 3377 images. Our goal is to evaluate the predictive performance of our model on unseen data of chart images. Hence, in our experiments, 80% of the annotated dataset is used for training and the rest 20 % is used for testing with the use of hyper parameters described in Table 3. These parameters are determined empirically according to a series of experiments carried on the whole dataset that give the best results of classification.
As shown in Table 3, the stochastic gradient descent (SGD) algorithm is used in our model to learn the best set of weights and biases of the neural network that minimize the loss function. While learning, the SGD algorithm works by randomly choosing a small num-ber of training inputs. We refer to this as the batch size which is set to 10. The learning rate is set to 0.001. It is the rate at which a function move through the search space. A small learning rate leads to more precise re-sults but it requires more training time. The momentum is an additional factor to determine how fast the SGD algorithm converges on the optimum point. It is set to
Ordination Scatterplot Map Scatter plot Line Chart Dendrogram Column Chart Heat map Box plot Area Chart Pie Chart Node Link Diagram 279 468 420 412 243 476 214 203 212 245 205
Table 2: Annotated dataset count
Parameter Optimization algorithm Learning rate Momentum Weight decay Batch size Activation function Iterations
value SGD 0.001 0.9 0.005 10 Sigmoid 80
Table 3: Hyper parameters choices
0.9.
Also, the effectiveness of our system is evaluated using accuracy, precision, recall and F1-measure. They are defined as follows: Precision= T P T P+FP (3) Recall= T P T P+FN (4) F1−measure=2. P.R P+R (5) Accuracy= T P+T N T P+T N+FP+FN (6) Where TN(True Negative) denotes the case of a neg-ative sample being predicted negneg-ative (e.g., a non-line chart image being classified into the complement class of line chart correctly);TP(True Positive) refers to the case a positive sample being predicted positive (e.g., a line chart image being classified into the class of line chart correctly);FN(False Negative) refers to the case that a positive sample being predicted negative (e.g., a line chart image being classified into the complement class of line chart incorrectly);FP(False Positive) de-notes the case that a negative sample being predicted positive (e.g., a non- line chart leaf image being classi-fied into the class of line chart incorrectly);Prefers to precision andRrefers to recall.
The experimental results of the proposed method are summarized in Table 4 and Figure 2 .
As shown in Table 4, our model has achieved better performance than LeNet which is expected since our model is deeper (has more layers).
Many approaches in the literature return to pre-trained networks to effectively classify their small data. This pre-trained network will learn common useful features from a large dataset such as the ImageNet dataset and then fine-tune it (re-train it) on another dataset with a very small weight updates.
Model Precision Accuracy Recall F1-measure LeNet [LeCu 89] 0,885 0,795 0,765 0,821 Pretrained LeNet 0,822 0,409 0,372 0,512 Our Model 0,906 0,895 0,893 0,902
Table 4: Comparison with existing models
However, as can be noticed in Table 4, pre-trained model was not able to provide good results in our case.
This could be because of the big differences between natural images contained in the ImageNet dataset and the chart images in our dataset which lead to the low performance of the model.
Figure 2: Obtained recall and precision per class
The performance per class is presented in Figure 2. These scores show that our method produces good re-call (R) and precision (P) rates.
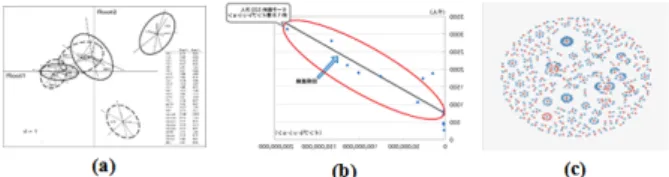
Our method performs well on heterogenous data in terms of color and monochrome images and considers challenging conditions like orientation and scale. How-ever, we think that the lowest recall rates in all our ex-periments is due to similarity beteween the visual ap-peareance of chart images within some classes. This is the case for example of Ordination scatter plot that can easily be confused with Node link Diagram and Scatter plot which consequently affect the recall rate of these three classes. Figure 3 illustrates such similarity in vi-sual appearance.
Figure 3: Illustration of confusing chart images (a) or-dination scatterplot,(b) Scatterplot, (c) Node link Dia-gram
Consequently, the confusion in the learning process is mainly caused by the similar visual appearance of im-ages belonging to different classes. In fact, reducing the size of each input image within the step of normaliza-tion and subsampling makes it hard to find and extract discriminating features from each image classes.
6
CONCLUSION
The focus of this paper is on the classification of chart images contained in scientific publications especially in the biodiversity research. This work is motivated by the importance of automatically classifying the chart type as an aid in the development of domain knowledge base that can further assist in the visualization recommenda-tion as well as for chart analysis and redesign.
The proposed approach is based on convolution neu-ral networks for chart image classification. We have collected 96837 chart images from scientific publica-tions and have annotated 3377 images according to 11 classes (Categorical Boxplot, Column Chart, Den-drogram, Heatmap, Line Chart, Map, Node-Link dia-gram, Ordination Scatterplot, Pie Chart, Scatterplot and Stacked Area Chart). Although the challenging condi-tions of low resolution, dissimilarity, variation in size, color (binary and colored images) and low variance be-tween graphics, the experimental results demonstrate the efficiency of our proposed method.
As future direction, we will focus on the segmenta-tion of each type of chart image and extract informa-tive clues as textual information, shape and area distri-bution and then provide support for chart redesign and interpretation. Furthermore we will work on multiple type of graphics since they are commonly included in scientific publications.
7
ACKNOWLEDGMENTS
We are grateful to Birgitta König-Ries for her discus-sions and her technical support. A part of this research was supported by the DAAD funding through the Bio-Dialog project. This work is partly funded by the DFG Priority Program 1374 "Biodiversity-Exploratories" (KO 2209 / 12-2).
8
REFERENCES
[Arel 10] I. Arel, D. C. Rose, and T. P. Karnowski. “Deep machine learning-a new frontier in artificial intelligence research [research frontier]”. IEEE Computational Intelli-gence Magazine, Vol. 5, No. 4, pp. 13–18, 2010.
[Deng 14] L. Deng. “A tutorial survey of architectures, algorithms, and applications for deep learn-ing”. APSIPA Transactions on Signal and Information Processing, Vol. 3, p. e2, 2014. [Huan 07] W. Huang and C. L. Tan. “A system for
understanding imaged infographics and its applications”. In:Proceedings of the 2007 ACM symposium on Document engineering, pp. 9–18, ACM, 2007.
[Inok 00] A. Inokuchi, T. Washio, and H. Motoda. “An apriori-based algorithm for mining fre-quent substructures from graph data”. In: European Conference on Principles of Data Mining and Knowledge Discovery, pp. 13– 23, Springer, 2000.
[Kart 12] V. Karthikeyani and S. Nagarajan. “Ma-chine learning classification algorithms to recognize chart types in portable document format (pdf) files”. International Journal of Computer Applications, Vol. 39, No. 2, 2012.
[LeCu 89] Y. LeCun, B. Boser, J. S. Denker, D. Hen-derson, R. E. Howard, W. Hubbard, and L. D. Jackel. “Backpropagation applied to handwritten zip code recognition”. Neural computation, Vol. 1, No. 4, pp. 541–551, 1989.
[Lee 15] P.-S. Lee and B. Howe. “Dismantling Com-posite Visualizations in the Scientific Liter-ature”. In:Proceedings of the International Conference on Pattern Recognition Appli-cations and Methods - Volume 2, pp. 79–91, SCITEPRESS - Science and Technology Publications, Lda, 2015.
[Pras 07] V. S. N. Prasad, B. Siddiquie, J. Golbeck, and L. S. Davis. “Classifying computer gen-erated charts”. In:Content-Based Multime-dia Indexing, 2007. CBMI’07. International Workshop on, pp. 85–92, IEEE, 2007. [Savv 11] M. Savva, N. Kong, A. Chhajta, L.
Fei-Fei, M. Agrawala, and J. Heer. “Revision: Automated classification, analysis and re-design of chart images”. In:Proceedings of the 24th annual ACM symposium on User interface software and technology, pp. 393– 402, ACM, 2011.
[Shao 05] M. Shao and R. P. Futrelle. “Recogni-tion and classifica“Recogni-tion of figures in PDF documents”. In: International Workshop on Graphics Recognition, pp. 231–242, Springer, 2005.
[Yoko 97] N. Yokokura and T. Watanabe. “Layout-Based Approach for extracting construc-tive elements of bar-charts”. In: Interna-tional Workshop on Graphics Recognition, pp. 163–174, Springer, 1997.
[Zhou 01] Y. Zhou and C. L. Tan. “Learning-based sci-entific chart recognition”. In:4th IAPR In-ternational Workshop on Graphics Recog-nition, GREC, pp. 482–492, Citeseer, 2001.