UNIVERSITY OF OKLAHOMA GRADUATE COLLEGE
AN EMPIRICAL EXAMINATION OF NYSE LIQUIDITY COMMONALITY, DECIMALIZATION, AND MARKET MICROSTRUCTURE EFFECTS WITHIN A
CONDITIONAL PRICE DURATION FRAMEWORK
A Dissertation
SUBMITTED TO THE GRADUATE FACULTY in partial fulfillment of the requirements for the
degree of Doctor of Philosophy By NIKOLAY KOSTUROV Norman, Oklahoma 2004
UMI Number: 3134387
________________________________________________________ UMI Microform 3134387
Copyright 2003by ProQuest Information and Learning Company. All rights reserved. This microform edition is protected against
unauthorized copying under Title 17, United States Code.
____________________________________________________________
ProQuest Information and Learning Company 300 North Zeeb Road
PO Box 1346 Ann Arbor, MI 48106-1346
AN EMPIRICAL EXAMINATION OF NYSE LIQUIDITY COMMONALITY, DECIMALIZATION, AND MARKET MICROSTRUCTURE EFFECTS WITHIN A
CONDITIONAL PRICE DURATION FRAMEWORK A Dissertation APPROVED FOR THE
MICHAEL F. PRICE COLLEGE OF BUSINESS ( FINANCE)
BY
___________________________
Dr. Scott Linn (advisor)
___________________________ Dr. Louis Ederington ___________________________ Dr. Chitru Fernando ___________________________ Dr. Duane Stock ___________________________ Dr. Kevin Grier
© Copyright by NIKOLAY KOSTUROV 2004 All Rights Reserved.
Table of Contents
1. Introduction... 1
2. Relevant Literature and Research Outline... 8
2.1. Market Microstructure... 9
2.1.1 Models of the Bid-Ask Spread... 9
2.1.1.1. Inventory Models... 10
2.1.1.2. Asymmetric Information Models... 12
2.1.1.3. Time between Trades and Information... 15
2.1.1.4. Empirical Evidence... 16
2.1.2. Price Effects Associated with Trading and Depth... 18
2.1.2.1. Net Order Imbalances and Price Changes... 21
2.1.3. Plan of Study... 22
2.2. Market Protocol Change: Decimalization at the NYSE... 23
2.2.1. Market Protocols... 23
2.2.2. Decimalization and the Tick Size... 25
2.2.3. Literature on the Effects of Decimalization... 26
2.2.4. Plan of Study... 29
2.3. Liquidity and Commonality in Liquidity... 30
2.3.1. Overview and Literature on Liquidity... 30
2.3.2. Liquidity Commonality... 33
2.3.2.1. Empirical Evidence on Commonality in Liquidity... 34
2.3.3. Plan of Study... 39
3. Methodology – Price Duration and the ACD Framework... 41
3.1. Duration Models... 43
3.2. Autoregressive Conditional Duration Models... 47
3.2.1. Extensions of the Standard ACD Model... 57
3.2.1.1. The Log-ACD Model... 57
3.2.1.2. Other Extensions... 59
4. Data Description and Transformations... 60
4.1. Net Directional Volume (VNET)... 62
5. Data and Sample Construction... 65
5.1. Construction of Price Series, Durations, and Associated Marks... 68
6. Testable Hypotheses - Empirical Specifications... 71
6.1. Empirical Tests of Microstructure Hypotheses... 71
6.1.1. Exogenous Variables... 71
6.1.1.1. Specification of the ACD Model... 72
6.1.2. Models Explaining Net Directional Volume: VNET... 76
6.1.2.1. Specification of the VNET Model... 76
6.2. Empirical Tests for Decimalization Effects... 78
6.3. Empirical Tests for Commonality in Liquidity... 81
7. Results... 85
7.1.1. Duration Calculations... 85
7.1.2. Marks Calculation... 86
7.2. ACD Models... 88
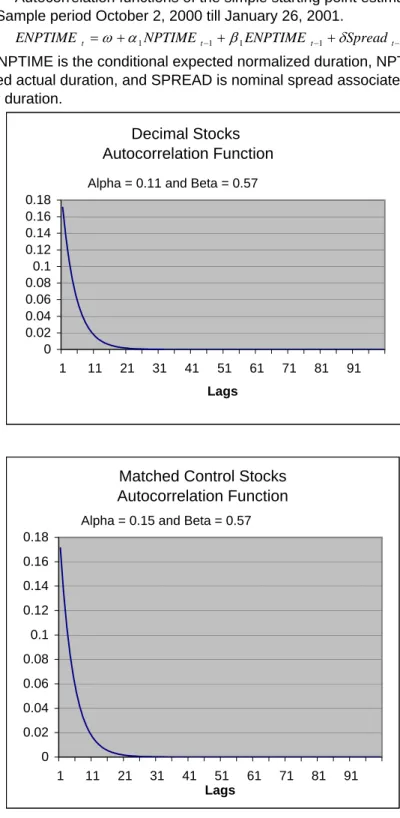
7.2.1. Results for a Simple Model... 89
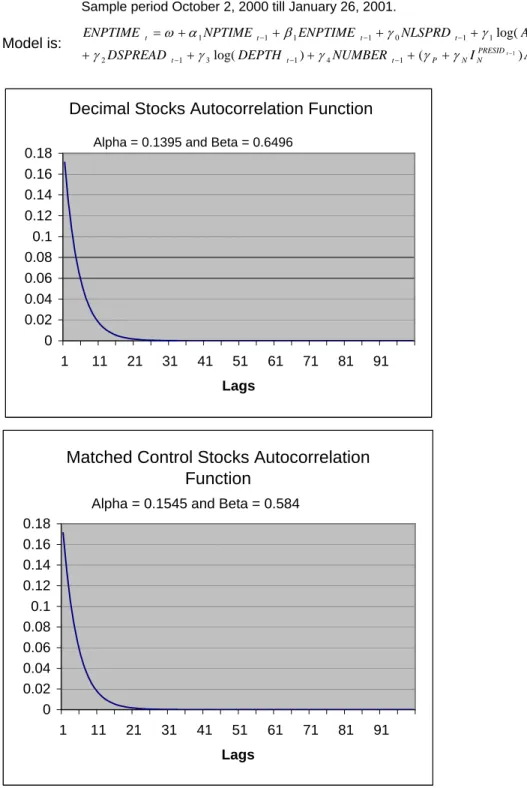
7.2.2. Complete Model Specification... 91
7.2.2.1. Criteria for Cross Model Comparison... 92
7.2.2.2. Cross-Model Comparisons... 94
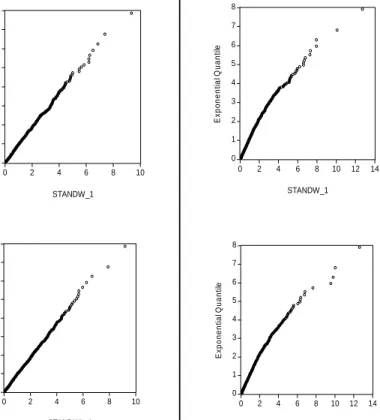
7.2.2.2.1. Error Distribution Tests... 94
7.2.2.2.2. Autocorrelation Results... 97
7.2.3. ACD Results... 98
7.2.3.1. Tests of Microstructure Hypotheses... 98
7.2.3.2. Decimal vs. Control Stock Coefficients... 102
7.2.3.2.1. Initial Tests for between Group Coefficient Equality... 102
7.2.3.2.2. Pooled Regression Tests... 103
7.3. VNET Based Model of Realized Market Depth... 107
7.3.1. VNET Model Individual Stock Regression Results... 109
7.3.2. Pooled Regression results... 112
7.3.3. Decimal vs. Control Stock Coefficients... 113
7.3.3.1. Individual stock regressions... 113
7.3.3.2. Pooled Regressions... 116
7.4. Commonality in Liquidity... 121
7.4.1. Liquidity Variable Choice and Data Aggregation... 123
7.4.2. Common Factor Analysis... 124
7.4.3. Principal Components and ML Factor Analysis Results... 126
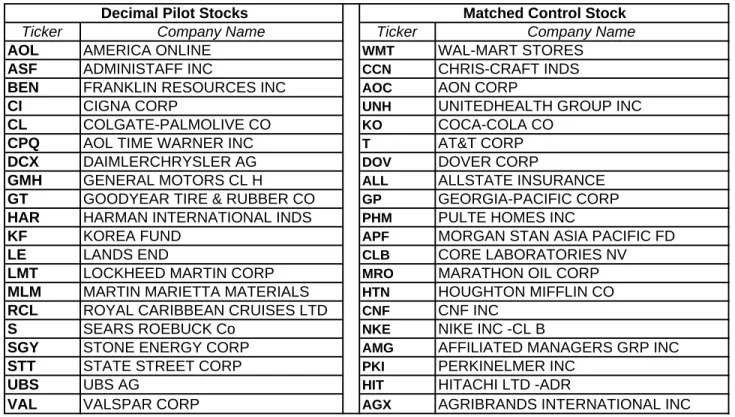
7.4.3.1. Pilot Stocks vs. Control Stocks... 128
1. Introduction
The study of capital markets at the level of the transaction, commonly referred to as the study of market microstructure, is generally concerned with (Madhavan, 2000): a) price formation and price discovery, b) market structure and design, and c) the implications of information and disclosure for trading and the price process.i Price volatility and liquidity often surface as central themes in empirical as well as theoretical research in the area1 because these characteristics impact directly or indirectly all aspects of financial science and financial decision-making, including models of asset prices, and thus the cost of capital. As such, understanding how the microstructure of markets empirically influences volatility and liquidity is an
important line of inquiry. This study is an empirical examination of the determinants and behavior of price volatility and liquidity utilizing a unique measurement process that preserves the information inherent in transaction prices.
A thorough understanding of the determinants and behavior of volatility and liquidity and how they are interconnected, requires that empirical analysis be carried out at the level of the transaction. Most studies of these characteristics of security prices however have traditionally relied on data measured over arbitrarily chosen fixed time intervals not at the transaction level2. Fixed interval data by its nature
1 For example, Roll (1984), Hasbrouck (1991), Stoll (1989), Kyle (1985), Glosten and Milgrom
(1985), Easley, Keifer, O’Hara, and Paperman (1996), Foster and Viswanathan (1995), Lee, Mucklow, and Ready (1993), Goldstein and Kavajecz (2000) Jones and Lipson (2001), Chordia, Roll, and Subrahmanyam (2002), and Kaul, and Lipson (1994).
2 For example, Chordia, Roll, and Subrahmanyam (2000), Hasbrouck and Seppi (2001), Harford and
kaul (2004), Foster and Viswanathan (1990), Harris (1986), Wood, McInish and Ord (1985), Lee, Mucklow, and Ready (1993), Bessembinder (2003) Goldstein and Kavajecz (2000), Hasbrouck and Sofianos (1993), and Jones and Lipson (2001).
masks critical aspects of the true underlying irregularly spaced transaction series. Further, fixed interval data also tends to create artificial behavior that may not be reflective of the underlying dynamics of transaction price series, such as unknown heteroskedasticity and artificial autocorrelation3. Finally, extant theory is in fact a theory of transactions. Drawing inferences about theories based upon transactions from tests based on fixed interval data may lead to unknown biases in conclusions. This study circumvents the problem by working with a metric that preserves the information inherent in the actual irregularly spaced transaction series. The metric is commonly referred to as ‘Price Duration’4.
This study is divided into three parts, each addressing a particular question involving price volatility and liquidity. I first focus on the determinants of volatility and liquidity. I then investigate how a change in market design, the shift by the NYSE to a decimalization pricing protocol, influenced the relation between the determinants of volatility and liquidity and those measures. I finish with an analysis of the recently conjectured hypothesis that there are common factors which influence the liquidity of financial securities. That analysis focuses on whether such common influences can be said to exist once one controls for the theoretical determinants of liquidity. The common thread tying these three parts together is the use of intra-day price duration as a reflection of the transaction process.
Price durations are defined as the time between successive price changes. They can be interpreted as the time it takes for the price to move up or down by a
3 Engle and Lange (2001), Lo and MacKinlay (1988). 4 As used by Engle and Lange (2001).
fixed increment. Durations are an appealing alternative to modeling price dynamics using a fixed-interval time series because they preserve the fundamental
characteristics of irregularly spaced transaction data. Further, as shown later, a unique feature of a price duration is that it also provides a measure of the inverse of realized price volatility. Price durations therefore allow direct tests of the determinants of volatility that preserve the inherent informational richness of the data. In addition models of the dynamics of price duration allow the computation of a measure of expected volatility, a predicted determinant of liquidity. By approaching the price formation process from the direction of price duration I am able to preserve information about the underlying transaction process that is lost using time series price data that is based upon a fixed interval.
I formulate and test microstructure hypotheses about volatility and liquidity utilizing a general model of the dynamics of price duration that accounts for
conditional autocorrelation effects, namely an Autoregressive Conditional Duration (ACD) model5. The first part of this study involves an investigation of the dynamics of price duration for a sample of NYSE stocks. Because a price duration can be shown to measure the inverse of volatility, the models and tests constitute an analysis of the determinants and behavior of volatility. Thus, the first part of this study
initially focuses on the microstructure of price formation and specifically on volatility. I also investigate the determinants and behavior of liquidity. Expected
volatility is predicted to influence liquidity by numerous extant theories6. The dynamic model of price duration allows me to compute expected volatility thus also allowing me to estimate its relation to liquidity. Another unique feature of this study is the definition and analysis of a direct measure of liquidity, the signed order imbalance, in contrast to measures such as volume which only indirectly measure liquidity and by their nature mask the true underlying fundamental. The second part of the study deals with market structure and design issues. The specific focus is on the impact of the recent NYSE decimalization upon the dynamics of volatility and
liquidity. I examine in detail how the dynamic models of volatility and liquidity were influenced by this shift in market design (protocol). The third part of the study deals again with price formation but focuses on the recent conjecture that liquidity of securities is influenced by a set of common factors. I investigate whether common influences are present in the raw data, but more importantly whether common influences are present once controls for variables predicted to influence liquidity.
This is the first study to present a thorough set of tests of the determinants of volatility and liquidity using price duration as the underlying metric. In addition it is the first study to utilize such models to investigate the effects of a market protocol change, in this case the switch to a decimalization pricing system by the NYSE. Finally, this is the first study to examine the issue of commonality in liquidity using both an informational rich measure of liquidity, signed order imbalances, but also a measure of liquidity that controls for its underlying determinants. One such
6 Virtually all information asymmetry microstructure works like Kyle (1985), Easley and O;Hara
determinant being expected volatility, which itself is computed from a price duration model that also preserves the informational richness of the transaction price series. The study presents an alternative empirical estimation framework to the works of Hasbrouck and Seppi (2001) and Chordia, Roll, and Subrahmanyam (2000) which are both rooted in fixed-interval data and which do not directly control for other
determinants at the microstructure level.
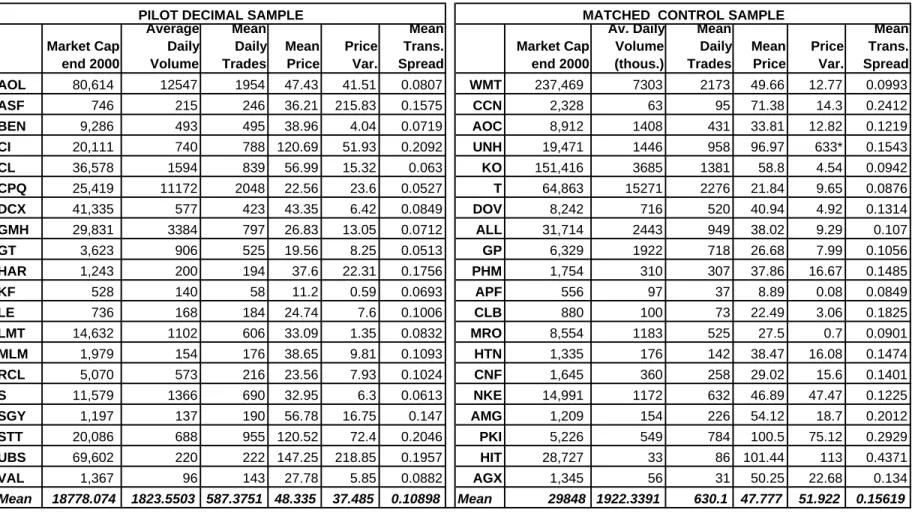
This study uses intra-day transaction data for a sample of NYSE stocks to construct realized price durations, defined as the lengths of time between successive price changes of at least a pre-defined threshold size. The data are for the period October 2, 2000 till May 31, 2001, and are drawn from the NYSE TAQ data set. Associated with each such duration, I isolate relevant concurrent or cumulated transaction characteristics such as the bid-ask spread, quoted depth, etc., called duration marks. These data are also drawn from the TAQ data set. Price durations have the unique feature that they are always non-negative. The dynamics of price duration are modeled using a modified Autoregressive Conditional Duration (ACD) specification7 which directly accounts for the non-negative characteristic. The model
is extremely well suited for analyzing high frequency data exhibiting volatility clusters, autoregressive effects, and occurring at irregularly spaced intervals because it circumvents the price discreteness bias and bid-ask bounce problems of fixed-period time series models. Rather, it is a dynamic model of the event time segregation
of real price/information events between successive price deteriorations8. The approach also helps avoid the well-documented problem of spurious serial cross-autocorrelation associated with fixed-interval returns arising from non-trading period time-deformations (Lo and MacKinlay 1988). In addition, the duration construct processes the irregularly-spaced time series data without introducing the inevitable heteroskedasticity problems associated with a standard fixed-interval time series approach (Engle and Russell, 1998).
My results can be summarized as follows. I find that conditional volatility is largely determined by the interaction of past volatility, lagged (change in) nominal spread, and the lags of transaction intensity, quoted depth and absolute price change. The finding is consistent with the predictions of information asymmetry
microstructure theories of Roll (1984), Kyle (1985), Glosten and Milgrom (1985), Bagehot (1971), Easley and O’Hara (1987)9. I find that liquidity, measured as signed order imbalances is determined by conditional volatility and other information asymmetry proxies like lagged spread, volume, number of transactions, and absolute price change, consistent with the predictions of Kyle (1985), Glosten and Milgrom (1985), Chordia, Roll, and Subrahmanyam (2001), and Lee, Mucklow and Ready (1993). The results indicate that the change in market design, the shift by the NYSE to a decimalization pricing scheme, affected the dynamics of mid-quote price formation and price revision. There is evidence conditional volatility fell following
8 Similar to the constructs initially proposed in Cho and Frees (1998).
9 Also Hasbrouck (1991), Stoll (1989), Blume, Easley, and O’Hara (1994)., Easley, Keifer, O’Hara,
and Paperman (1996), Hasbrouck (1988), Foster and Viswanathan (1995), Easley and O’Hara (1992), and Jones, Kaul, and Lipson (1994).
the switch to decimalization, consistent with the findings of Bessembinder (2003) and in agreement with the argument made by decimalization proponents that a refinement in the pricing grid would lead to more continuous, correct and less volatile pricing. In addition, decimalization exerted a negative impact on liquidity, as measured by the dynamics of the realized market depth formation process, consistent with the conclusions in Harris (1991, 1994), Grossman and Miller (1998), and Seppi (1997). Finally, the results on tests for commonality confirm the findings in Hasbrouck and Seppi (2001) and Chordia, Roll and Subrahmanyam (2000) of a single latent factor explaining about 15% of liquidity co-variation. The commonality evidence disappears however after controlling for the effects of conditional volatility and microstructure variables. I conclude from these tests, that the documented commonality in liquidity is generated by the underlying fundamental process of liquidity formation, including the subsumed microstructural co-formation of volatility and price.
The study begins with a review of the relevant literature. A description of ACD methodology, models, and variations pertinent to each of the three issues is then presented. The data are then described, as well as filters and algorithms for handling intraday transactions. I then formulate and test different microstructure hypotheses for each of the three issues addressed, and describe the results. The final section provides concluding remarks.
2. Relevant Literature and Research Outline
Until recently, empirical studies were limited by the scarcity and limitations of transactions data. New and much more detailed transaction databases have, however become available in recent years. Researchers now have the opportunity to access the whole universe of transactions data, as databases exist which record every transaction and its related characteristics. With the advent of intra-day transaction datasets, testing theoretical models of the workings of capital markets and the price formation process have become feasible. Extant literature has focused largely on the cost of immediacy and transaction services, and the impact of that cost on the short run behavior of security prices10. That particular area of research constitutes the field of “market microstructure”.
Market microstructure is primarily concerned with the market for transaction services, and the implications for prices. Whereas asset pricing models usually
assume frictionless capital markets, market microstructure deals with the trading costs and frictions characterizing actual financial markets. In addition, microstructure theory is closely linked to the economic implications of information, since trading costs are very closely related to the information in traders’ possession. In particular, microstructure models focus on the structural and informational frictions causing an asset’s price to diverge from its full-information expectation.
2.1. Market Microstructure
Liquidity (defined as the ability to ‘trade large size quickly, at low cost, when you want to trade’11) is determined by the interaction of two primary fundamentals, the bid-ask spread and market depth.
2.1.1 Models of the Bid-Ask Spread
The formation and components of the bid-ask spread, as well as how and why it differs across securities has been in the focus of considerable research12.
Accounting for the bulk of trading costs and measuring one major dimension of liquidity, the bid-ask spread is defined as the difference between what buyers must pay and what sellers receive if they post active, market orders and trade through a centralized system or a market maker. The literature has identified several
components of the bid-ask spread, the most important of which are: order handling costs13, non competitive pricing14, inventory risk15, the option effect16, and
asymmetric information17. As Stoll (2002) explains, these factors are not independent. Inventory risk, the option effect, and asymmetric information are all related to
uncertainty. Inventory risk arises from the release of unanticipated public information after inventory is acquired; the option effect arises from public information releases
11 Harris, (2003).
12 For an excellent review of market microstructure literature, see O’hara (1995), Stoll (2002), and
Harris (2003).
13 Demsetz (1968), etc..
14 Garman (1976) and Amihud and Mendelson (1980), atc. 15 Smidt (1971), Stoll (1978).
16 The option effect was developed by Copeland and Galai (1983). 17 Originated by Bagehot (1971), Black (1986.)
before the trade; the adverse selection component results from private information held by informed traders before the trade. The order handling component of the spread is basically compensation for the services and resources market makers expend. I now turn to a brief review of how the bid-ask spread is influenced by the inventory and information effects.
2.1.1.1. Inventory Models
The study of market microstructure arose as an alternative to classical frictionless Walrasian models of trading behavior. Frictionless models work fine under perfect competition and free entry assumptions. Central to the study of market microstructure however, is the functioning of market makers as agents that provide liquidity and price continuity, and promote price stability.
Early research modeled the market maker’s behavior as a supplier of
“predictive immediacy,” the bid-ask spread being his return18. Early work explained the bid-ask spread through trading volume, the stock’s risk level, price, and firm size. For instance Garman (1976) and Amihud and Mendelson (1980) consider a single monopolistic market maker, with the bid-ask spread arising as compensation for the likelihood of bankruptcy or failure to provide liquidity.
These static models have limited ability to “explain variation in bid-ask spread as a part of intraday price dynamics” (Madhavan, 2000, page 9.) Since dealers must maintain an inventory in order to ensure a smooth trading process and price
continuity, their holdings will be affected by past transactions and expectations about future order flow. Order flow and hence inventory level is uncertain however, so a component of the bid-ask spread dealers charge will likely be compensation for assumed inventory risk (for risk-averse dealers.) Smidt (1971) introduced the first model that explained a dealer’s spread dynamics as a function of his inventory position. Considering inventory carrying costs and constrained dealer capital, the dealer’s situation can be described using the Gambler’s Ruin Problem. Basically, the dealer adjusts both spreads and prices to avoid ruin. In a more contemporary model, Madhavan and Smidt (1993), dealers set bid and ask prices to maximize the present expected value of trading revenue minus inventory storage costs as time goes to infinity. In their model, order imbalances lead to quote revisions, and market makers quote prices that induce mean reversion in inventories.
Another set of inventory models are based on the risks associated with holding inventory, namely potential price deterioration. For example, a market maker who buys at the bid price is prone to inventory risk if there is a chance the price will drop before the inventory has been moved19. Stoll (1978) shows the optimal bid-ask spread
depends positively on the dealer’s risk aversion, the stock return’s variance and quoted depth, and negatively on the dealer’s wealth. Stoll’s model also predicts that after a sale at the bid, the dealer lowers both the bid and ask quote, and after a purchase at the ask, both the bid and the ask quotes are raised20.
19 Theoretical models of inventory risk include Garman (1976), Stoll (1978), Amihud and Mendelson
(1980), Ho and Stoll (1981, 1983), and Spiegel and Subrahmanyam (1995.)
20 The model was subsequently extended to a multi-period framework and improved by Ho and Stoll
2.1.1.2. Asymmetric Information Models
Jack Treynor (1971), (publishing under the pseudonym Walter Bagehot) suggested a distinction between traders based on the information they possess. One group of traders had no private information and traded only for liquidity purposes, and to execute portfolio rebalancing. Treynor labels these liquidity, or “noise” traders21. The other group of investors is comprised of traders possessing some private information; these informed investors sell at the bid if they have information justifying a lower price, and buy at the ask if the full information price level is above the current price. In Treynor’s model, the market maker and individuals who place limit orders lose in transactions with informed traders, because the informed traders can not be identified. Similarly, market makers gain from trades with liquidity traders, generally ensuring they survive and ensuring a structure in which continuous limit order posts are possible. Uninformed traders always lose to informed traders, regardless of whether they use market or limit orders. Uninformed traders end up regretting their trading or not-trading if they submit limit orders, and will lose half the spread to informed investors if they submit market orders (Harris, 2003). They can only avoid the losses by choosing not to trade. The important result of the model is that the bid-ask spread the market maker sets will contain an information component because of the possibility the market maker will be exploited by informed traders.
Kyle (1985) models the informational content of order flow in the presence of a single monopolistic informed trader and many uninformed traders. The informed
investor knows the distribution of the exogenous uninformed order flow and
considers the price impact of her trading. The auctioneer determines the clearing price based on aggregate order flow. The model is initially a one-shot auction similar to the NYSE opening, and is subsequently extended to the limiting case of a continuous auction. In the one-shot auction setting, the market clearing price is:
) ~ ~ ( ~ 0 x u p p= +λ + , [ 2.1]
where p0is the price before the auction, and ~ and x u~ are the order flow of the
informed and uninformed traders respectively. Lambda is the price impact coefficient of total order flow, generally referred to as Kyle’s Lambda,
2 1 2 2 2 ⎥ ⎥ ⎦ ⎤ ⎢ ⎢ ⎣ ⎡ = u p Lambda σ σ , [2.2]
where is the variance of the asset price, and is the variance of the exogenous uninformed order flow. The market clearing price is positively related to the variance of the asset price, and negatively related to the variance of the
uninformed order flow because the informed investor finds it harder to camouflage her trade in a uniform, low variance, uninformed trading environment.
2 p
σ 2
u σ
In the continuous auction setting, assuming only market orders, Kyle models the market maker’s price setting behavior as a function of the net order flow. The resulting security price is set at its expected value, given the particular order flow, and net order imbalance. In the resulting rational expectations equilibrium, prices end up gradually incorporating all private information, and the market maker sets prices to
clear the market. If the market maker tries to behave strategically and infers the probability of being faced with an informed trader (say he expects large trades to come from informed traders,) then equilibrium might not be reached. Market depth, defined as the size of a trade that can be arranged at a given cost22, is proportional to the amount of noise trading, and inversely proportional to the amount of private information. In a continuous auction setting, the depth of the market and the volatility of prices are constant.
To summarize, Kyle presents a model which quantifies the intuition of Bagehot, and shows that price innovations can be modeled as functions of quantities traded, consistent with modeling price changes as consequences of new information. As Harris (2003) points out, the adverse selection component of the bid-ask spread in this type of model arises as compensation for market maker losses to informed investors. Alternatively, Glosten and Milgrom (1985) derive the adverse selection component of the bid-ask spread from the market maker learning about the true value of the security conditional on the direction of the next trade and the
probability of facing an informed trader. As Harris (2003) proves, using the so-called Glosten-Milgrom Theorem, these two perspectives lead to identical conclusions about the size of the adverse selection spread component23.
22 Harris, (2003).
2.1.1.3. Time between Trades and Information
Easley and O’Hara (1992), in an important extension of the above models, study the role of time in price adjustment24. The authors relax the assumption that time is exogenous in the model. Instead, they argue the time (duration) between trades will convey information. A long duration, i.e. a prolonged period without a trade is interpreted as a lack of new information arrival. The probability of being faced with an informed trader is thus small, and therefore the market maker will adjust the bid-ask spread downward. Furthermore, the authors argue that any
empirical investigation of transaction data ignoring the timing of transactions will be biased, because it will ignore the information content of the non-trading intervals. More importantly, the sequences of price changes and volumes are major factors in the market maker’s information set. Market makers’ quotes as hypothesized by the model will converge to their strong form efficient market values, because quotes will be revised at a rate increasing in the fraction of informed trades, approximated by trading intensity. The quantification of price durations will permit a direct test of Easley and O’Hara’s predictions.
Such refined asymmetric information models predict that information is conveyed through trading, and therefore, trading affects prices and returns, because this is how information is impounded into prices. In the model, absence of trading would mean no news. Diamond and Verrechia (1987) in contrast, conclude an
24
Easley and O’Hara (1991, 1992) and Easley, Keifer, and O’Hara (1997) all present extended models dealing with dynamic informational efficiency, and the effect of sequential information arrival upon the model described above.
absence of trades indicates bad news which informed investors can not capitalize on, due to short sale constraints.
Admati and Pfleiderer (1988) allow for two types of liquidity traders: discretionary and non-discretionary. The former trade a number of shares at a particular time, while the latter can strategically choose an optimal trading period. They show that discretionary traders will choose to trade when there is no
information event, and trading activity will be unrelated to information. Absence of trades would then be characteristic of informed trading and long durations.
Holden and Subrahmanyam (1992) incorporate competition among informed traders into Kyle’s model. They allow for multiple informed investors, each trying to profit from a fleeting informational advantage. The model predicts higher trading volume, faster private information revelation, short times between trades, and faster convergence to the security’s true market value. In other words, markets become more efficient when competition is allowed, even in the presence of informed traders.
2.1.1.4. Empirical Evidence
Numerous empirical studies have provided at least limited support for the importance of heterogeneous information and trading activity on the bid-ask spread. Chordia, Roll, and Subrahmanyam (2001) find that spreads sharply increase in down markets and weakly decrease in up markets, constituting an asymmetric response of spread to market movements. Easley, Keifer, O’Hara, and Paperman (1996) find that large spreads are usually attributed to asymmetric private information, and pertain to
less active stocks which face a greater risk of informed trading. The authors use trading volume as a proxy for adverse selection. McInish and Wood (1992) also find that spread tends to widen following large volume orders. Studies using alternative proxies for adverse selection risk feature insider ownership (Glosten and Harris 1988), market value of shares outstanding (Harris 1994), turnover (Stoll 1978), and the number of securities a dealer makes a market in (Branch and Freed 1977.) These studies find similar results. Harris (1994) finds that market tick size affects the composition of the bid-ask spread. Bollen, Smith, and Whaley (2002) conclude the spread is a function of the minimum tick size, the inverse of trading volume, dealer competition, and inventory-holding premium. The last component appears to be the major one, and is a non-linear function of share price and return volatility.
Ho and Macris (1984) find that the bid-ask spread is positively related to asset risk, and incorporates significant inventory effects. They find the spread to be
negatively related to the level of dealer’s inventory. Glosten and Harris (1988) find that the bid-ask spread contains an information component, as well as another joint component that includes dealer’s risk aversion and inventories. Also, they find that the adverse selection component of the bid-ask spread increases with trade size.
Hasbrouck (1988) estimates a bivariate vector autoregressive model of volume and prices, and finds volume is related to price revisions (confirming an old Wall Street adage that “it takes volume to move prices”.) Moreover, he finds information effects exceed inventory effects.
2.1.2. Price Effects Associated with Trading and Depth
Quoted bid and ask prices only apply to trades of specified size (quoted depth.) Institutional investors like pension funds and mutual funds often trade
quantities much larger than the posted depth. Large orders may have an inherent price impact resulting in worse price execution25. Market depth, therefore provides an important complementary dimension of market liquidity, quality and trading costs. Large trades are usually executed through “block” negotiation in the upstairs market, or “worked” throughout the day to minimize their price impact26. Studies focusing on the effects of block trading27 have discovered evidence of a price impact associated with large trades, although it is mild, and temporary at best. Furthermore, large trades have a pronounced asymmetric impact on price, with price increases from purchases persisting, thus possibly reflecting an adjustment to new information. Studies by Barclay and Warner (1993), Chan and Lakonishok (1995), and Keim and Madhavan (1996) fail to support the theory that informed traders and insiders execute large trades. Rather, informed traders execute medium-sized transactions, or they chop up their transactions, thus giving rise to auto-correlated order imbalances. Keim and Madhavan (1996) find that the price impact of block trades is positively related to trade size, and negatively related to market capitalization. This body of literature is
25 Price execution is defined as the eventual actual price at which the transaction takes palce. 26 For details on block negotiation, see Harris (2003.)
27 See Scholes (1972), Krauss and Stoll (1972
a and 1972b), and Holthausen, Leftwich and Mayers
supplemented by recent works28 on the interaction of liquidity and trading strategies of large investors.
Other studies29 have investigated the price effects of institutional “herding.” They show that such trades do in fact have a persistent effect on price, and that buying precedes future positive returns.
Consistent with these observations, Chordia and Subrahmanyam (2002) develop a model which explicitly considers how market makers accommodate
autocorrelated order imbalances resulting from large traders splitting their orders. The authors show that autocorrelated net order imbalances lead to a positive relation between lagged imbalances and returns, with the relationship reversing sign after accounting for current imbalance. The model isolates signed net order imbalances rather than cumulative trading volume as the major price moving factor, and is
consistent with Kyle’s (1985) intuition. In other words, the old adage “it takes volume to move prices” should in fact be “it takes order imbalance to move prices.” The argument is extremely pertinent to this research, because my primary liquidity measure of realized market depth (VNET) is in fact the realized signed net order imbalance transacted within a price duration. Chordia and Subrahmanyam (2002) test their model using daily data, while the duration framework takes the model one step further, thus allowing a direct test of microstructure effects – a feature that is arguably lost when using cumulated daily signed volumes.
28 Dubil (2002), Bertsimas and Lo (1998), Jarrow (1992), Frey and Patie (2001). 29 Lakonishok, Schleifer, and Vishny (1992), Wermers (1999), and Stoll (2000.)
French and Roll (1986) examine returns on trading vs. non-trading days and document a greater return variance on trading than on non-trading days. They offer several alternative explanations for their results. Public information might arrive with greater frequency during business hours with the result that prices are revised to reflect the newly available information. Alternatively, private information might be introduced during business hours through informed trading. Finally, the trading process itself might lead to higher volatility on trading days. French and Roll find that the private information hypothesis is supported, and that volatility in stock returns during business hours is due to informed traders entering the market at the open and prices eventually impounding the new information. French and Roll’s argument is formalized in subsequent models by Admati and Pfleiderer (1989) and Foster and Viswanathan (1990). Alternative tests utilizing intraday data (Harris 1986, Madhavan, Richardson, and Roomans 1997, and Wood, McInish, and Ord 1985) have
documented U-shaped patterns in the bid ask spread and volume during the day, and tend to support these price formation hypotheses. Jain and Joh (1988) find that day-of-week and time-of-day dummies are significant in explaining trading volume, and are correlated with returns.
In summary, extant research supports the existence of both inventory and information effects on liquidity, and finds evidence that trading affects the time series pattern of spreads and volatility. Thus, controlling for the alternative hypothesized
components of the bid-ask spread30, the evidence suggests that cross-sectional variation in spreads can be explained by economic variables.
2.1.2.1. Net Order Imbalances and Price Changes
Several authors have argued that it is net order flow, or order imbalances, and not volume that moves prices31. The idea is intuitively appealing since total volume will inevitably aggregate transactions on both sides of the market, thus rendering impossible any test of the respective price effects of buy versus sell orders. Madhavan and Smidt (1991) disentangle order flow’s signal of future value from inventory effects and find a significant information effect, and a weak inventory effect. Their findings support the hypothesis that order imbalances lead to quote revisions. The relation is also confirmed by Hasbrouck and Sofianos (1993) and Chordia, Roll, and Subrahmanyam (2002) who find that signed order imbalances reduce market
liquidity, and that returns are correlated with previous imbalances. Dennis and Weston (2001) argue that economies of scale exist in the acquisition of information, and that institutions and insiders are more informed than individual investors. They find evidence that market makers move prices in response to institutional trades, supporting the information asymmetry hypothesis. The idea is that trade size or order flow reflects the underlying disagreement amongst traders about a security’s true value. On the other hand, Jones, Kaul, and Lipson (1994) argue that trade sizes, and
30 George, Kaul, and Nimalendran (1991) find the adverse selection component only accounts for 8 to
13 percent of the quoted spread. Huang and Stoll (1997) find that 38 percent of the spread is due to inventory and adverse selection costs.
31 Madhavan and Smidt (1991), Hasbrouck and Sofianos (1993), Chordia, Roll, and Subrahmanyam
therefore volume contain no information beyond that contained in transaction frequency, and claim the number of transactions is more important than size. Their finding is consistent with the Mixture of Distributions Hypothesis (MDH)32. MDH implies a positive relation between volume and volatility because they are jointly determined by the number of information events which serves as a mixing variable and explains their positive correlation.
2.1.3. Plan of Study
The literature abounds with alternative explanatory variables and empirical proxies that could readily be used as independent variables representing order processing, inventory, and information effects impacting spreads and overall liquidity, market quality and trading costs. Intraday models of price formation provide insights about how to identify the influence of asymmetric information and inventories on prices. These models predict the inventory effect will be transitory, and the asymmetric information effect will lead to a permanent change in prices, since the (net) order flow acts as a signal about future security value and leads to a permanent belief revision.
A central focus of this study is the modeling of the time between successive price changes. I assume there is a latent information arrival stochastic directing process which drives trades and thus price changes. The Autoregressive Conditional Duration (ACD) models applied will allow direct modeling of the evolution of the
time between price changes. The time between price changes provides a measure of price volatility that does not impose an arbitrary, fixed interval framework on the analysis. The model’s treatment of time is better suited for analyzing irregularly spaced, ultra-high frequency transaction data, while circumventing the
heteroskedasticity inherent in fixed-interval data. Furthermore, the duration construct helps avoid problems like bid-ask bounce, and the spurious autocorrelation of returns arising from working with discrete prices and non-trading periods.
Microstructure theories can then be tested by examining the impact of variables hypothesized to affect the price and spread formation process upon the expectation of the conditional price duration. In addition, as outlined in Section 6, the price duration framework allows me to estimate a model of realized market depths and thus test the influence of different hypothesized determinants of liquidity.33 The setting will also allow direct tests of the above mentioned liquidity effects in the presence of large traders, as well as provide insights about optimal liquidation strategies for large portfolios.
2.2. Market Protocol Change: Decimalization at the NYSE 2.2.1. Market Protocols
The NYSE started as a call auction market, in which trading took place at pre-specified times according to prescribed rules. This mechanism is now a remnant of
33 The empirical setting also enables construction of market reaction curves (Engle and Lange 2001)
that can be examined in trying to pinpoint the key driving factors of market depth and liquidity dynamics.
the past34, even though it still characterizes the exchange’s opening procedures where a single clearing price is set to clear the market and maximize trading volume. During the rest of the day, the NYSE operates as a continuous auction in which investors “trade against resting orders placed earlier by other investors and against the ‘crowd’ of floor brokers” (Stoll, 2002 page 3.) In addition, the NYSE is a hybrid
auction/dealer market because specialists are allowed to trade for their own accounts in order to maintain liquidity and price continuity in their assigned stocks.
Investors submit two types of orders. Market orders require immediate
execution at the best available price, limit buy orders set a maximum price to buy and sell orders a minimum price to sell. The highest limit order to buy and the lowest limit order to sell establish the market and the quantities at those prices determine the depth of the market. Market orders then trade with the best limit orders. Priority rules are typically used to determine how market and limit orders are fulfilled. First priority is given to orders with the best price and secondary priority to orders posted first at a given price. Until recently, the NYSE had stipulated minimum increments by which stock prices could change. These are known as tick size. Tick sizes affect the way priority rules operate. As Harris (1991) notes, the secondary priority is meaningless if the tick size is very small. If the tick size is small, investors and/or dealers can “step in front of” limit orders to buy by quoting a slightly higher price and incurring a relatively small cost35. On the other hand, when tick size is small, investors placing
34 For a detailed description of the trading environment, see Harris (2003.) 35 A
Business Week (October 27, 2003) article “Under the Gun at the Big Board” refers to the increased
specialist use of ‘penny-jumping’, lack of transparency, and unclear trade-through rules. A WSJ article (February 18, 2004 C1) “Five Specialists Agree to Pay Big Board Fines” also documents the rising
limit orders and thus supplying liquidity to the market run an increased chance of their buy limit orders being “picked off” if new information warrants a lower price. Too low a tick size could therefore discourage investors from placing limit orders and hence reduce market depth and liquidity. Thus, an optimal minimum tick size may be consistent with the operational efficiency of capital markets.
2.2.2. Decimalization and the Tick Size
Decimalization refers to the practice of quoting security prices in one-cent increments, rather than a fraction of a dollar. Up until June 1997, the NYSE tick size was 1/8th of a dollar. The 1/8th tick size dates back to October 13, 1915, when the NYSE switched from quoting prices as percentage of par to quoting them in dollars. Angel, (1997) provides some history behind the seemingly arbitrary 1/8th rule. Before 1915, the minimum tick size was 1/8th of a percent, dating back as far as 1817. Street lore suggests the 1/8th rule arose form the Spanish “pieces of eight’ coins that were chopped into eight pieces for use in the colonies, but no historical evidence supports the argument, especially since the first NYSE prices were quoted in British pre-decimal currency units. After June, 1997, the NYSE switched to a 1/16th of a dollar minimum tick size. The New York Stock Exchange completed the switch to decimal pricing in January 2001. By the end of April 2001, all major exchanges in the USA had switched to decimal pricing, replacing the 1/8 or 1/16 increment quotes.
incidence of the specialist practice of stepping-in-front of orders. Both provide anecdotal evidence of hindered liquidity, partly due to the decimalization switch.
Proponents of decimalization claimed that refining the pricing grid and the associated bid-ask spread would lead to a decrease in transaction costs, enable more smaller-sized trades, and increase market participants’ welfare by reducing the opportunities for market makers to extract excessive profits. The NYSE approved decimalization with the stated intent of making prices easier to understand, reducing spreads, and making the NYSE conformable to international markets. However, arguments favoring an optimal fractional tick size also exist.
2.2.3. Literature on the Effects of Decimalization
Harris (1991, 1994) states that reducing the tick size decreases liquidity by decreasing the cost of getting inside someone else’s quote, thus decreasing the incentive to post limit orders. Posting a limit order also reveals the investor’s information set which can move the price in an unfavorable direction. A larger tick size will then increase investor compensation for the vulnerability of exposing their positions through limit order postings. Angel (1997) provides empirical evidence that a larger relative tick size increases willingness to post limit orders.
Brown, Laux, and Schachter (1991) also claim that an optimal, non-decimal tick size might exist that minimizes the costs of negotiating and bargaining. In addition, a wider relative tick size leads to fewer possible prices and correspondingly less information to track, thus making the contents of the order book much easier for
market makers to track.36 Furthermore, a wider minimum tick size reduces the probability of trading errors (Brown, Laux, and Schachter, 1991) and encourages dealers to make a market in a stock by effectively setting a minimum bid-ask spread37 and encouraging market makers to conduct more research and promote the stock better if they are also brokers. The latter argument pertains to the NYSE since some specialist firms are owned by large brokerage firms.
In an early version of Chakravarty, Wood, and Van Ness (2004), the authors provide an overview of the theoretical literature focusing on tick size, splitting it into five streams:
1) Research claiming optimal minimum tick size arises due to market frictions from Bertrand competition among liquidity providers (Anshuman and Kalay (1998), Bernhardt and Hughson (1996), Kandel and Marx (1997).)
2) Research claiming minimum tick size helps coordinate negotiation (Brown, Laux, and Schachter (1991), and Cordella and Foucault (1999).)
3) Research relating tick size and payment for order flow,
claiming that a reduction in tick size might diminish the practice of paying for order flow and increase transparency and trading volume. (Chordia and Subrahmanyam (1995), and Battalio and Holden (1996))
36 The existence of an optimal number of pieces of information held in short term memory is supported
by cognitive research by Miller (1956) and Simon (1974).
37 See Harris (1991, 1994), Ball and Chordia (2001), Grossman and Miller (1988), and Niemeyer and
4) Research claiming smaller tick size will reduce bid-ask spreads thus enhancing liquidity (Hart (1993), Peake (1995), O’Connell (1997).)
5) Research claiming a lower tick size will lower spreads and depth due to a decline in profitability of supplying liquidity (Harris (1994, 1998), Grossman and Miller (1998), and Seppi (1997).)
The empirical effect of decimalization on market liquidity, price volatility, and welfare do not suggest any overall benefit was gained. Bacidore (1997) finds that a reduction in tick size from 1/16th of a dollar to 5 cents on The Toronto Stock
Exchange decreased spreads, but left depth and trading volume unaffected. A
reduction from 5 cents to a penny, however, lead to almost no discernible changes in any market quality variables. Other research38 has confirmed decimalization led to decreased spreads and depth on The Toronto Stock Exchange. Ball and Chordia (2001) and Goldstein and Kavajecz (2000) find that reducing NYSE ticks from 1/8th to 1/16th decreased quoted spreads, corresponding depths, and limit order book depth.39 Studies on the NYSE change to sixteenths40, and the AMEX switch to sixteenths (Ronen and Weaver, 2001) also find that tick size reduction reduces spreads and depths, thus making it costlier to execute large trades.
Gibson, Singh, and Yeramilli (2003) conclude that the adverse selection and inventory components of the spread remained relatively unaffected by the switch to
38 Huson, Kim, and Mehrorta (1997), Porter and Weaver (1997), Ahn, Cao, and Choe (1998), and
Weaver (2003.)
39 Ball and Chordia (2001) support the move to decimalization, claiming it will lead to more efficient
spreads closer to the “true” spreads for large, liquid stocks.
40 Bollen and Whaley (2001), Ricker (1998), Goldstein and Kavajecz (2000), Jones and Lipson (2001),
decimal prices, and the reduction in spreads after NYSE decimalization was due mainly to a diminished order-processing component. Chung and Chuwonganant (2001) investigate the frequency of quote revisions, using it as a proxy for market quality, efficiency, price discovery, and competitiveness. They find that the frequency of quote revisions has increased with decimalization, thus reducing price rigidity. They also find that minimum price variation rather than minimum tick size is the binding constraint on absolute spread quote behavior. Bessembinder (2003) reports that intraday volatility declined following decimalization but the quote revision process remained relatively unaffected. Dyl, White, and Gorman (2002) argue that decimalization will likely have no impact on dollar trading volume, because lower spreads will induce more information gathering and market making efforts that compensate for higher trading costs. The only change as the market reaches its new equilibrium, they hypothesize, will be lower stock prices, as firms split their stocks, striving to achieve an “optimal preferred price range” for their shares that decreases with spreads and tick size.
2.2.4. Plan of Study
All studies investigating the impact of decimalization have shown that even though bid-ask spreads have generally decreased after decimalization41, thus
improving liquidity by reducing trading costs, another component of liquidity, namely market depth has deteriorated. Contrary to what regulators hoped for, the net result
41 Preliminary results by NYSE Senate Subcommittee on Securities and Investment, May 24 2001,
seems to be increased trading costs for institutional investors, and the impact is unclear for smaller sized trades. The welfare implications of the switch are ambiguous.42
By analyzing intraday transactions (TAQ) data from the NYSE, this study will empirically test for changes in the liquidity and realized market volatility processes brought about by decimalization, within the framework of price durations. In addition, I will test the validity of existing market microstructure theories in the presence of decimal prices, and examine the effect of decimalization on price formation dynamics in light of alternative microstructure hypotheses.
2.3. Liquidity and Commonality in Liquidity 2.3.1. Overview and Literature on Liquidity
Liquidity in financial markets is commonly defined as the ability to ‘trade large size quickly, at low cost, when you want to trade’43. Liquidity (trading) costs may exert a significant influence on required returns44 and thus influence corporate costs of capital.
The two major components of trading costs are costs of immediacy and market depth. In the most general case, immediacy is represented by market maker bid and ask quotes, and depth by the quantity of shares that can be transacted at those quotes. Liquidity is thus a bi-dimensional concept, influenced by the interaction of
42 Bessembinder (2003) finds no deterioration in selected market quality measures after decimalization. 43 Harris, (2003).
44 Amihud and Mendelson (1986), Jacoby, Fowler, and Gottesman (2000), Jones (2001), and Butler,
immediacy and depth. Early microstructure research, for the most part overlooked this bi-dimensional aspect, concentrating only on one of the two measures, namely immediacy costs45. These models assume constant trade size. On the other hand, early studies dealing with market depth instead assume a single liquidation price, thus assuming away the second dimension of liquidity46.
Recent empirical studies have investigated the relation between the two liquidity components. Lee, Mucklow, and Ready (1993) find evidence that NYSE specialists manage adverse selection risks by dynamically setting both immediacy costs and depths. The authors detect a negative contemporaneous relation between depth and spread size. Goldstein and Kavajecz (2000), and Jones and Lipson (2001) also emphasize the relation between spreads and market depths, within the context of new market reforms like decimalization, and changes in rules and policies. Escribano, Pascual, and Tapia (2002) is among one of the few studies to propose alternative, bi-dimensional proxies measuring liquidity. They find that heterogeneous expectations about future volatility usually give rise to unambiguous liquidity changes, and that volatility is a major factor in the contemporaneous evolution of spreads and depths. Chung and Zhao (2003) find that spreads and depths are strategically adjusted mostly in the early and late hours of the day, consistent with the higher volatility
characterizing those times. The authors also find that depth revisions are much more common than spread revisions. A theoretical model of the exact inter-temporal
45 Ho and Stoll (1981), Glosten and Milgrom (1985), others.
46 Other models of depth (Charoenwong and Chung, 1998, Kavajecz, 1999) are mainly just extensions
relation between spreads and depths changes resulting from market maker adjustment to concurrent shocks is, however still lacking.
Chordia, Roll, and Subrahmanyam (2002) examine the empirical relation between trading activity, liquidity and market returns using signed order imbalances to approximate trading activity pressures47. Similar to the Chordia and
Subrahmanyam (2002) order imbalance treatment, the authors claim order imbalances could proxy for asymmetric information and therefore reduce market liquidity and bring about a permanent price revision, just as in Kyle (1985.) In addition, random order imbalances could lead to temporary price and depth quotation changes, as market makers try to smooth their inventory positions. The authors find that lagged values of liquidity and market returns can predict liquidity, consistent with the hypothesis that price fluctuations decrease liquidity because they increase inventory risk. In a related paper, Chordia, Roll, and Subrahmanyam (2001) detect negative serial autocorrelation in daily liquidity measures and an asymmetric response of spreads to up and down markets. Spreads seem to decrease and depth increases in up markets, while the opposite is true for down markets. In addition, spreads and depth respond to market volatility, and day-of-week effects. Contrary to general intuition, recent market volatility is found to reduce spreads, a finding difficult to fit into existing theoretical models.
47 An extensive line of research (Gallant, Rossi, and Tauchen (1992), Lo and Wang (2000)) has
documented the relation between trading volume and market return. For an excellent summary, see Karpoff (1986).
2.3.2. Liquidity Commonality
A handful of recent empirical studies (the two major ones being Chordia, Roll, and Subrahmanyam (2000), and Hasbrouck and Seppi (2001)) have examined and documented commonality in trading activity and liquidity in equity markets. The issue of correlated liquidity is of particular interest, for it could help explain the driving forces behind the October 1987 stock market crash, or the documented 1998 credit sensitive bonds global liquidity crisis that gave rise to other financial crises characterized by diminishing, even disappearing liquidity48. These studies detect the presence of common factors in order flows, proxies for liquidity, and returns.
Liquidity commonality could have important implications for asset pricing if it represents a systematic, non-diversifiable factor49. Acharya and Pedersen (2002) also argue that common, systematic liquidity risks could make required returns a function of expected illiquidity and the correlation between security return and illiquidity and their market counterparts. Pastor and Stambaugh (2002) find that securities having a high return or liquidity in illiquid markets command a premium.
Commonality might be due to different types of market-wide liquidity
shocks50. Basket trading, program trading, and herding by large institutional investors
48 Chordia, Sarkar, and Subrahmanyam (2003) give an example of LTCM’s 1998 London and Tokyo
offices lack of buyers and sellers.
49 Jones (2001), and Amihud (2002) claim that since liquidity is persistent, it could help predict future
returns and will be negatively related to contemporaneous returns.
50 Cai (2003) provides an alternative explanation for the 1998 LTCM liquidity crisis. His paper
supports the claim that dealers engaged in very heavy “front running” during LTCM’s financial crisis and margin calls. Because LTCM’s exposures were known and easy to anticipate, dealers stepped in front of upcoming LTCM orders and benefited from the subsequent price change. Since it is illegal for dealers to step in front of their own customers, but not illegal to step in front of other dealers’
customers, the situation could have easily given rise to the documented ubiquitous liquidity crisis, as well as correlated liquidity across different bonds.
could lead to correlated inventory fluctuations, giving rise to liquidity commonality. Such effects could arise from public news releases51 about macroeconomic factors or portfolio-wide liquidity shocks. Alternatively, commonality could also arise from market-wide informational asymmetries. Friederich and Payne (2002, page 10) offer one intuitive explanation for the latter. If a given sample of stocks has “at least one common return driver and a subset of traders has access to a model that provides better than average forecasts of the driver,” the activity of these traders will generate market-wide informational asymmetries. Chordia, Roll, and Subrahmanyam (2000) similarly argue that revolutionary new technologies employed with varying success by different firms might also induce an “outbreak of asymmetric information.” Barberis, Schleifer, and Wurgler (2003) model correlated uninformed trading and its implications for return co-movements. Alternatively, Fernando (2003) presents a model in which the incidence of common factors in liquidity is explained by co-varying investor heterogeneity rather than common liquidity shocks, while cross-asset liquidity commonality is attributed to correlated idiosyncratic liquidity shocks and correlated fundamentals.
2.3.2.1. Empirical Evidence on Commonality in Liquidity
Hasbrouck and Seppi (2001) sample the 30 stocks in the Dow Jones Industrial Average (DJIA) and find52 evidence of correlated common factors in order flows and
51 Following models by Subrahmanyam (1991), Chowdhry and Nanda (1991), Kumar and Seppi
(1994), and Caballe and Krishnan (1994).
52 Their results confirm the Lo and Wang (2000) theoretically hypothesized factor structure for trading
returns. More importantly, using principal components analysis, they find common factors in the levels of liquidity proxies53. These components, as mentioned earlier, can either be the result of unsophisticated liquidity trades arising from momentum, tax-effects, portfolio rebalancing or correlated trading based on forecasts of
underlying driving variables. Hasbrouck and Seppi (2001) use principal components and canonical correlation techniques to detect common cross-firm factors in liquidity and order flows. The common factors of signed and absolute order flow explain part of the variation in returns. In addition, liquidity also exhibits common factors54, even though these factors explain only a modest portion of cross-firm variation after accounting for seasonality. The modest evidence of commonality leads the authors to the conclusion that common liquidity shocks are only eminent in short-lived, crisis-like episodes, and are not characteristic, or sustainable in periods of normal trading. The authors suggest that a part of the explanation for the modest degree of
commonality might be the presence of both transitory (immediacy related) and permanent (informational) components in liquidity measures. Their approach, aggregating over a fixed-time interval (15 minutes), does not allow a clear segregation of the two effects because it potentially averages transitory and permanent episodes, and will further be confounded by the presence of unequally
53 The research is separate from the bulk of studies (Jain and Joh (1988), Foster and Viswanathan
(1990), Wood, McInish and Ord (1985)) establishing time-of-day liquidity effects, or liquidity patterns around idiosyncratic, firm-specific events ( as in Lee, Mucklow and Ready (1993), Foster and
Viswanathan (1995).) Also, refer to Section II – A.
54 The identity of the factors is, as usual, unknown. Henker and Martens (2002) present some evidence
that one of the factors might be a common cost component due to portfolio effects of dealers hedging their positions by varying the spreads of stocks they deal in which exhibit correlated liquidity. That common factor is largest for securities with highest trading frequencies.
spaced trades and bid-ask bounce. I suggest that employing the duration framework isolating meaningful information events (price changes) might provide a remedy to this problem because my liquidity measure is predicated upon the particular price change it brought about, as discussed in sections 2.3.3 and 6.3.
Chordia, Roll, and Subrahmanyam (2000) present an alternative method of detecting commonality in liquidity. Friedrich and Payne (2002) describe the method as a “stock-by-stock time series market model regression,” of the change in a liquidity variable on the concurrent change in a cross-sectional market or industry average of the same variable. Also included as independent variables are all the traditional determinants of liquidity such as volatility, volume, price, number of transactions, etc. The linear relationship is justified by Subrahmanyam (1991). Chordia, Roll, and Subrahmanyam (2000) test whether inventory or asymmetric information sources govern commonality, and if trading cost shocks are non-diversifiable and therefore priced. With regard to inventory effects in commonality, the authors find that greater market-wide trading (most likely due to more uninformed trading) possibly decreases inventory risks and thus decreases specialist spreads. The presence of market-wide informational asymmetry evidenced by a greater number of transactions, however55 promptly increases spreads. The authors’ model does not permit them to test whether market-wide asymmetric information has common driving factors, only that it gives rise to commonality in liquidity.
Chordia, Roll, and Subrahmanyam (2000) speculate that even though their results show that most of the cross-sectional variation in liquidity is diversifiable, assets with higher sensitivity to liquidity shocks might require higher average
expected returns. The claim is formalized by Acharya and Pedersen (2002) who show that time-varying common factors in liquidity influence required returns. The
prediction is further confirmed by Pástor and Stambaugh (2002) who find that over a 34-year period, the average return on stocks that are highly sensitive to liquidity exceeds the average returns of stocks less sensitive to liquidity. Vayanos and Wang (2002) develop a search-based model of asset trading and show that market-wide liquidity can influence cross-sectional stock returns and that liquid assets trade at a premium relative to less liquid assets.
Chordia, Sarkar, and Subrahmanyam (2003) extend the search for
commonality in liquidity by considering how stock and bond liquidity co-vary. They find significant correlations between liquidity shocks across the two markets,
supporting the claim that a common factor like macro liquidity might drive liquidity measures.
Huberman and Halka (2001) also find evidence that supports the existence of a market-wide systematic component of liquidity. Using autoregressive models on a range of liquidity proxies, the authors find that the residuals from two mutually exclusive samples are positively correlated even after controlling for microstructure variables. Their econometric model is structurally very similar to the Chordia, Roll, Subrahmanyam (2000) “market regression” setting.
Harford and Kaul (2004) extend the fixed-time 15-minute interval analysis of Hasbrouck and Seppi (2001) and try to identify possible sources of the order flow commonality they detect with principal component analysis and its correlation with returns. They find that commonality is strong for the stocks included in the S&P500 index while not so pervasive for non-index stocks whose modestly co-varying order flow tends to be driven by market order flow and industry forces. They find
individual stock and aggregate order flow co-movement is the driving force behind correlated returns. An interesting implication of their findings is that market makers might utilize aggregate order flow in addition to stock specific order flow to model their price, spread, and depth quoting behavior. The principal components they detect only explain a modest portion (9-16% for the first component) of the co-variation in index stocks order flow and the proportion explained is even weaker for non-index stocks. The modest explanatory power of their components confirms the results of Hasbrouck and Seppi (2001) but is in disagreement with the Chordia, et al (2000) finding of significant commonality in changes of daily measures of trading costs. The authors claim a new estimation strategy or aggregation method is needed to reconcile these findings. My duration-based analysis is one such alternative estimation method, for it provides an event time model of trading costs (price impact or realized depth measures) explicitly controlling for market microstructure and conditional volatility effects.
The major differences between the Hasbrouck and Seppi (2000) and the Chordia, Roll and Subrahmanyam (2000) liquidity commonality procedures are the