Generic Strategies and Firm’s Performance in the Banking Sector
MOHAMMED MAJEED ABUKARI INUSAH
IDDRISU ABDUL-MAJEED
Abstract
The main goal of the current study was to establish the relationship that exists between generic strategies and firm’s performance in the banking sector. The study reviewed literature on generic strategies employ by banks in Ghana in line with Porter’s typology. The researcher employed descriptive survey design and purely quantitative approach with data collected from 200 respondents. The outcome of the study revealed that cost leadership is the most outstanding competitive strategy, whilst overall differentiation and low cost strategies are most commonly used in the banking industry. The study concluded that generic strategies are the most influential competitive strategies for performance of banking firms in Ghana. The author recommended that all staff should remain focus in designing services that make them unique from others to achieve the overall differentiation strategy and make all staff be committed to cost control in all areas to achieve low cost strategy.
Keywords: Generic Strategies, Strategies, Cost Leadership, Focus and Differentiation
1.0. Introduction
Johnson and Scholes (2002) referred to strategy as the scope and direction over a long-term to achieve firm’s advantage, via the configuration of resources under a challenging environment to meet stakeholder requirement. Competitive edge over rivals (Stickland and Gamble, 2008). Thompson and Sticker (2007) explained that, strategy depicts organizational selection from among various options and signals firm commitment to specific product or service, applying the market competitive orientations and establishing ways of executing them.
Besanko, Dranave, Shanley, and Schaefer (2006) identified business approaches used for finding varied generic strategic approaches, and stated that many competitive strategies impact organization performance in varied ways. The main goal of any organization is to increase its market share and to become attractive to investors through profitability (Thompson et al., 2007). Competition among banking firms in Ghana is intense necessitated by the evaluation of porter’s generic strategies adopted by industry players to remain competitive. This research is focused on examining generic strategies in the banking sector and how it impacts on their performance.
2. Literature Review 2.1. Generic Strategies
The generic strategies also known as competitive strategies was propounded and published by Michael E. Porter in 1980. Porter (1980) said that strategy focuses on differentiation, Cost leadership or focus, that an organization must tactically select any one or risk wasting resources. Porter’s generic strategy though a theory, allows firms to comprehend competitiveness of a firm, recommending that gaining competitive advantage emanates from the competitive strategies employ by the firm to deal its weakness, strength threats and opportunities. These strategies bear the name generic because, it can be used or applied by all firms, business, and industries, being it service marketing, non-profit, public, private and manufacturing (Hill & Jones, 2001). Hill and Jones (2001) stated that, all the generic strategies impact on firms making consistent selection of market, choice of product and unique competences.
Porter’s generic strategy typology shows that firms’ success depend on the choice of focus, cost leadership, and differentiation (Anupkuma, 2005). Researchers (Kim, Nam & Stipert, 2004; Spanos, Zarakis & Lioukas, 2004) revealed that firms which have low performance are those which have chosen to use only one of the generic strategy. Kim et al. (2004) indicated that, manufacturing organizations utilizes both cost leadership, and differentiation and focus. Acquaah, Adjei and Mensah Bonsu (2008) argued that cost leadership and differentiation are positively related to performance in the manufacturing and service sectors in Ghana. In another study, Kim et al. (2004) studied business to customer firms and noted that significant performance were recorded for those firms that adopted differentiation and cost leadership strategies in Korea. Again, in a Ghanaian study, Aukkh, Kotabe and Teegen (2002) differentiation and cost leadership were found to have positive association with export firm’s performance. Awour (2011) studied competitive strategies, employed by Kenyan Banks, the study concluded that service differentiation and focus strategies were broadly employed. Livvaran (2007) said that porter’s typology is a source firm’s superior performance and has since provoked many scholars to inquire into it.
2.1.1. Cost Leadership
Cost leadership refers to being a low cost producer in a particular industry with an acceptable level of quality. The goal is to attract customer based in price, especially, when the target market is price sensitive (Porter, 1985).
Under this circumstance, the firm relies on economies of scale, technology, raw material accessibility to exploiting cost advantage. According to Porter (1980) “cost leadership places emphasis on aggressive construction of efficient scale facilities, vigorous pursuit of cost reduction from experience, tight cost and over-head control, avoidance of managerial customer accounts, and cost minimization in areas like research and development (R & D), service, scale force, advertising and so on” (p. 35). Porter (2001) opined that, achieving competitive advantage is through providing low prices than rivals. But lower prices are achieved via production and distribution cost reduction (Porter, 2001).
Outsourcing is one the strong means of reducing cost of salary, whilst holding to your workforce size and productivity (Zahra, 2000). El-kelety (2006) stated that cost leadership targets cost control and enhancing efficiency by firm’s supply chain. Cheah, Kang and Chew (2007) posited that, low cost strategy allows management to concentrate on cost competition; and that cost leadership is a defensive mechanism from rivals. Cost advantage factors include propriety technology, economies of scale, preferential access to raw materials and economies of scope (Porter, 1985). In a Japanese study, Grant (2005) contended that many industries like automobile and music have achieved their goals through the combination and reconciliation of technology growth, low cost and high quality. Full cost leadership potentials are realized through elements of organizational structure such as focus on narrow range of business functions, reporting relationship, and corporate staff (Barmey & Hesterley, 2006). Kotler and Armstrong (2001) argued that low-cost is achieved through distribution and production in order to price lower than rivals and gain large market share.
In Nairobi-Kenya, Gitonga (2003) discovered that low-cost strategy is applicable even in hospitality industry. Cost leadership places emphasis on efficiency (Brakaj, Kume & Cipi, 2015). Hyat (2001). Argued that low-cost strategy helps firms to achieve competitive advantage by having the lowest industry cost. Cost leadership can be attained via having large market share (Hyatt, 2001). In an industry only one firm can be a cost leader (Sy, 2002 & Venu, 2001). In pursuance of the low-cost strategy, Porter (2008) stated that firms should either offer good product or service which worth paying for or offer better quality product or service at lower price. Maburg (2000) proffered that low-cost strategy is achieved through employee commitment to low-cost strategy and low-cost production. According to Helms, Clay, and Peter (2007) argued that low price increases demand for firm’s product to increases firm’s market share. The advantage of low-cost strategy is that cost leaders can put entry against the new entrants who may require huge capital outlay to enter the industry’s market (Hyatt, 2001).
In the healthcare, cost leadership was found to be a strong predictor single-strategy performance (Hahn & Powers, 2010; Allen & Helms, 2006). Johnson et al. (2011) posited that, cost leadership has to do with a firm becoming a low-cost one in its operations through experience, product and service design. Low-cost raw materials and inputs economies of scale and lower prices. Firms pursuing low-cost strategy put emphasis on reducing cost at every bit of the way in the value chain activities (Lynch, 2003).
2.1.2. Focus Strategy
According to Porter (1985), focus strategy is focused on specific market niches and customer. Hansen, Dibrell, and Down (2006) stated that focus strategy is a modification of differentiation and low cost strategies. Lynch (2003) said that since focus concentrates on particular niche in the market and service, it can also term as niche strategy. Firms can make good use of differentiation and low cost strategies in respect of focus strategy (Lynch, 2003). The risk associated with niche strategy is that change in customers taste and preference as well as change in firms and market environment can cause the disappearance of niche (Lynch, 2003). Focus strategy allows firms to concentrate on serving customers in narrow segment (Davidson, 2001). Focus approach considers market that is not well to by differentiation and low-cost strategies (Johnson, et al. 2011). Johnson, et al. (2011) noted that focus strategy offer limited collection of products/services to specific customers.
Thomas, Strickland, and Gamble (2008) stated that there are some conditions that focus strategy needs to have to make it effective: the market that is target at should be large enough to offer growth opportunities and yield reasonable profit; the market leader fail to recognise that their presence in the niche is critical to their success; the industry has several segments and niches; the focusing firm gained loyalty and reputation capable of warding off market challenges. Focus strategy whether affixed to differentiation or fostered to cost leadership is focused on serving the needs of a specific market segment (Pearce, Minttal, and Robinson, 2010). The major differences between differentiations and low-cost strategy are the target market’s scope. Hahn and Powers (2010) recommended focus strategy for situations that cost leadership and differentiation cannot applied (Porter, 1985).
According to Thompson et al. (2008) focus strategy targeted at gaining competitive advantage centered on cost leadership and differentiation. This situation is possible if the following conditions are met: target market is large enough to yield expected profit and allows firms to grow in future; when it is expensive for other industry players to place capabilities in place to meet the particular requirement of buyers; finally when the market leaders consider such segments are bases of their success; and the industry has multiple but varied niches thereby permitting focuser to choose a comparatively attractive niche right for its strengths and capabilities (Ghemawat,
2010) stated that focus strategy allows a firm to cut a sub-segment that they can better serve. Hyatt (2001) revealed that focus strategy is concerned with embracing a narrow competitive scope in an industry. Support the claim of Thompson et al. (2008), Porter (2005) said that the success of focus strategy is contingent on industry segment adequate enough to have potentials for growth but not regarded by major industry players. Davidson (2001) differentiation focus and cost focus.
In differentiated focus, the firm aims to accomplish differentiation within a selected segment, whilst cost focus tries to attain an advantage in a chosen segment by decreasing cost (Wit & Meyer, 2002). If a company can achieve both differentiated focus and cost focus in its market segment, and it is operational attractive, the focuser will perform above average in the industry (Wit & Meyer, 2002). The focus strategy is entirely made around attending to a particular target in a manner that outstrips the expectation of customers by allowing the firms’ improve customer satisfaction (Gan et al. 2006). Focusers must be focus oriented towards meeting needs of the segment alongside cost leadership and selective market for selective product/services. Jobber (2004) opined that differentiation focus is relevant in seek out differentiation advantage with single or small number of market segments, whilst cost focus targets cost advantage in single or small number of targeted segments (Jobber, 2004).
2.1.3. Differentiation Strategy
According to Johnson et al. (2011), differentiation strategy encompasses distinctiveness in doing something that is appropriately valued by customer to enable a premium price. This strategy entails designing and producing matchless products/service (Porter, 1985). Emphasis on the uniqueness should be put on unique features, brand image, superior products/service, robust channel network (Johnson et al. 2011). There are several magnitudes and means that a company can distinguish itself and product/service from competing firm’s as follows:
1. During differentiation, customer perception and image of the firm is paramount because the unique features and supposed difference make the customer thoughtful towards the purchase process (Allen & Helm, 2006).
2. The differentiation established by the association between buyers and the firm via adaptation to customers’ characteristics and personalization of product.
3. Differentiation is also effective by concentrating on the relationship between organizational functional areas, product mix, channel mix, and after sales services.
Porter (1985) posited that differentiation have the advantage brand loyalty, quality, low brand elasticity and higher revenue compared to rivals. As opposed to low cost, differentiation is focusing on creating uniqueness value (Hlavacka et al. 2001). Differentiation is created to improve satisfaction in customers (Ovidiu et al. 2009). Providing distinct but wide-ranging new product/services and fine-turning the already existing services/products creates customer satisfaction since they have option to select from (Abratt & Dion, 2006), Reilly (2002) postulated that differentiation is one of the major business strategies. Hlavacka et al. (2001) revealed that customer loyalty is high with successful implantation of differentiation strategy. According to Hahu and Powers (2010) found areas of differentiation strategy in the banking industry, including: service quality, product development, technology, distribution, pricing, segmentation and customer relationship management. The differentiation strategy aims to define what distinguishes one firm from the other (Reilly, 2002).
Companies must be ready to add premium to the cost in practicing differentiation (Hyatt, 2001). Uniqueness of firm’s product and service build and sustains customer loyalty and influences customers to pay high prices for its products and services (Hlavacka et al. 2001). Johnson and Scholes, (2009) revealed that firms are able to pass on price increase to customers when suppliers increase prices because of the uniqueness of the product/service. The benefits of differentiation strategy includes organizational reputation in respect of innovation and quality, scientific research, highly skilled sales team, creative new product development team, and strong product (Johnson & Scholes , 2009). Hyatt (2001) concluded that value added by the distinctiveness of firm’s product enables the firm to charge a superior price for it.
According to Johnson, Scholes and Whittington (2008), differentiation strategy aims to achieve competitive edge by providing services and products that are different, with different benefit and are broadly valued by customers. Hitt, Ireland and Hoskisson (2009) stated that differentiation is contingent as key competitors and strategic customers by defining what they need and value. The major assumption behind the differentiation strategy is that buyers are willing to pay a premium price for unique products (Ngigi & Njeru, 2014).
2.3. Organizational Performance
2.4. Generic Strategy and Firm’s Performance
Johnson et al. (2011) argued that there is positive relationship between the combination of generic strategies and firms performance. But then, strategy chosen should have relations with firm’s goals and objectives to perform well on the market (Hahn & Powers, 2010). According to Hahn and Powers (2004), a study on generic strategies, competitive methods and firms showed that, in financial business low-cost strategy is highly appropriate than differentiation and focus’ Campbell-Hunt (2010) conducted a met-analysis on the relationship between strategy and firm and found hybrid strategies to be more appropriate that pure strategies in number of researches. In a
Greek study, Spanos et al. (2004) indicated that hybrid strategies is superior to pure strategic for gaining competitive advantage. A strategic mix of porter’s typology is more profitable ones it includes cost leadership (Spanos et al. 2004). Kim et al. (2003) explained that firms which integrate strategies to include low-cost and differentiation outstrip those with those who use generic strategy.
Leitner and Guldenberg (2010) stated that hybridization of generic strategies have oral considerations, cost leadership for efficiency and differentiation for uniqueness. Regardless of the industry type, hybrid strategies impacts on firm’s performance. An innovation to create differentiation is a step towards competitiveness by addressing customer’s needs better and difficult to initiate (Pertusa-Ortaga et al., 2009). For firm’s growth and profitability, hybrid strategies are highly appropriate (Leitner & Guldenberg, 2010). In a small and medium firms, Leitner and Guldenberg (2010) said that a combined strategy results in high financial performance than individual-based generic strategy. Hybrid strategies create flexibility, competitiveness, broader view and distinctiveness of product (Pertusa et al., 2009). Circumstances may require the combination of the generic strategies (Allen & Helms, 2006).
2.5. Conceptual Frame Work
The conceptual framework is done in relation to the definition of strategy by Scholes and Johnson (2002). The generic strategies are challenged by the provision of resources and the environment of the banks.
Hypotheses
H1: Cost leadership will have positive relationship with Bank performance.
H2: Differentiation strategy will have positive relationship with performance in Banks. H3: Focus strategy will have positive relationship with Banks performance.
3.0. Methodology
This section provide details of steps specifically taken, methods, data collection tools, population and sampling strategy, and data analysis. Methodology is framework of which should be conducted. The methods therefore, are the procedures and techniques employed to collect and analyze data.
3.1. Research Design and Approach
The design refers to the plan of how the study questions are responded to. Research designs are divided into exploratory, descriptive, and explanatory (Saunder et al., 2009). For the reason of this study, explanatory design was applied and used. The reason was to explain the research in question rather than to describe the phenomena. Explanatory design is quantitative in nature and allows the researcher to test relationship between the independence (generic strategies) and dependent (firm’s performance) variables.
3.2. Population and Sampling
Polit and Beck (2004) defined sampling as a process of selecting a section to represent a whole. According to Sauders et al. (2007), sampling is the procedure of electing group of people, case, objects or subjects as a representative of the study. A sample is a selection of representation of the population which is tested to gather information about the entire population (Sauders et al. 2009). The sampling size chosen was considered adequate enough to obtain the responses to the research problem. Saunders et al. (2009) refers to population as a complete set of objects or cases from which a sample is elected. Whether human or non-human. In this study, the population is made of staff from different positions including: management HODs and frontline staff. The total
population was 400. This is because Yamare (1967) was employed. n = N/1+N(e)2.
Sample size was therefore calculated as 400/1+400(0.05)2 = 400/1+400(0.002)
Cost Leadership
Differentiation
Focus
Firm's Performance
Marketing Environment Resources Allocation= 400/1+1 = 400/2
= 200
3.5. Sources of Data
Saunders et al. (2007) refers to data as statistic, facts and opinions gathered and recorded for analysis and references. This study combined both primary and secondary data. Secondary data is defined as collected originally for a purpose other than this current study. Saunders et al. (2007) related that secondary data can be explanatory or descriptive. It may also be raw or summarized. (Kervin, 1999). Secondary data can be grouped into multi-source data, documentary-based or survey-based data (Saunders et al., 2006). Tor the purpose of this research, secondary data was sourced from reviewing Journals articles, textbooks and online libraries like Ebscohost and social science research Network (SSRN). Primary data collected from the answers the respondents provided during the survey. Close ended questionnaire was the only tool used for the survey with Likert scale and Yes or No.
3.6. Methods of Data Collection
Questionnaires, observation and interviews are methods of data collection (Saunders et al. 2007). The researchers used survey method with questionnaire as the only tool. This is because all the participants were literates, as such, there was the need using interviews. The questionnaire multiple choice but close ended type to reflect the research approval of quantitative research.
3.7. Data Analysis
Data was analysed using statistical means since it was purely quantitative. After the questionnaire was collected analysis was performed by coding it into SPSS software. The reliability of the variables was examined via Cronbach’s alpha to determine the acceptability (internal consistency). The statistics analysis tools were mean and standard deviation and person’s coloration test run between the generic strategies and firms’ performance. Demographic data were run on simple percentages and frequency to determine each group representation.
Hypothesis
H1: Cost Leadership strategy correlates positively with banks performance H2: Focus strategy correlates positively with banks performance
H3: Differentiation strategy correlates positively with banks performance
Findings
Table 1: Mission statement
Variable Frequency Percentage (%)
Yes 200 100
No - -
Indifferent - -
Total 200 100
Table 2: Vision Statement
Variable Frequency Percentage (%)
Yes 200 100
No - -
Indifferent - -
Total 200 100
Form table 1 and 2 above, the respondents unanimously agreed that the bank has both mission and vision statements. It is therefore wholly appropriate to the research to conclude that the bank has a focus, knows where is going, have a reason for existence as a bank, and have guiding ‘angels’.
Competition
Competition amongst firms is key to effective markets. Competition is the reason for buyers getting good deals. It equally promotes innovation in an industry thereby minimizing cost, wastages but resulting in high productivity. Below is the level of competition in the banking industry.
Table 3: Competitive Scope
Variable Frequency Percentage (%)
Very broad 130 65 Broad 50 25 Moderate 18 9 Narrow 2 1 Very narrow - - Total 200 100
The researcher sought to understand the level of competition in the banking sector in Ghana. The study showed that the banking industry has intense competition, may be motivated by the relaxed policies of the Bank of Ghana. Table 3 stated that, there is very broad competition with highest response rate of 65% and broad as 25%. Meanwhile, only 9% of the respondents said competition is moderate, with 1% saying competition is narrow. However, “very narrow” has 0% to signify that, there is competition at all cost.
Table 3: Reliability of Generic Strategies
Strategic choice Cronbach’s Alpha
Overall cost leadership 0.802
Overall differentiation 0.805
Focus 0.845
Organizational performance 0.787
Descriptive analysis
Value of Mean of research variable statement
The descriptive analysis was used for the study. Participants’ degree of agreement on low cost, differentiation and focus strategies were based on computation of mean score. In this study, the mean rating index considered were, 1.0 (lowest) to 5.0 (highest) as proposed by Kinyuira (2014). The mean and standard deviations specified whether respondents alternated acceptably over the scale. The values of mean and standard deviations for dependent variables in this paper are presented in below tables.
Table 4: Cost Measures Used under Cost leadership
Variable Number Mean Std. Deviation
Over head office cost control 200 4.12 0.89
Advertising and promotion cost control 200 4.33 0.70
Staff cost control 200 4.20 0.73
Distribution cost control 200 4.00 0.87
R&D cost control 200 4.11 0.66
Customer service and care cost control 200 3.92 0.97
Sales people’s activities cost control 200 3.88 0.62
From the descriptive analysis of the data of the study, standard deviation for all cost measures variables 0- to 1.32. According to Cohen (2003), for data standard deviation to be normal it must range between 0 to 1. From the table above, it is shown that all the variables are in the ranges recommended by Cohen (2003). Therefore, the data will be defined as normal in distribution. Additionally, Pearson’s correlation analysis was conducted to understand the association between the research variables understudy.
Table 4: Resources Allocation
Variables Highly
Adequate
Adequate Neutral Inadequate Highly
Inadequate
Freq. % Freq. % Freq. % Freq. % Freq. %
Employee 100 50 60 30 23 11.5 9 4.5 8 4
Finance 60 30 39 19.5 30 15 55 27.5 16 8
Time 80 40 66 33 12 6 32 16 10 5
Logistics & transport 130 65 30 15 20 10 12 6 8 4
Infrastructure 140 50 46 23 10 5 16 8 8 4
From table 4 above, the respondents generally accepted that there is adequate configuration of resources for those strategies to be implemented. Highly adequate and adequate allocation of resources were together 160%, which is reasonable to say that the staffing in respect is strategy is enough. Highly adequate and adequate allocation of financial resources were together 96%. Highly adequate and adequate allocation of time were together 146%. Highly adequate and adequate allocation of logistics resources were together 160%. Highly adequate and adequate allocation of infrastructure resources were together 180%. Employee, finance, time, logistics & transport, and infrastructure resources were in enough for the execution of the strategies.
Table 5: Environmental Challenge
Variables Mean Std. Deviation
Competitive pressure 3.33 1.54
Government intervention 3.35 1.55
Economic changes 3.48 1.22
Technology changes 3.79 1.12
Socio-Cultural situation & changes 3.44 1.38
Average 3.24 0.97
Environmental Challenge
application of the competitive strategies. The respondents agreed that, there are host of environmental challenges with a total mean value of 3.24. The effects of each of the environmental factors are severe since they all exceed the mean rating of 1.00. The mean score for various factors are: competitive pressure 3.33, government intervention 3.35, economic changes 3.48, technology changes 3.79, and socio-cultural situation & changes 3.44.
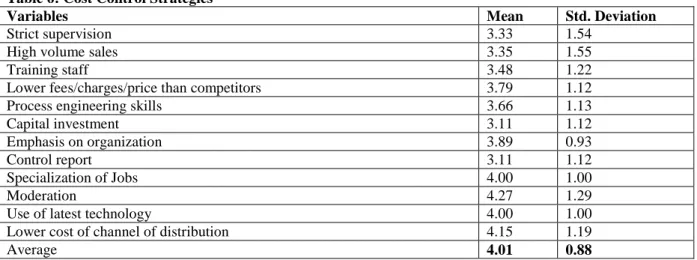
Table 6: Cost Control Strategies
Variables Mean Std. Deviation
Strict supervision 3.33 1.54
High volume sales 3.35 1.55
Training staff 3.48 1.22
Lower fees/charges/price than competitors 3.79 1.12
Process engineering skills 3.66 1.13
Capital investment 3.11 1.12
Emphasis on organization 3.89 0.93
Control report 3.11 1.12
Specialization of Jobs 4.00 1.00
Moderation 4.27 1.29
Use of latest technology 4.00 1.00
Lower cost of channel of distribution 4.15 1.19
Average 4.01 0.88
Cost leadership strategy mean score
According to the mean score analysis, the research found that, a large section of the respondents believed that Ghana Commercial Bank price their products/services lower than competitors products/services to overtake them as the mean values stood at 4.01. GCB has effective but lower cost of channel of distribution with a mean score of 4.15. Emphasis on organization 3.89, Control report has mean value of 3.11, the bank provides strict supervision with a mean of 3.33. the Bank’s high volume sales mean stood at 3.35 to reduce cost. Training staff is practiced by GCB to reduce cost at mean value of 3.48, lower fees/charges/price than competitors with mean of 3.79, it practices process engineering skills with mean score of 3.66, capital investment has mean of 3.11, specialization of Jobs score a mean of 4.00, GCB does its activities in moderation with a mean of 4.27, GCB uses of latest technology to lower coast with strong mean score of 4.00. The findings above are supported by a strong standard deviation value of 0.88.
Table 7: Differentiation
Variables Mean Std. Deviation
Strong research background 3.18 1.25
Rewarding innovative and creative employee 3.64 1.27
Corporate image as selling point 3.88 1.34
Product quality 4.50 0.89
Quality of customer service better than others 4.25 0.97
Quality performance 4.11 0.98
Distinct Technology 2.80 1.05
Practicing TQM 2.63 1.09
Broad service and products for customers 3.95 1.48
Using advertising 3.55 1.17
Average 3.12 0.93
Differentiation strategy man score
The researcher wanted to know the degree to respondents agreed with various research variable statement relating differentiation strategy of the bank. The findings of the study was based on the Likert scales used by the research with an overall differentiation strategy man score of 3.12. It was found that the bank’s strong research background had a mean value of 3.18, rewarding innovative and creative employees scored 3.64 mean, and corporate image as selling point got a mean of 3.88. GCB’s product quality offers it a strong mean of 4.50, the bank’s quality of customer service better than others 4.25. Quality performance mean of the bank stood at 4.11, GCB has weak distinct technology that differentiates it from other banks with mean 2.80, practicing total quality management at mean value of 2.63, their broad service and products for customers put the bank at a good rating at 3.95. GCB also uses advertising to differentiate itself from competitors at mean score of 3.55.
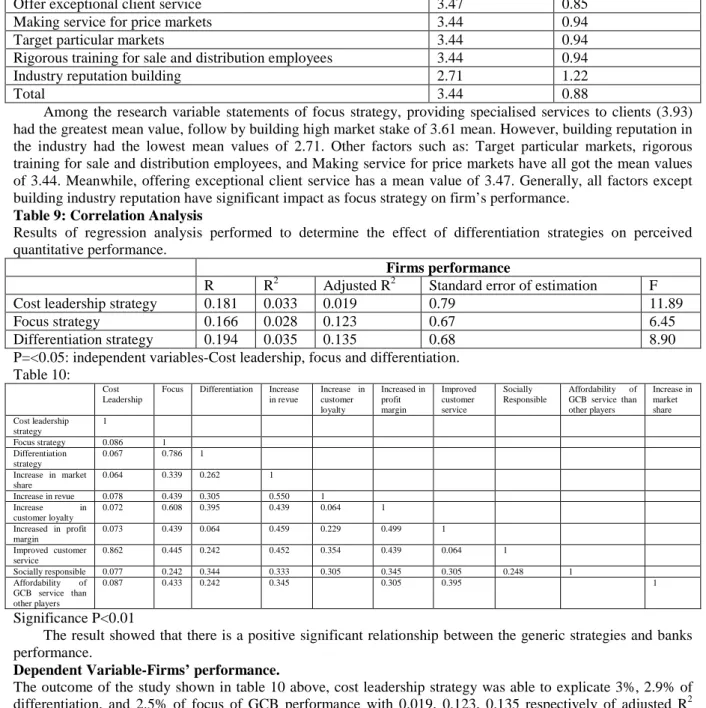
Table 8: Focus
Variables Mean Std. Deviation
Providing specialised services to clients 3.93 0.79
Building high market stake 3.61 0.87
Offer exceptional client service 3.47 0.85
Making service for price markets 3.44 0.94
Target particular markets 3.44 0.94
Rigorous training for sale and distribution employees 3.44 0.94
Industry reputation building 2.71 1.22
Total 3.44 0.88
Among the research variable statements of focus strategy, providing specialised services to clients (3.93) had the greatest mean value, follow by building high market stake of 3.61 mean. However, building reputation in the industry had the lowest mean values of 2.71. Other factors such as: Target particular markets, rigorous training for sale and distribution employees, and Making service for price markets have all got the mean values of 3.44. Meanwhile, offering exceptional client service has a mean value of 3.47. Generally, all factors except building industry reputation have significant impact as focus strategy on firm’s performance.
Table 9: Correlation Analysis
Results of regression analysis performed to determine the effect of differentiation strategies on perceived quantitative performance.
Firms performance
R R2 Adjusted R2 Standard error of estimation F
Cost leadership strategy 0.181 0.033 0.019 0.79 11.89
Focus strategy 0.166 0.028 0.123 0.67 6.45
Differentiation strategy 0.194 0.035 0.135 0.68 8.90
P=<0.05: independent variables-Cost leadership, focus and differentiation. Table 10:
Cost Leadership
Focus Differentiation Increase in revue Increase in customer loyalty Increased in profit margin Improved customer service Socially Responsible Affordability of GCB service than other players Increase in market share Cost leadership strategy 1 Focus strategy 0.086 1 Differentiation strategy 0.067 0.786 1 Increase in market share 0.064 0.339 0.262 1 Increase in revue 0.078 0.439 0.305 0.550 1 Increase in customer loyalty 0.072 0.608 0.395 0.439 0.064 1 Increased in profit margin 0.073 0.439 0.064 0.459 0.229 0.499 1 Improved customer service 0.862 0.445 0.242 0.452 0.354 0.439 0.064 1 Socially responsible 0.077 0.242 0.344 0.333 0.305 0.345 0.305 0.248 1 Affordability of GCB service than other players 0.087 0.433 0.242 0.345 0.305 0.395 1 Significance P<0.01
The result showed that there is a positive significant relationship between the generic strategies and banks performance.
Dependent Variable-Firms’ performance.
The outcome of the study shown in table 10 above, cost leadership strategy was able to explicate 3%, 2.9% of differentiation, and 2.5% of focus of GCB performance with 0.019, 0.123, 0.135 respectively of adjusted R2 which is positive and shows that, there is a significant association between variables.
Table 10: Effects of Competition on GCB
Variables Number Mean Std. Deviation
Increase in market share 200 2.33 0.54
Increase in revue 200 3.33 1.55
Increase in customer loyalty 200 3.34 1.22
Increased in profit margin 200 3.45 1.65
Improved customer service 200 2.56 0.82
Socially responsible 200 3.66 1.12
Affordability of GCB service than other players 200 3.55 0.93
Socially responsible 3.66 (1.12), affordability of GCB service than other players 3.55 (0.93), increased in profit margin 3.45 (1.65), Increase in customer loyalty 3.34 (1.22), increased in revue 3.33 (1.55), improved customer service 2.56 (0.82), and increased in market share 2.33 (0.54)
Testing hypothesis
The author applied regression analysis to test the hypotheses.
H1: Cost Leadership strategy correlates positively with bank’s performance H2: Focus strategy correlates positively with bank’s performance
H3: Differentiation strategy correlates positively with bank’s performance
Table 11: Generic Strategies and GCB performance via Multiple Regression Analysis
Non Standardised Standardised t Sig.
Beta Standard error Beta
Constant 3.184 0. 203 0.142 15.71 0.00
H1: Cost Leadership strategy correlates positively with banks performance
0.300 0.144 0.780 0.0040
Non Standardised Standardised t Sig.
Beta Standard error Beta
Constant 3.255 0.180 0.188 18.40 0.00
H2: Differentiation strategy correlates positively with banks performance
0.220 0.087 0.741 0.0050
Non Standardised Standardised t Sig.
Beta Standard error Beta
Constant 2.98 0.223 0.190 12.77 0.00
H3: Focus strategy
correlates positively with banks performance
1.120 0.120 1.103 0.0044
All the three hypothesis were accepted by the indication of the Beta values. Hence H1 (with Beta at 0.142), H2 (with Beta at 0.188), and H3 (with Beta at 0.190), were positive and prove the significant positive association between the variables.
Multiple regression analysis was conducted to establish the association between varied generic strategies-which are the independent variables of the study, and the firm’s performance-strategies-which the dependent variable. Considering the generic strategies and constant at zero performance of GCB, it is encouraging with cost leadership as a greater contributor to firm’s success and higher financial performance. The confidence level of cost leadership was 0.0040, 0.0050 for differentiation and focus at 0.0044. Increase in performance by low-cost is at 0.300, differentiation at 0.220 and 0.120 focus increase in performance. When cost leadership increased per unit, there is matching increase of 0.300 in Ghanaian commercial banks’ performance. When differentiation strategy increased per unit, there is matching increase of 0.220 in Ghanaian commercial banks’ performance. When focus strategy increased for each unit, there is corresponding increase of 0.120 in Ghanaian commercial banks’ performance.
Discussion
The main goal of the current study was to establish a relationship between generic strategies and firm’s performance in the banking sector. The result of the research entirely supported that, the generic strategies are basis for banks’ financial and non-financial performance. This is consistent with the traditional understanding by Porter (1980) that the generic strategies increase firm’s performance, increase market share and profitability (Hoque, 2004).
Conclusions
Generic strategies have the goal of sustaining competitive advantage and obtaining profitability. Generic strategies were observed to be most widely researched topic in the literature of business and competitive strategy. The outcome of the findings on the competitive strategies used in Ghana Commercial Bank (GCB), it can be inferred that cost leadership, focus and differentiation strategies are highly practiced. The advice is that any firm that prefers to focus should focus on narrow segment with that segment endeavour to obtain differentiation or cost advantage. This enable the firm to enjoy high level of customer loyalty and this will discourage new entrants from direct competition. Firms that prefers cost leadership strategy should concentrate on achieving competitive edge by having industry’s lowest cost. With the lowest cost in the industry, the firm can sell its services/products at prices below industry average to achieve high market share. Also, as low cost firm, firm can sell for profitability at average industry prices. Nonetheless, the firm must do environmental
assessment to identify the source of industry competitors, and then develop appropriate strategies that match firm’s capabilities in order to gain competitive advantage.
References
Abratt & Dion, 2006). Implementing Strategies Successfully. Integrated Manufacturing Systems, 13(6), 415-418.
Acquaah, M. Adjei, M. and Mensah-Bonsu, I. F. (2008). Competitive Strategy, Environmental Characteristics and Performance in African Emerging Economies: Lessons from Firms in Ghana. Journal of African Business 9(1), 90-155 Allen, R. S. & Helms, M. M. (2006). Linking Strategic Practices and Organizational Performance to Porter's Generic
Strategies. Business Process Management Journal, 12(4), 433-454.
Aukkh,F., & Kotabe, C and Teegen V. (2002). Perceptions of strategic priorities, consensus and firm performance. Journal of management Studies, 34(2), 241-258
Awour, B. (2011). Managing Human Resources for Successful Strategy Execution. Health Care Manager Journal. 29(2), 166-171.
Barney, J. B., & Hesterly, W. S. (2006). Strategic management and competitive advantage. Upper Saddle River, NJ: Pearson Education.
Besanko, D., Dranave, D., Shanley, M., and Schaefer, S. (2006). Economics of Strategy, (6th ed). Wiley
Brakaj, E. P., Kume V., & Cipi, A. (2015). The Impact of Generic Competitive Strategies on Organizational Performance. The Evidence from Albanian Contex. European Scientific Journal, 11(28). 1857 – 788
Campbell-Hunt, C. (2010). What we have learned about generic competitive strategy? A meta-analysis. Strategic Management Journal, 21 (2000), 127-154
Cheah, C. Y. J., Kang, J., & Chew, D. A. S. (2007). Strategic analysis of large local construction firm in China. Construction Management and Economics, 25(1), 25-38.
Davidson, S. (2001). Seizing the competitive advantage. Community Banker, 10(8), 32-47.
El-kelety (2006). An Interview with Michael Porter. Academy of Management Executive, 16(2), 43-52
Gitonga, S. (2003). Corporate Strategy – 4th Chinese Edition in Basic Chinese, China Market Press, Portico Inc., Beijing. Ghemawat, 2010). Stock market returns and inflation: evidence from other countries. Journal of Finance 38, 49-65.
Gan, C., Lee, M., Young, H. W. A. and Zhang, J., (2006). Macroeconomic Variables and Stock Market Interaction: New Zealand Evidence. Investment Management and Financial Innovations, 3(4)
Hansen, Dibrell, and Down (2006). Time-based differentiation – an old strategic hat or an effective strategic choice: An empirical investigation. European Business Review, 14(3), 184-193.
Charles W.L. Hill, C. W. L., and Jones, G. R. (2001). Strategic Management: an integrated approach, (5th ed). Houghton Mifflin, Boston USA,
Hyatt, H. (2001). Evaluating structural equation models with unobservable variables and measurement error. Journal of Marketing Research, 18(1), 39-50.
Hill, C. W. L., & Jones, G. R. (2004). Strategic management: An integrative approach (6th ed.). Boston: Houghton Mifflin Hitt, Ireland and Hoskisson (2009). A set-by-step approach to using the SAS system for factor analysis and structural
equation modelling. SAS Institute, Cary: NC.
Hahn, W. & Powers. T. L. (2010). Strategic plan quality, implementation capability, and firm performance. Academy of Strategic Management Journal, 9(1), 63-81.
Jobber, D. (2004) Principles and Practice of Marketing. 4th Edition, McGraw-Hill International, London. Johnson, G. and Scholes, K. (2002). Exploring corporate strategy. New York: Prentice Hall.
Johnson, G. and Scholes, K. (2000). Exploring corporate strategy. New York: Prentice Hall.
Johnson, G., Scholes, K., and Whittington, R. (2008). Exploring Corporate Strategy: Text & Cases, (8th Ed). Lancaster University School of Management.
Johnson, G., Whittington, R.and Scholes, K. (2011). Exploring strategy.Text and cases (9th ed). London: Financial Times prentice Hall.
Kim, E., Nam, D., & Stipert, J. L. (2004). The Applicability of Porter’s Generic Strategies in the Digital Age: Assumptions, Conjectures, and Suggestions. Journal of Management 30(5), 569-589
Kim, E., Nam, D., & Stipert, J. L. (2003). The applicability of Porter’s generic strategies in the digital age: assumptions, conjectures, and suggestions. Journal of Management 2 (3): 59- 69.
Kinyuira, D. (2014). Effects of Porter’s Generic Competitive Strategies on the Performance of Savings and Credit Cooperatives (Saccos) in Murang’a County, Kenya. Journal of Business and Management, 16(6), 93-105.
Kotler, P. and Armstrong, G. (2001). Principles of Marketing (10th Ed.). McGraw Hill.
Helms, Clay, and Peter (2007). Pure Versus Hybrid: Performance Implications of Porter’s Generic Strategies. Health Care Management Review, 22(4), 47-60.
Livvaran D. (2007). The effectiveness of strategies employed by dominant firms in the Portuguese crystal glass industry: An empirical investigation. European Business Review, 12(1), 34- 40
Lynch, R. (2003). Corporate Strategy, (3rd Ed), Financial Times/Prentice Hall, Harlow, 834– 351
Leitner, K., and Guldenberg, S. (2010). Generic strategies and firm performance in SMEs: A longitudinal study of Austrian SMEs. Small Business Economics 35(2), 169-189 ·
Malburg, Chris. (2000). Competing on Costs. Industry Week, 249117: 31.
Ngigi E., & Njeru, S. (2014). Price and Production Policies of Large-Scale Enterprises. American Economic Review, 29(1), p. 61-74.
Ovidiu et al. 2009). On the border as theatrical space: appearance, dis-location and the production of the refugee. In J. Kelleher, & N. Ridout (Eds.), Contemporary theatres in Europe: A critical companion. New York: Routledge.
Ormanidhi, O. & Stringa, O. (2008). Porter’s model of generic competitive strategies. Business Economics, 43(3), 55-64. Pearce, J. Robinson, A., & Richard B. (2010). Strategic Management. McGraw Hill Higher Education.
Porter (2005). How Competitive Forces Shape Strategy. Harvard Business Review, March-April, 137-145. Porter (2008). Generic Competitive Strategies–An Analytical Approach. Strategic Management Journal, 5, 367–380. Porter M. E. (1980). Competitive Strategy: Techniques for Analyzing Industries and Competitors. New York, NY: Free
Press.
Porter, M. E. (1985). Competitive Advantage: Creating and Sustaining Superior Performance. Porter, M. E. (1980). Competitive Strategy. New York, NY: Free Press.
Reilly, M. (2002). Targeting Multiple Biological Pathways as a Strategy to Improve the Treatment of Cancer. Clinical Research, 8(8), 3309-3310
Porter, M. E. (2008). The five competitive forces that shape strategy. Harvard Business Review.
Pertusa-Ortaga, E. M., Jose, F. M., & Claver-Cortés E. (2009). Competitive strategy, structure and firm performance: A comparison of the resource-based view and the contingency approach
Polit, D. F.. and Beck, C. T. (2004). Nursing Research Principles and Methods. 7th Edition, Lippincott Williams & Wilkins, Philadelphia.
Saunders, M., Mann, R. & Smith, R. (2007). Implementing Strategic Initiatives: A Framework of Leading Practices. International Journal of Operations & Production 28(11), 1095-1123.
Saunders, M., Lewis, P., Thornhill, A. (2009). Research Methods for Business Students, (5th ed), Prentice Hall. Stickland and Gamble, J. H. (2008). Cases in Crafting and Executing Strategy. McGraw-Hill
Spanos Y., Zaralis G. & Lioukas S. (2004). Strategy and Industry Effects on Profitability: Evidence from Greece.
Sy, B. (2002). Product Quality, Cost Position, and Business Performance: A Test of Some Key Hypotheses. Journal of Marketing, 47(2), 26-43.
Spanos, Zarakis & Lioukas, 2004). Strategy and industry effects on profitability: Evidence from Greece. Strategic Management Journal, 25(4), 139-165.
Thomas, Strickland, and Gamble (2008). Strategic Management. McGraw-Hill Education
Thompson, A. and Sticker, A. (2007). Critical junctures in spin-outs from universities. Research Policy 33:147-175. Venu, S. (2001). India: Competitive Advantage: Alternative Scenarios. Businessline, October 12, 1.
Wit M. & Meyer, B. (2002). A Refinement of Porter's Strategies,” Strategic Management Journal, 8(1), 93-101. Yamane, T. (1967). Statistics; an Introductory. Analysis. A Harper International Edition. New York University. Zahra SA (2000). New ventures’ learning in distant markets: The case of China. In: H. Li and M. Hitt (eds) Growth