Chapter VIII
Web Cost Estimation:
An Introduction
Emilia Mendes, University of Auckland, New Zealand
Nile Mosley, MetriQ (NZ) Limited, New Zealand
Abstract
Despite the diversity of Web application types, technologies employed, and the number of free templates available on the Web, we still have a considerable amount of Web companies bidding and competing for as many Web projects as they can accommodate. Bidding and winning a proposal does not mean that the project will be developed within time and budget. Cost estimation can help managers manage projects adequately and bid for projects based on realistic and feasible costs and deadlines. The objective of this chapter is to briefly introduce cost estimation principles, followed by a literature review of Web cost estimation. Then we compare this literature according to set criteria.
Introduction
One of the top current Web search engines claims over 3 billion pages on its index1. In
December 2001, the number of Web sites on the Internet was 36,276,25 2.This just gives
a glimpse about the vastness of data available throughout the Web. The Web is being used as the delivery platform for numerous types of applications, ranging from
e-Copyright © 2005, Idea Group Inc. Copying or distributing in print or electronic forms without written commerce solutions with backend databases to personal static Web pages and even mystical Web sites where you can have an instant tarot reading!
The Standish Group’s Chaos report published in 2003 shows that out of the more than 40,000 completed IT projects they considered only 34 percent finished on time and within budget, with required features and functions (Morris 2003). The report suggests a set of success factors, including reliable effort estimates3. According to the report: “If the
measurement for success is based on cost and time, then having accurate estimates is essential to improving success rates.”
This chapter’s objective is to introduce Web cost estimation and to present previous work in the area, followed by a discussion of Web size measures, conclusions, and suggestions for future work.
Web Cost Estimation
Introduction to Cost Estimation
Several techniques for cost and effort estimation have been proposed over the last 30 years in software engineering, falling into three general categories (Shepperd, Schofield, & Kitchenham, 1996):
1. Expert Opinion: Expert opinion has been widely used. However, the means of deriving an estimate are not explicit and therefore not repeatable. Expert opinion, although always difficult to quantify, can be an effective estimating tool on its own or as an adjusting factor for algorithmic models (Gray, MacDonell, & Shepperd, 1999).
2. Algorithmic Models: Algorithmic models, to date the most popular in the literature, attempt to represent the relationship between effort and one or more project characteristics. The main “cost driver” used in such a model is usually taken to be some notion of software size (such as the number of lines of source code, number of pages, number of links). Algorithmic models need calibration or adjustment to local circumstances. Examples of algorithmic models are the COCOMO model (Boehm, 1981) and the SLIM model (Putnam, 1978).
3. Machine Learning: Machine learning techniques have in the last decade been used as a complement or alternative to the previous two categories. Examples include fuzzy logic models (Kumar, Krishna, & Satsangi, 1994), regression trees (Selby and Porter, 1998), neural networks (Srinivasan and Fisher, 1995), and case-based reasoning (Shepperd et al., 1996). A useful summary of these techniques is presented in Gray and MacDonell (1997b).
An advantage of algorithmic models over machine learning and expert opinion is that it allows users to see how a model derives its conclusions, an important factor for
verification as well as theory building and understanding of the process being modelled (Gray and MacDonell, 1997b). Algorithmic models need to be calibrated relative to the local environment in which they are used, considered by some to be an advantage (Kok, Kitchenham, & Kirakowski, 1990; DeMarco, 1982).
Over the past 15 years, numerous comparisons have been made in software engineering between the three categories of prediction techniques aforementioned, based on their prediction power (Gray and MacDonell, 1997a; Gray and MacDonell,1997b; Briand, El-Emam, Surmann, Wieczorek, & Maxwell, 1999; Briand, Langley, & Wieczorek, 2000; Jeffery, Ruhe, & Wieczorek, 2000; Jeffery, Ruhe, & Wieczorek, 2001; Myrtveit and Stensrud, 1999; Shepperd et al., 1996; Shepperd and Schofield, 1997; Kadoda, Cartwright, Chen, & Shepperd, 2001; Shepperd and Kadoda, 2001; Kemerer, 1987; Angelis and Stamelos, 2000; Finnie, Wittig, & Desharnais, 1997; Schofield, 1998; Hughes, 1997). However, as the datasets employed had differing characteristics (outliers, collinearity, number of features, number of cases, etc.) and engaged different comparative designs, it is of little surprise that no convergence has been obtained to date.
In addition, Shepperd and Kadoda (2001) suggest that there is a strong relationship between the success of a particular technique and training set size, nature of the “cost” function and characteristics of the dataset (outliers, collinearity, number of features, number of cases, etc.), concluding that the “best” prediction technique that can work on any type of dataset may be impossible to obtain.
Introduction to Web Cost Estimation
Over the last four years, researchers have proposed and compared cost estimation techniques for Web applications using industrial and student-based datasets (Morisio, Stamelos, Spahos, & Romano, 1999; Mendes, Counsell, & Mosley, 2000; Mendes, Mosley, & Counsell, 2001; Fewster and Mendes 2001; Mendes, Mosley, & Counsell, 2002a; Mendes, Watson, Triggs, Mosley, & Counsell, 2002b; Mendes, Mosley, & Counsell, 2003; Baresi, Morasca, & Paolini, 2002; Baresi, Morasca, & Paolini, 2003; Ruhe, Jeffery, & Wieczorek, 2003). The techniques employed to date to generate Web cost models have been case-based reasoning (CBR), linear and stepwise regressions and classification and regression trees. A detailed explanation of each of these techniques is presented in Mendes et al. (2002b).
Finally, the most common approaches to date to assess the predictive power of effort prediction models have been:
•
The Magniture of Relative Error (MRE) (Kemerer, 1987)•
The Mean Magnitude of Relative Error (MMRE) (Shepperd et al., 1996)•
The Median Magnitude of Relative Error (MdMRE) (Myrtveit & Stensrud, 1999)Copyright © 2005, Idea Group Inc. Copying or distributing in print or electronic forms without written MRE is the basis for calculating MMRE and MdMRE, and defined as:
MRE =
e eˆ e−
(1)
where e represents actual effort and ê estimated effort. The mean of all MREs is the MMRE, which is calculated as:
MMRE = ∑ = = − n i i i i i e e e n 1 ˆ 1 (2)
The mean takes into account the numerical value of every observation in the data distribution, and is sensitive to individual predictions with large MREs.
An alternative to the mean is the median, which also represents a measure of central tendency, however, it is less sensitive to extreme values. The median of MRE values for the number i of observations is called the MdMRE.
Another indicator which is commonly used is the Prediction at level l, also known as Pred(l). It measures the percentage of estimates that are within l percent of the actual values. Suggestions have been made (Conte, Dunsmore, & Shen, 1986) that l should be set at 25 percent and that a good prediction system should offer this accuracy level 75 percent of the time.
Although MMRE, MdMRE, and Pred(l) have emerged as the de facto standard evaluation criteria to assess the accuracy of cost estimation models (Stensrud, Foss, Kitchenham, & Myrtveit, 2002), recent work by Kitchenham, Pickard, MacDonnell, & Shepperd (2001) shows that MMRE and Pred(l) are respectively measures of the spread and kurtosis of
z, where (z =
e eˆ
). They suggest boxplots of z and boxplots of the residuals (e−eˆ) (Pickard, Kitchenham, & Linkman, 1999) as useful alternatives to simple summary measures since they can give a good indication of the distribution of residuals and z and can help explain summary statistics such as MMRE and Pred(25) (Kitchenham et al., 2001). Finally, researchers have also employed the EMRE (Magnitude of Relative Error relative to the Estimate) (Kitchenham et al., 2001). This measure, unlike MRE, uses the estimate as the divisor, and is defined as:
EMRE =
eˆ eˆ e−
Survey of Web Cost Estimation Models
This section presents a survey of Web cost estimation models proposed in the literature. Each work is described and finally summarised in Tables 16-17.
First Study: Measuring Functionality and Productivity in Web-Based
Applications: A Case Study (Morisio et al., 1999)
The aim of this study (Morisio et al. 1999) was to build cost estimation models to help Web development companies predict and track development costs when new technolo-gies are employed. This work gathered data on five Web applications developed using an object-oriented framework. Their cost estimation model takes into account the learning factor associated with writing new code that uses a framework, when this framework is used for the first time. They considered different types of reuse and the size measures employed were object-oriented function points and lines of code. Their cost models were generated using linear regression.
Their results showed that the cost of writing new code, represented by calls to components provided by the framework, is reduced as developers are more experienced in using the framework.
Second Study: Measurement and Effort Prediction for Web
Applications (Mendes et al., 2000)
Mendes et al. (2000) investigated the use of case-based reasoning, linear regression, and stepwise regression techniques to estimate development effort for Web applications developed by experienced or inexperienced students. The case-based reasoning estima-tions were generated using a freeware tool called ANGEL developed at the University of Bournemouth, UK. The most similar Web projects were retrieved using the unweighted Euclidean distance using the “leave one out” cross-validation. Estimated effort was generated using either the closest analogue or the mean of two or three analogues. The two datasets (HEL and LEL) employed had data on Web applications developed by second-year computer science students and had 29 and 41 data points respectively. HEL represented data from students with high experience in Web development, whereas LEL had data from inexperienced students. The size measures collected were page count (total number of HTML pages created from scratch), reused page count (total number of reused HTML pages), connectivity (total number of links in the application), compactness (Botafogo, Rivlin, & Shneiderman, 1992) (scale from one to five indicating the level of inter-connectedness in the application. One represents no connections and five repre-sented a totally connected application), Stratum (Botafogo et al. 1992), (scale from zero to one indicating how “linear” the application is. One represents no sequential naviga-tion and five represents totally sequential naviganaviga-tion) and structure (topology of the
Copyright © 2005, Idea Group Inc. Copying or distributing in print or electronic forms without written application’s backbone, being either sequential, hierarchical or network). Prediction accuracy was measured using MMRE and MdMRE. Results for the HEL group were statistically significantly better than those for the LEL group. In addition, case-based reasoning showed the best results overall.
Third Study: Web development: Estimating Quick-to-Market Software
(Reifer, 2000)
Reifer (2000) proposed a Web cost estimation model, WEBMO, which is an extension of the COCOMO II model. The WEBMO model has nine cost drivers and a fixed effort power law, instead of seven cost drivers and variable effort power law as used in the COCOMO II model. Size is measured in Web objects, which are calculated by applying Halstead’s formula for volume. They are based on sub-components such as: number of building blocks (Active X, DCOM, OLE, etc.), number of COTS components (includes any wrapper code), number of multimedia files, except graphics files (text, video, sound, etc.), number of object or application points (Cowderoy, 2000) or others proposed (number server data tables, number client data tables etc.), number of xml, sgml, html and query language lines (number lines including links to data attributes), number of Web components (applets, agents, etc.), number of graphics files (templates, images, pictures, etc.), number of scripts (visual language, audio, motion, etc.) and any other measures that companies find suitable. Reifer allegedly used data on 46 finished industrial Web projects and obtained predictions which are “repeatable and robust.” However, no information is given regarding the data collection nor any summary statistics for the data.
Fourth Study: Web Metrics - Estimating Design and Authoring Effort
(Mendes et al., 2001)
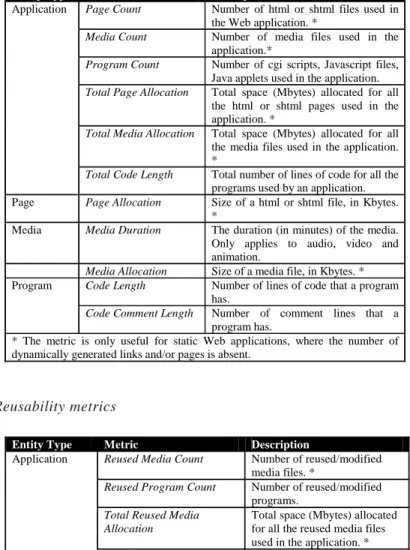
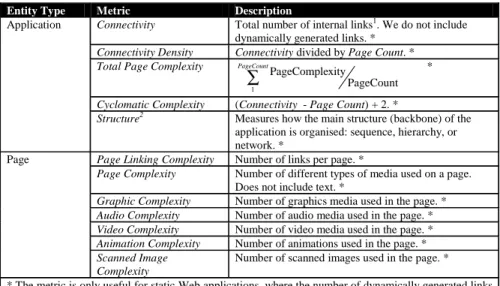
Mendes et al. (2001) investigated the prediction accuracy of top-down and bottom-up Web cost estimation models, generated using linear and stepwise multiple regression models. They employed one dataset with data on 37 Web applications developed by honours and postgraduate computer science students. Gathered measures were organised into five categories: length size, reusability, complexity size, effort, and confounding factors (factors that, if not controlled, could influence the validity of the evaluation), and are associated to one of the following entities: application, page, media and program. Measures for each category are presented in Tables 1-5. Prediction models were generated for each entity and prediction accuracy was measured using the MMRE metric. Results showed that the best predictions were obtained for the entity program, based on non-reused program measures (code length and code comment length).
Table 1. Size metrics
Entity Type Metric Description
Page Count Number of html or shtml files used in
the Web application. *
Media Count Number of media files used in the
application.*
Program Count Number of cgi scripts, Javascript files, Java applets used in the application.
Total Page Allocation Total space (Mbytes) allocated for all the html or shtml pages used in the application. *
Total Media Allocation Total space (Mbytes) allocated for all the media files used in the application. *
Application
Total Code Length Total number of lines of code for all the programs used by an application. Page Page Allocation Size of a html or shtml file, in Kbytes.
*
Media Media Duration The duration (in minutes) of the media. Only applies to audio, video and animation.
Media Allocation Size of a media file, in Kbytes. *
Code Length Number of lines of code that a program
has. Program
Code Comment Length Number of comment lines that a
program has.
* The metric is only useful for static Web applications, where the number of dynamically generated links and/or pages is absent.
Table 2. Reusability metrics
Entity Type Metric Description
Reused Media Count Number of reused/modified
media files. *
Reused Program Count Number of reused/modified
programs.
Total Reused Media Allocation
Total space (Mbytes) allocated for all the reused media files used in the application. * Application
Total Reused Code Length Total number of lines of code for all the programs reused by an application.
Reused Code Length Number of reused lines of
code. Program
Reused Comment Length Number of reused comment
lines.
* The metric is only useful for static Web applications, where the number of dynamically generated links and/or pages is absent.
Copyright © 2005, Idea Group Inc. Copying or distributing in print or electronic forms without written
Table 3. Complexity metrics
Entity Type Metric Description
Connectivity Total number of internal links1. We do not include
dynamically generated links. *
Connectivity Density Connectivity divided by Page Count. * Total Page Complexity *
Cyclomatic Complexity (Connectivity - Page Count) + 2. * Application
Structure2 Measures how the main structure (backbone) of the
application is organised: sequence, hierarchy, or network. *
Page Linking Complexity Number of links per page. *
Page Complexity Number of different types of media used on a page. Does not include text. *
Graphic Complexity Number of graphics media used in the page. *
Audio Complexity Number of audio media used in the page. *
Video Complexity Number of video media used in the page. *
Animation Complexity Number of animations used in the page. * Page
Scanned Image Complexity
Number of scanned images used in the page. * * The metric is only useful for static Web applications, where the number of dynamically generated links and/or pages is absent.
∑
PageCount1 PageCount
xity PageComple
Table 4. Effort Metrics
Entity Type Metric Description
Total Effort Structuring Effort + InterLinking Effort + Interface Planning + Interface Building + Link Testing Effort + Media Testing Effort
Structuring Effort Estimated elapsed time (number of hours) it took a subject to structure an application.
InterLinking Effort Estimated elapsed time (number of hours) it took a subject to inter-link the pages in order to build the application’s structure. *
Interface Planning Estimated elapsed time (number of hours) it took a subject to plan the application’s interface.
Interface Building Estimated elapsed time (number of hours) it took a subject to implement the application’s interface.
Link Testing Effort Estimated elapsed time (number of hours) it took a subject to test all the links on an application. * Application
authoring and designing Tasks
Media Testing Effort Estimated elapsed time (number of hours) it took a subject to test all the media on an application. *
Total Page Effort Text Effort + Page Linking Effort + Page Structuring Effort
Text Effort Estimated elapsed time (number of hours) it took a subject to author or reuse text in a page.*
Page Linking Effort Estimated elapsed time (number of hours) it took a subject to author the links in a page.*
Page Authoring Task
Page Structuring Effort Estimated elapsed time (number of hours) it took a subject to structure a page.
Media Effort Estimated elapsed time (number of hours) it took a subject to author or reuse a media file.
Media Digitise Effort Estimated elapsed time (number of hours) it took a subject to digitise a media.
Media Authoring Task
Total Media Effort Media Effort + Media Digitise Effort
Program Authoring Task
Program Effort Estimated elapsed time (number of hours) it took a subject to author or reuse a program.
* The metric is only useful for static Web applications, where the number of dynamically generated links and/or pages is absent.
Fifth Study: Measurement, Prediction, and Risk Analysis for Web
Applications (Fewster & Mendes, 2001)
Fester and Mendes (2001) investigated the used of proposed a generalised linear model (GLM) for Web cost estimation. Generalised linear models provide a flexible regression framework for predictive modeling of effort. The models allow non-linear relationships between response and predictor variables, and they allow for a wide range of choices for the distribution of the response variable (e.g., effort).
Fester and Mendes (2001) employed the same dataset used in Mendes et al. (2001), however they reduced the number of size measures targeting at only the entity type application. These measures were organised into five categories: effort metrics, structure metrics, complexity metrics, reuse metrics and size metrics (see Tables 6-10).
In addition to proposing a prediction model, they also investigate the use of the GLM model as a framework for risk management. They did not measure prediction accuracy but relied on the model fit produced for the model. However a model with a good fit to the data is not the same as a good prediction model.
Table 5. Confounding factors
Entity Type Metric Description
Developer Experience Measures the authoring/design experience of a subject using a scale from 0 (no experience) to 4 (very good experience).
Tool Type Measures the type of tool used to author/design the Web pages: WYSIWYG, semi-WYSIWYG1 or text-based.
Table 6. Size metrics
Table 7. Reusability metrics
Entity Type Metric Description
Page Count Number of html or shtml files used in the Web application. *
Media Count Number of media files used in the application.*
Program Count Number of cgi scripts, Javascript files, Java applets used in the application.
Total Page Allocation Total space (Mbytes) allocated for all the html or shtml pages used in the application. *
Total Media Allocation Total space (Mbytes) allocated for all the media files used in the application. *
Application
Total Code Length Total number of lines of code for all the programs used by an application.
Entity Type Metric Description
Reused Media Count Number of reused/modified media files. *
Reused Program Count Number of reused/modified programs.
Total Reused Media Allocation Total space (Mbytes) allocated for all the reused
media files used in the application. * Application
Total Reused Code Length Total number of lines of code for all the programs reused by an application.
Copyright © 2005, Idea Group Inc. Copying or distributing in print or electronic forms without written
Sixth Study: The Application of Case-Based Reasoning to Early Web
Project Cost Estimation (Mendes et al., 2002a)
Most work on Web cost estimation proposes models based on late product size measures, such as number of HTML pages, number of images etc. However, for the successful management of software/Web projects, estimates are necessary throughout the whole development life cycle. Preliminary (early) effort estimates in particular are essential when bidding for a contract or when determining a project’s feasibility in terms of cost-benefit analysis. Mendes et al. (2002a) focus on the harvesting of size measures at different points in the Web development life cycle, to estimate development effort, and
Table 8. Complexity metrics
Table 9. Effort metrics
Table 10. Confounding factors
Entity Type Metric Description
Connectivity Total number of internal links1. We do not include dynamically
generated links. *
Connectivity Density Connectivity divided by Page Count. * Total Page Complexity *
Cyclomatic Complexity (Connectivity - Page Count) + 2. * Application
Structure2 Measures how the main structure (backbone) of the application
is organised. * ∑ PageCount 1 PageCount page a in media types diff. Numb.
Entity Type Metric Description
Total Effort Structuring Effort + InterLinking Effort + Interface Planning + Interface Building + Link Testing Effort + Media Testing Effort *
Structuring Effort Estimated elapsed time (number of hours) it took a subject to structure an application.
InterLinking Effort Estimated elapsed time (number of hours) it took a subject to inter-link the pages in order to build the application’s structure. *
Interface Planning Estimated elapsed time (number of hours) it took a subject to plan the application’s interface.
Interface Building Estimated elapsed time (number of hours) it took a subject to implement the application’s interface.
Link Testing Effort Estimated elapsed time (number of hours) it took a subject to test all the links on an application. *
Application authoring and designing Tasks
Media Testing Effort Estimated elapsed time (number of hours) it took a subject to test all the media on an application. *
Entity Type Metric Description
Developer Experience Measures the authoring/design experience of a subject using a scale from 0 (no experience) to 4 (very good experience).
Tool Type Measures the type of tool used to author/design the Web pages: WYSIWYG, semi-WYSIWYG or text-based.
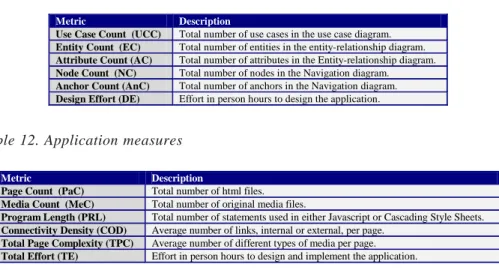
their comparison based on several prediction accuracy indicators. Their aim was to investigate how different cost predictors are, and if there are any statistically significant differences between them. Their effort estimation models were generated using case-based reasoning, where several different parameters were used: similarity measure; scaling; number of closest analogues; analogy adaptation; and feature subset selection. Their study was based on data from 25 Web applications developed by pairs of postgraduate computer science students. The size measures employed are presented in Tables 11-12. The measures of prediction accuracy employed were the MMRE, MdMRE, Pred(25) and Boxplots of residuals.
Seventh Study: A Comparison of Development Effort Estimation
Techniques for Web Hypermedia Applications (Mendes et al., 2002b)
An in depth comparison of Web cost estimation models is presented in Mendes et al. (2002b), where they: (1) compare the prediction accuracy of three CBR techniques to estimate the effort to develop Web applications and (2) compare the prediction accuracy of the best CBR technique, according to our findings, against three commonly used prediction models, namely multiple linear regression, stepwise regression, and regres-sion trees. They employed one dataset of 37 Web applications developed by honours and postgraduate computer science students and the measures used are: page count (number of html or shtml files used in the application), media count (number of media files used in the application), program count (number of JavaScript files and Java applets used in the application), reused media count (number of reused/modified media files), reused program count (number of reused/modified programs), connectivity density (total number of internal links3 divided by page count), total page complexity (average number
of different types of media per page) and total effort (effort in person hours to design and author the application).
Table 11. Requirements and design measures
Table 12. Application measures
Metric Description
Use Case Count (UCC) Total number of use cases in the use case diagram.
Entity Count (EC) Total number of entities in the entity-relationship diagram.
Attribute Count (AC) Total number of attributes in the Entity-relationship diagram.
Node Count (NC) Total number of nodes in the Navigation diagram.
Anchor Count (AnC) Total number of anchors in the Navigation diagram.
Design Effort (DE) Effort in person hours to design the application.
Metric Description
Page Count (PaC) Total number of html files.
Media Count (MeC) Total number of original media files.
Program Length (PRL) Total number of statements used in either Javascript or Cascading Style Sheets.
Connectivity Density (COD) Average number of links, internal or external, per page.
Total Page Complexity (TPC) Average number of different types of media per page.
Copyright © 2005, Idea Group Inc. Copying or distributing in print or electronic forms without written Regarding the use of case-based reasoning, they employed several parameters, as follows: three similarity measures (unweighted Euclidean, weighted Euclidean, and maximum), three choices for the number of analogies (1, 2, and 3), three choices for the analogy adaptation (mean, inverse rank weighted mean, and median) and two alternatives regarding the standardisation of the attributes (“Yes” for standardised and “No” for not standardised). Prediction accuracy was measured using MMRE, MdMRE, Pred(25) and boxplots of residuals. Their results showed that different measures of prediction accuracy gave different results. MMRE and MdMRE showed better prediction accuracy for Multiple regression models whereas boxplots showed better accuracy for CBR.
Eighth Study: An Empirical Study on the Design Effort of Web
Applications (Baresi et al., 2002)
Baresi et al. (2002) conduct an exploratory study, where, using an experiment, several hypotheses are tested. Amongst these, the study investigates whether estimated effort provided by students can be used to estimate actual effort. Their results show that it is possible to use the estimated values as predictors for the actual ones, however other variables, such as size, also need to be incorporated to the model to make it more realistic and meaningful. The dataset they used had data on 39 Web applications developed by computer science students.
Ninth Study: Cost Estimation for Web Applications (Ruhe et al., 2003)
The aim of Ruhe et al.’s study (2003) was to assess whether the COBRATM4 (Cost
Estimation Benchmarking and Risk Analysis) method was adequate for estimating Web development effort accurately using data from a small Web company. COBRA is a method that aims to develop an understandable cost estimation model based on a company-specific dataset. It uses expert opinion and data on past projects to estimate development effort and risks for a new project. The size measure employed was Web objects (Reifer 2000), measured for each one of the 12 finished Web applications used in this study. The prediction accuracy obtained using COBRA was compared to those attained employing expert opinion and linear regression, all measured using MMRE and Pred(25), giving COBRA the most accurate results.
Tenth Study: Do Adaptation Rules Improve Web Cost Estimation?
(Mendes et al., 2003)
This study (Mendes et al. 2003a) compared several methods of CBR-based effort estimation, investigating the use of adaptation rules as a contributing factor for better estimation accuracy. They used two datasets, where the difference between these datasets was the level of “messiness” each had. “Messiness” was evaluated by the number of outliers and the amount of collinearity (Shepperd & Kadoda, 2001). The dataset which was less “messy” than the other presented a continuous “cost” function,
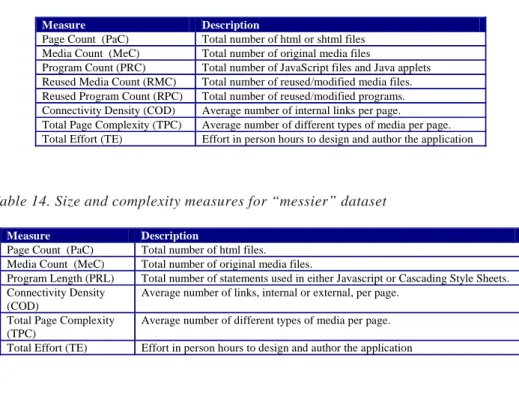
translated as a strong linear relationship between size and effort. The “messiest” dataset, on the other hand, presented a discontinuous “cost” function, where there was no linear or log-linear relationship between size and effort. Both datasets represented data on Web applications developed by students. Two types of adaptation were used, one with weights and another without weights (Mendes et al. 2003). None of the adaptation rules gave better predictions for the “messier” dataset, however for the less “messy” dataset one type of adaptation rule (no weights) gave good prediction accuracy. Prediction accuracy was measured using MMRE, Pred(25) and boxplots of absolute residuals. The measures for both datasets are presented in Tables 13-14.
Eleventh Study: Estimating the Design Effort of Web Applications
(Baresi et al., 2003)
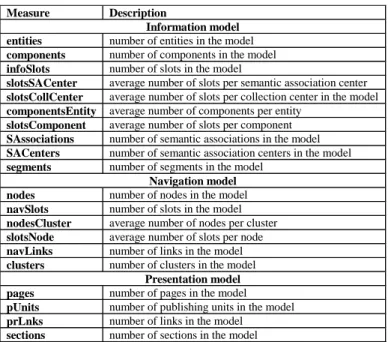
Baresi et al. (2003) investigated the relationship between a number of size measures obtained from W2000 design artifacts and the total effort needed to design web applications. Their size measures were organised in categories and presented in detail in Table 15. The categories employed were information model, navigation model and presentation model. They identified a few attributes that may be related to the total design effort. In addition, they also carried out a finer-grain analysis, studying which of the used measures have an impact on the design effort when using W2000. Their dataset comprised 30 Web applications developed by students.
Table 13. Size and complexity measures for less “messy” dataset
Table 14. Size and complexity measures for “messier” dataset
Measure Description
Page Count (PaC) Total number of html or shtml files Media Count (MeC) Total number of original media files
Program Count (PRC) Total number of JavaScript files and Java applets Reused Media Count (RMC) Total number of reused/modified media files. Reused Program Count (RPC) Total number of reused/modified programs. Connectivity Density (COD) Average number of internal links per page. Total Page Complexity (TPC) Average number of different types of media per page. Total Effort (TE) Effort in person hours to design and author the application
Measure Description
Page Count (PaC) Total number of html files. Media Count (MeC) Total number of original media files.
Program Length (PRL) Total number of statements used in either Javascript or Cascading Style Sheets. Connectivity Density
(COD)
Average number of links, internal or external, per page. Total Page Complexity
(TPC)
Average number of different types of media per page. Total Effort (TE) Effort in person hours to design and author the application
Copyright © 2005, Idea Group Inc. Copying or distributing in print or electronic forms without written
Table 15. Measures for design model
Measure Description Information model
entities number of entities in the model
components number of components in the model
infoSlots number of slots in the model
slotsSACenter average number of slots per semantic association center
slotsCollCenter average number of slots per collection center in the model
componentsEntity average number of components per entity
slotsComponent average number of slots per component
SAssociations number of semantic associations in the model
SACenters number of semantic association centers in the model
segments number of segments in the model
Navigation model
nodes number of nodes in the model
navSlots number of slots in the model
nodesCluster average number of nodes per cluster
slotsNode average number of slots per node
navLinks number of links in the model
clusters number of clusters in the model
Presentation model
pages number of pages in the model
pUnits number of publishing units in the model
prLnks number of links in the model
sections number of sections in the model
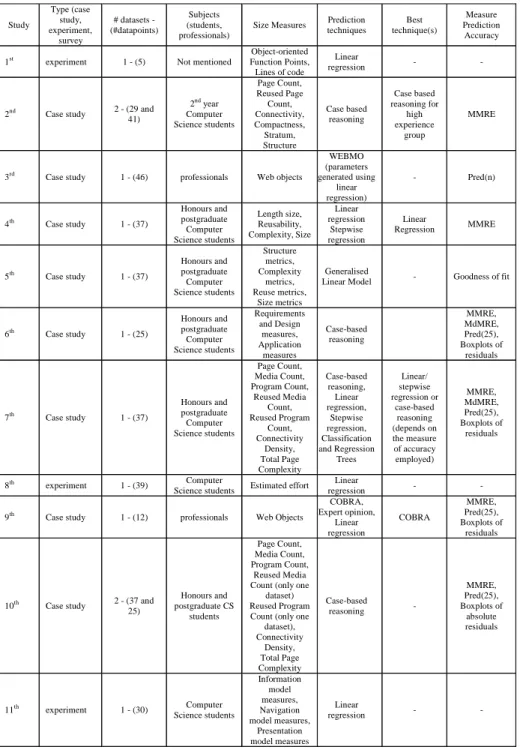
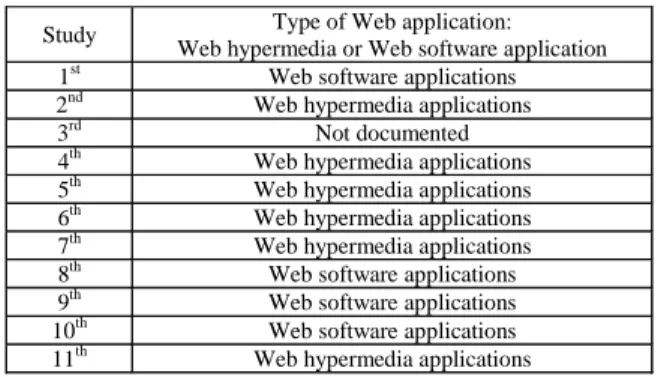
Table 16 summarises the studies presented previously and show a few trends such as: the prediction technique used the most is linear regression; the measures of prediction accuracy employed the most are MMRE and Pred(25); the size of the datasets employed is small and not greater than 46 data points; and size measures were not constant throughout studies, which indicates the lack of standards to sizing Web applications. Another perspective in which we can look at previous work is determining what type of Web applications were used in the empirical studies, since they can be classified as Web hypermedia applications or Web software applications (Christodoulou, Zafiris, & Papatheodorou, 2000). A Web hypermedia application is a non-conventional application characterised by the authoring of information using nodes (chunks of information), links (relations between nodes), anchors, access structures (for navigation) and its delivery over the Web. Technologies commonly used for developing such applications are HTML, JavaScript, and multimedia. In addition, typical developers are writers, artists, and organisations that wish to publish information on the Web and/or CD-ROMs without the need to use programming languages such as Java.
Conversely, a Web software application represents conventional software applications that depend on the Web or use the Web’s infrastructure for execution. Typical applica-tions include legacy information systems such as databases, booking systems, and knowledge bases. Many e-commerce applications fall into this category. Typically they employ technology such as components off-the-shelf, like DCOM, OLE, ActiveX, XML, PHP, dynamic HTML, databases, and development solutions such as J2EE. Developers are young programmers fresh from a computer science or software engineering degree,
Table 16. Summary of literature in Web cost estimation Study Type (case study, experiment, survey # datasets - (#datapoints) Subjects (students, professionals)
Size Measures Prediction techniques Best technique(s) Measure Prediction Accuracy
1st experiment 1 - (5) Not mentioned Function Points, Object-oriented
Lines of code
Linear
regression - -
2nd Case study 2 - (29 and
41) 2nd year Computer Science students Page Count, Reused Page Count, Connectivity, Compactness, Stratum, Structure Case based reasoning Case based reasoning for high experience group MMRE
3rd Case study 1 - (46) professionals Web objects
WEBMO (parameters generated using linear regression) - Pred(n) 4th Case study 1 - (37) Honours and postgraduate Computer Science students Length size, Reusability, Complexity, Size Linear regression Stepwise regression Linear Regression MMRE 5th Case study 1 - (37) Honours and postgraduate Computer Science students Structure metrics, Complexity metrics, Reuse metrics, Size metrics Generalised
Linear Model - Goodness of fit
6th Case study 1 - (25) Honours and postgraduate Computer Science students Requirements and Design measures, Application measures Case-based reasoning MMRE, MdMRE, Pred(25), Boxplots of residuals 7th Case study 1 - (37) Honours and postgraduate Computer Science students Page Count, Media Count, Program Count, Reused Media Count, Reused Program Count, Connectivity Density, Total Page Complexity Case-based reasoning, Linear regression, Stepwise regression, Classification and Regression Trees Linear/ stepwise regression or case-based reasoning (depends on the measure of accuracy employed) MMRE, MdMRE, Pred(25), Boxplots of residuals 8th experiment 1 - (39) Computer
Science students Estimated effort Linear
regression - -
9th Case study 1 - (12) professionals Web Objects
COBRA, Expert opinion, Linear regression COBRA MMRE, Pred(25), Boxplots of residuals
10th Case study 2 - (37 and
25) Honours and postgraduate CS students Page Count, Media Count, Program Count, Reused Media Count (only one
dataset) Reused Program Count (only one
dataset), Connectivity Density, Total Page Complexity Case-based reasoning - MMRE, Pred(25), Boxplots of absolute residuals 11th experiment 1 - (30) Computer Science students Information model measures, Navigation model measures, Presentation model measures Linear regression - -
Copyright © 2005, Idea Group Inc. Copying or distributing in print or electronic forms without written managed by more senior staff. Table 17 presents the classification, indicating that six (55 percent), out of the 11 papers referenced in this section, have used datasets of Web hypermedia applications, and another four (36 percent), out of 11 papers, have used Web software applications.
Conclusion
Software practitioners recognise the importance of realistic estimates of effort to the successful management of software projects, the Web being no exception. Having realistic estimates at an early stage in a project’s life cycle allow project managers and development organisations to manage resources effectively.
In the context of Web development, cost estimation is also crucial, and very challenging given that:
•
Web projects have short schedules and a fluidic scope (Pressman, 2000).•
There is no standard to sizing Web applications since they can be created using diverse technologies such as several varieties of Java (Java, servlets, Enterprise java Beans, applets, and Java Server Pages), HTML, JavaScript, XML, XSL, and so on.•
Web development differs substantially from traditional approaches (Reifer, 2002).•
A Web project’s primary goal is to bring quality applications to market as quickly as possible, varying from a few weeks (Pressman, 2000) to six months (Reifer, 2002).•
People involved in Web development are represented by less experienced program-mers, users as developers, graphic designers and new hires straight from university (Reifer, 2002).Table 17. Types of Web applications used in Web cost estimation studies
Study Type of Web application: Web hypermedia or Web software application 1st Web software applications 2nd Web hypermedia applications 3rd Not documented 4th Web hypermedia applications 5th Web hypermedia applications
6th Web hypermedia applications
7th Web hypermedia applications
8th Web software applications
9th Web software applications
10th Web software applications 11th Web hypermedia applications
•
Typical project size is small, using three to seven team members (Reifer, 2002).•
Processes employed are in general ad hoc, although some organisations arestarting to look into the use of agile methods (Ambler, 2002).
This chapter has presented a survey of previous work in Web cost estimation and has summarised their findings. This helps organise the body of knowledge in Web cost estimation and also helps those who wish to research or to know more about the field. One of the trends found was that different size measures were employed by the different studies, suggesting the need for a standard size measure such that we can better compare and contrast results.
Another important point is the use of automated tools for automating data collection. None of the surveyed papers employed automated tools for measuring size, which also points to the need for automated tools to be developed such that we can reduce the errors inherent in data collection.
Finally, we have also shown that most studies were based on case studies rather than formal experiments. Although case studies are important and sometimes are the only way of obtaining not only data but also volunteers for the study, it is important to remember that their results only apply to the scope of the study, for example, their results cannot be generalised beyond the scope of the study. Therefore we urge the Web engineering community to also plan and run formal experiments as these will allow the building of a wider body of knowledge where findings can be generalised to a wider context.
References
Ambler, S.W. (2002). Lessons in agility from Internet-based development. IEEE
Soft-ware, Mar-Apr, (pp. 66-73).
Angelis, L., & Stamelos, I. (2000). A simulation tool for efficient analogy based cost estimation. Empirical Software Engineering, 5, (pp. 35-68).
Baresi, L., Morasca, S., & Paolini, P. (2002). An empirical study on the design effort for Web applications. Proceedings of WISE 2002, (pp. 345-354).
Baresi, L., Morasca, S., & Paolini, P. (2003). Estimating the design effort for Web applications. Proceedings of Metrics 2003 (pp. 62-72).
Boehm, B. (1981). Software engineering economics. Englewood Cliffs, NJ: Prentice-Hall.
Botafogo, R., Rivlin, A.E. & Shneiderman, B. (1992). Structural analysis of hypertexts: Identifying hierarchies and useful metrics. ACM TOIS, 10(2), (pp.143-179). Briand, L.C., El-Emam, K., Surmann, D., Wieczorek, I., & Maxwell, K.D. (1999). An
assessment and comparison of common cost estimation modelling techniques.
Copyright © 2005, Idea Group Inc. Copying or distributing in print or electronic forms without written Briand, L.C., Langley, T., & Wieczorek, I. (2000). A replicated assessment and
compari-son of common software cost modelling techniques. Proceedings ICSE 2000, Limerick, Ireland (pp. 377-386).
Christodoulou, S. P., Zafiris, P. A., & Papatheodorou, T. S. (2000). WWW 2000: The Developers’ View and Practitioner’s Approach to Web Engineering. Proceedings
of the 2nd ICSE Workshop Web Eng. (pp. 75-92).
Conte, S., Dunsmore, H., & Shen, V. (1986). Software engineering metrics and models. Menlo Park, CA: Benjamin/Cummings.
Cowderoy, A.J.C., (2000). Measures of size and complexity for Web site content.
Proceedings Combined 11th ESCOM Conference and the 3rd SCOPE conference
on Software Product Quality, Munich, Germany (pp. 423-431).
DeMarco, T., (1982). Controlling software projects: Management, measurement and
estimation. New York: Yourdon.
Fewster, R., & Mendes, E. (2001). Measurement, prediction and risk analysis for Web applications. Proceedings of Metrics ’01, London (pp. 338-348).
Finnie, G.R., Wittig, G.E., & Desharnais, J.M. (1997). A comparison of software effort estimation techniques: Using function points with neural networks, case-based reasoning and regression models. J. Systems and Software, 39, (pp. 281-289). Gray, A., & MacDonell, S. (1997a). Applications of fuzzy logic to software metric models
for development effort estimation. Proc. Annual Meeting of the North American
Fuzzy Information Processing Society - NAFIPS, Syracuse, New York (pp.
394-399). IEEE.
Gray, A.R., & MacDonell, S.G. (1997b). A comparison of model building techniques to develop predictive equations for software metrics. Information and Software
Technology, 39, (pp. 425-437).
Gray, R., MacDonell, S. G., & Shepperd, M. J. (1999). Factors systematically associated with errors in subjective estimates of software development effort: the stability of expert judgement. Proceedings IEEE 6th Metrics Symposium, (pp. 216-225).
Hughes, R.T., (1997). An empirical investigation into the estimation of software devel-opment effort. PhD thesis, Dept. of Computing, the University of Brighton, UK. Jeffery, R., Ruhe, M., & Wieczorek, I. (2000). A comparative study of two software
development cost modelling techniques using multi-organizational and company-specific data. Information and Software Technology, 42, (pp.1009-1016). Jeffery, R., Ruhe, M., & Wieczorek, I. (2001). Using public domain metrics to estimate
software development effort. Proceedings of IEEE 7th Metrics Symposium, London
(pp. 16-27).
Kadoda, G., Cartwright, M., Chen, L., & Shepperd, M.J. (2000). Experiences using case-based reasoning to predict software project effort. Proceedings EASE 2000
Conference, Keele, UK.
Kemerer, C.F. (1987). An empirical validation of software cost estimation models, CACM, 30(5), (pp. 416-429).
Kitchenham, B.A., Pickard, L.M., MacDonell, S.G., & Shepperd, M.J. (2001). What accuracy statistics really measure. IEE Proceedings of Software Engineering, 148(3), (pp. 81-85).
Kok, P., Kitchenham, B. A., & Kirakowski, J. (1990). The MERMAID Approach to software cost estimation. ESPRIT Annual Conference, Brussels, (pp. 296-314). Kumar, S., Krishna, B.A., & Satsangi, P.S. (1994). Fuzzy systems and neural networks in
software engineering project management. Journal of Applied Intelligence, 4, (pp. 31-52).
Mendes, E., Counsell, S., & Mosley, N. (2000). Measurement and effort prediction of Web applications. Proceedings of the 2nd ICSE Workshop on Web Engineering, June,
Limerick, Ireland (pp. 57-74).
Mendes, E., Mosley, N., & Counsell, S. (2001). Web metrics – Estimating design and authoring effort. IEEE Multimedia, Special Issue on Web Engineering, Jan-Mar, (pp. 50-57).
Mendes, E., Mosley, N., & Counsell, S. (2002a). The application of case-based reasoning to early Web project cost estimation. Proceedings COMPSAC 02, (pp.173-183). Mendes, E., Mosley, N., & Counsell, S. (2003). Do adaptation rules improve Web cost
estimation? Proceedings ACM Hypertext conference, (pp. 173-183).
Mendes, E., Watson, I., Triggs, C., Mosley, N., & Counsell, S. (2002b). A comparison of development effort estimation techniques for Web hypermedia applications.
Proceedings Metrics 2002, (pp. 131-140).
Morris, P. (2003). Metrics based project governance. Keynote, Metrics’03.
Morisio, M., Stamelos, I., Spahos, V., & Romano, D. (1999), Measuring functionality and productivity in Web-based applications: A case study. Proceedings of the Sixth
International Software Metrics Symposium, (pp. 111-118).
Myrtveit, I. & . Stensrud, E. (1999). A controlled experiment to assess the benefits of estimating with analogy and regression models, IEEE Trans. on Software
Engi-neering, 25(4), (pp. 510-525).
Pickard, L.M., Kitchenham, B.A., & Linkman, S.J. (1999). An investigation of analysis techniques for software datasets. Proceedings of the 6th International Symposium
on Software Metrics. IEEE Computer Society Press, CA, (pp. 130-140).
Pressman, R.S. (2000). What a tangled Web we weave. IEEE Software, Jan.-Feb., 18-21. Putnam, L. H. (1978). A general empirical solution to the macro sizing and estimating
problem. IEEE Trans. on Software Engineering, SE-4(4), (pp. 345-361).
Reifer, D.J. (2000). Web development: Estimating quick-to-market software. IEEE
Soft-ware, Nov - Dec, (pp. 57-64).
Reifer, D.J. (2002). Ten deadly risks in Internet and intranet software development. IEEE
Software, Mar-Apr, (pp. 12-14).
Ruhe, M., Jeffery, R., & Wieczorek, I. (2003), Cost estimation for Web applications.
Proceedings ICSE 2003, (pp. 285-294).
Schofield, C. (1998). An empirical investigation into software estimation by analogy. PhD thesis, Dept. of Computing, Bournemouth Univ., UK.
Copyright © 2005, Idea Group Inc. Copying or distributing in print or electronic forms without written Selby, R.W., & Porter, A.A. (1998). Learning from examples: generation and evaluation
of decision trees for software resource analysis. IEEE Trans. on Software
Engi-neering, 14, (pp. 1743-1757).
Shepperd, M.J., & Schofield, C. (1997). Estimating software project effort using analo-gies. IEEE Trans. on Software Engineering, 23(11), (pp. 736-743).
Shepperd, M.J., & Kadoda, G. (2001). Using simulation to evaluate prediction techniques.
Proceedings IEEE 7th International Software Metrics Symposium, London, (pp.
349-358).
Shepperd, M.J., Schofield, C., & Kitchenham B. (1996). Effort estimation using analogy.
Proceedings of ICSE-18, Berlin, (pp. 170-178).
Srinivasan, K., & Fisher, D. (1995). Machine learning approaches to estimating software development effort. IEEE Trans. on Software Engineering, 21, (pp. 126-137). Stensrud, E., Foss, T., Kitchenham, B.A., & Myrtveit, I. (2002). An empirical validation
of the relationship between the magnitude of relative error and project size.
Proceedings of IEEE 8th Metrics Symposium, (pp. 3-12).
Endnotes
* The metric is only useful for static Web applications, where the number of
dynamically generated links and/or pages is absent.
1 Subjects did not use external links to other Web sites. All the links pointed to pages
within the application only.
2 The structure can be a sequence, hierarchy or network. A sequential structure
corresponds to documents linearly linked; a hierarchical structure denotes docu-ments linked in a tree shape and a network structure for docudocu-ments linked in a net shape [19].
3 Subjects did not use external links to other Web hypermedia applications. All the
links pointed to pages within the original application only.
4 COBRA is a registered trademark of the Fraunhofer Institute for Experimental