Proceedings
Genome-wide gene-based analysis of rheumatoid
arthritis-associated interaction with
PTPN22
and
HLA-DRB1
Bo Qiao
1, Chien Hsun Huang
1, Lei Cong
1, Jun Xie
2, Shaw-Hwa Lo*
1and Tian Zheng*
1Addresses:1Department of Statistics, Columbia University, 1255 Amsterdam Avenue, 10thFloor, MC4690, New York, New York 10027, USA and2Department of Statistics, Purdue University, 250 North University Street, West Lafayette, Indiana 47907, USA
E-mail: Bo Qiao - [email protected]; Chien Hsun Huang - [email protected]; Lei Cong - [email protected]; Jun Xie - [email protected]; Shaw-Hwa Lo* - [email protected]; Tian Zheng* - [email protected] *Corresponding author
fromGenetic Analysis Workshop 16 St Louis, MO, USA 17-20 September 2009
Published: 15 December 2009
BMC Proceedings2009,3(Suppl 7):S132 doi: 10.1186/1753-6561-3-S7-S132
This article is available from: http://www.biomedcentral.com/1753-6561/3/S7/S132 ©2009 Qiao et al; licensee BioMed Central Ltd.
This is an open access article distributed under the terms of the Creative Commons Attribution License (http://creativecommons.org/licenses/by/2.0), which permits unrestricted use, distribution, and reproduction in any medium, provided the original work is properly cited.
Abstract
The genesPTPN22andHLA-DRB1have been found by a number of studies to confer an increased risk for rheumatoid arthritis (RA), which indicates that both genes play an important role in RA etiology. It is believed that they not only have strong association with RA individually, but also interact with other related genes that have not been found to have predisposing RA mutations. In this paper, we conduct genome-wide searches for RA-associated gene-gene interactions that involvePTPN22orHLA-DRB1 using the Genetic Analysis Workshop 16 Problem 1 data from the North American Rheumatoid Arthritis Consortium. MGC13017, HSPCAL3, MIA, PTPNS1L, and IGLVI-70, which showed association with RA in previous studies, have been confirmed in our analysis.
Background
Rheumatoid arthritis (RA), MIM 180300, is a symmetric, chronic polyarticular arthritis that affects 0.5-1% of the population. It primarily causes progressive joint destruc-tion that leads to restricdestruc-tion of daily activities and deterioration of quality of life. Although the pathogenesis of RA has not been fully explained, it is thought to be a complex disease caused by a combination of multiple genetic and environmental factors. Previous studies have indicated a few genetic regions that might be in association with RA, most notably HLA-DRB1 and
PTPN22. The HLA region on 6p21 is well known for showing the strongest association with RA. The evidence so far has particularly emphasized to theHLA-DRB1gene [1]. ThePTPN22gene (1p13.3-p13.1) has also repeatedly shown association to RA, in a modest way [2]. Despite these findings, progress in identifying new genes asso-ciated with the susceptibility to RA has been limited. An explanation is that individual contribution of each gene might be small and the traditional methods only test each marker individually, considering no interaction between markers. It is believed that important information is
ignored in such an analysis. In this paper, new gene-based methods are used to study gene-gene interactions that involveHLA-DRB1orPTPN22on a whole-genome scale. Association scores between pair-wise single-nucleotide polymorphism (SNP)-SNP interactions and the RA affection status are aggregated into measures of gene-gene interaction effects, using the Genetic Analysis Workshop 16 Problem 1 whole-genome data.
Data collected in a whole-genome association study usually consist of dense SNPs, with multiple SNPs covering a gene. SNP-based analysis is pruned for noise and local dependence, at the same time increasing computational burden. Lo et al. [3] carried out a gene-based analysis on breast cancer candidate genes and demonstrated that using genes as analysis units leads to more stable results and higher interpretability. In this paper, we use a similar gene-based analysis to study interactions betweenHLA-DRB1orPTPN22and each of the 23,580 genes in the genome for association with RA susceptibility.
Methods
Data
The data from Genetic Analysis Workshop 16 Problem 1 consist of 868 cases and 1194 controls from the North Rheumatoid Arthritis Consortium (NARAC), with geno-types on 545,080 SNPs. The percentage of missing data was not high, so we were able to impute the missing values using the computer program fastPhase [4].
Using the whole-genome map of breast cancer data from Cancer Genetic Markets Susceptibility [5], RA SNPs were mapped to genes. SNPs that did not belong to any genes were ignored and different genes with overlapping SNPs were considered separately. For example, if all the SNPs of gene A had been included in gene B, we only considered the “bigger” gene B. After the mapping, we identified 23,580 genes on the 22 chromosomes, includingHLA-DRB1 (5 SNPs) andPTPN22 (12 SNPs). For each of these 23,580 genes, we then studied the interaction with HLA-DRB1 or PTPN22 in terms of association with RA affection status.
Association measure of gene-gene interaction
We first introduce the genotype-trait distortion statistic [6] that measures the joint association of multiple SNPs with a disease outcome. Considering kSNPs, each with three possible genotypes, there are 3k possible geno-types. Genotype-trait distortion is defined as follows
v nD s
controls. When applied to a single SNP, v measures the marginal effect of a SNP. If the joint effect of two SNPs exceeds their individual marginal effects, we regard it as an evidence of interaction. As used in Lo et al. [3] to capture interaction signals at SNP level, we define the SNP-level ratio statistic as
r i j vid je vid v je
and “∨“ means maximum of the two values. Here
vi vj
d ∨ e captures the marginal effects of SNPsid andje. To evaluate the effect of each gene pair (i,j), we define the following gene-level statistics for the marginal effect and interaction signal. Assume gene i has mi SNPs and
gene j has mj SNPs. The first statistic for the marginal
effect, called the average maximum marginalM, is
M e vid v je
The statistic for gene-gene interaction based on the SNP level ratios is defined as
R e r id je
This term is called the“mean interaction ratio”between two genes, or simply, the mean ratio.
Evaluation of significance
Because the distribution of the mean ratio statistic is unknown, we used permutations to evaluate the significance of the gene-gene interactions. We carried out 1000 permutations and calculated the statistics described above on each HLA-DRB1-gene pair and
PTPN22-gene pair using the original data and the permuted data. Because HLA-DRB1 and PTPN22 have different numbers of SNPs and potentially different local dependence among the SNPs, we evaluated the gene pairs with HLA-DRB1orPTPN22 separately.
values. We proceeded with a two-dimensional graph of
MijagainstRijon the permuted data. This gave us 1000
sets of 23,580 points to create a joint distribution of M
and R under the null hypothesis of no association. We first used the following curve method [3] to construct significance threshold for gene-gene interactions that depends on the values of the marginal effect statisticM.
Curve method
We placed all points (23,580 × 1000 = 23,580,000 points) obtained from the 1000 permutations on the (M, R) plane. The values of the M coordinate were separated into 10,000 bins, each with 2358 points. Each bin was represented by a point with coordinates (M*,
R*), where R* was the 99.9% percentile of theRscores that fell into this bin and M* was the midpoint of this bin. A smoothing curve, using a spline with 10 degrees of freedom, was fitted to these 10,000 points that repre-sented the 99.9% significance threshold at eachMlevel. Gene pairs (i,j) with (M,R) coordinates above this curve were selected as significant interactions.
Lo et al. [3] also proposed a rank method for evaluating significance that has lesser distribution assumption than the curve method described above. We used both methods to evaluate the significance of gene-gene interactions.
Rank method
The rank method also depends on the bins based on the marginal M values as the curve method does. Within each bin, we assigned rank values to the 2358 points according to theirRvalues (decreasing order: the highest value receives rank 1). For each gene pair, we compared the rank received by the score based on the original data with the ranks received by the permuted values. The
p-value of this gene pair was then the proportion of the permuted values with rank values lower than the observed data.
Results
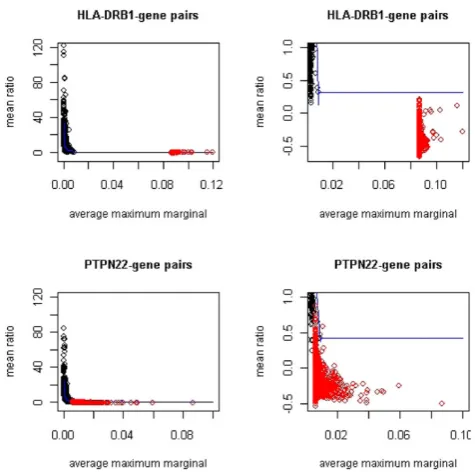
Figure 1 displays the two-dimensional (M,R) plane for gene-HLA-DRB1 interactions and gene-PTPN22 interac-tions. The observed data are plotted using red dots. The black dots are the threshold calculated within 10,000 bins by the curve method using permuted data as described in the previous section. For interactions with
HLA-DRB1, the marginal effect is much greater than that is simulated in permutations. This is due to strong marginal signals atHLA-DRB1 in the current data. As a result, we had no permuted points that were close to the observed points for calculating reliable selection thresh-old conditional on the observedMvalues. Therefore, we extended the curve threshold of the last bin to the levels
of observed M values. This is a conservative extrapola-tion because the threshold decreases as M increases. Based on this conservative threshold, zero gene-pairs were selected to have significant interaction with
HLADRB1. The rank method, on the other hand, suggested 79 genes to be significant at 0.1% level. However, because the rank values of the observed values were based on the last wide bin that stretched from the top 0.01% of the permutations to the maximum of the observed values, the adjustment to local distribution by using the rank method was not reliable. Due to this concern, in this paper we report only results based on the curve method.
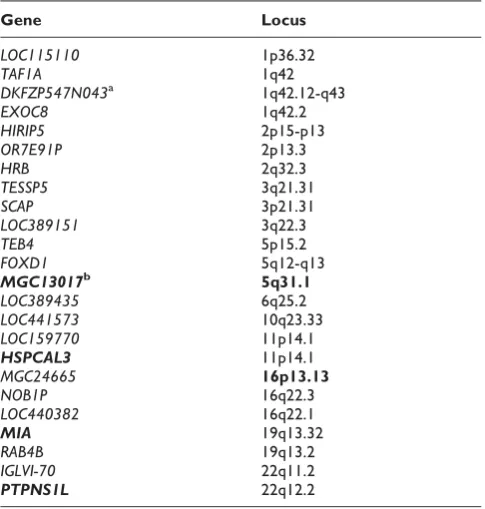
For interaction with PTPN22, we also observed strong marginal signals from PTPN22 but they are not so dominating as HLA-DRB1. The distribution of (M, R) points from the permutations overlapped slightly with the scatter of the observed data, which allowed us to derive a reliable selection threshold for gene pairs with relatively lower observed M values. Using the curve method, 24 genes were selected to have significant interaction withPTPN22at 0.1% level (Table 1). The loci of these genes overlap with important RA susceptibility Figure 1
Observed (M,R) plane with curve threshold computed from permutations. Red dots are observed values (M,R) for gene pairs studied. The black dots are the 99.9% threshold for each bin calculated from 1000
loci at 5q31 and 16p13. MGC13017 (official symbol:
CDKN2AIPNL) is CDKN2Ainteracting protein N-term-inal like according to the NCBI gene database, while
CDKN2Ahas been found to encode proteins that inhibit
CDK4 kinase. Nonomura et al. [7] studied the role of
CDK4 in the production of inflammatory molecules among subjects with RA and concluded that this protein was associated with the mediation of inflammation.
HSPCAL3 (official symbol: HSP90AA2) is inferred as heat shock protein 90-kDa alpha (cytosolic), class A member 2. Hayem et al. [8] studied stress proteins such asHSP90 kDain the serum of RA patients and found that it may be related to articular prognosis in RA. In the recent study by Vandooren et al. [9], the regulation of
MIA in RA was observed and studied. PTPNS1L is inferred to be protein tyrosine phosphatase, nonreceptor type substrate 1-like and potentially has similar but unknown functionality as some proteins in the same family as PTPN22. IGLVI-70, at the same locus of
PTPNS1L, has been thought to be related to the immunoglobulin proteins, which have been found to play important roles in the RA pathology.
Conclusion
In this paper, we studied RA-associated interactions between 23,580 genes on the genome and two important RA candidate genes,HLA-DRB1andPTPN22. Interaction
signals were first calculated at the SNP level and then aggregated into gene-based measurements. Significance was evaluated using permutations. A number of sig-nificant gene-PTPN22 interactions were found to be associated with the disease status of RA, some of which agreed with previous studies. Through this project, we also found the methods of Lo et al. [3] work better when the marginal signals genes were weak. When the marginal effects of the candidate gene are extremely strong, for example, the odds ratio is greater than 6, the interaction with other genes becomes harder to capture. Further research is needed to address this issue.
List of abbreviations used
RA: Rheumatoid arthritis; SNP: Single-nucleotide poly-morphism.
Competing interests
The authors declare that they have no competing interests.
Authors
’
contributions
S-HL and TZ designed the research. BQ, CHH, and LC carried out the data analysis. BQ, CHH, S-HL, and TZ discussed and interpreted the results. BQ, JX, and TX prepared the manuscript. All authors read and approved the final manuscript.
Acknowledgements
The Genetic Analysis Workshops are supported by NIH grant R01 GM031575 from the National Institute of General Medical Sciences. The CGEMS breast data were requested and accessed with Data Access Committee of the NCI permission and accesses via the protected portal at http://cgems.cancer.gov/data/. This research was supported by NIH R01 grant GM070789 and NSF grant DMS 0714669.
This article has been published as part of BMC Proceedings Volume 3 Supplement 7, 2009: Genetic Analysis Workshop 16. The full contents of the supplement are available online at http://www.biomedcentral.com/ 1753-6561/3?issue=S7.
References
1. Newton JL, Harney SMJ, Wordsworth BP and Brown MA:A review of the MHC genetics of rheumatoid arthritis.Genes Immun 2004,5:151–157.
2. B e go vi ch AB , C arl to n VE, Ho ni gbe rg L A, S chro di SJ , Chokkalingam AP, Alexander HC, Ardlie KG, Huang Q, Smith AM, Spoerke JM, Conn MT, Chang M, Chang SY, Saiki RK, Catanese JJ, Leong DU, Garcia VE, McAllister LB, Jeffery DA, Lee AT, Batliwalla F, Remmers E, Criswell LA, Seldin MF, Kastner DL, Amos CI, Sninsky JJ and Gregersen PK:A missense single-nucleotide polymorph-ism in a gene encoding a protein tyrosine phosphatase (PTPN22) is associated with rheumatoid arthritis.Am J Hum Genet2004,75:330–337.
3. Lo SH, Chernoff H, Cong L, Ding Y and Zheng T:Discovering interaction among BRCA1 and other candidate genes associated with sporadic breast cancer. Proc Natl Acad Sci USA2008,105:12387–12392.
4. Scheet P and Stephens M:Fast and flexible statistical model for large-scale population genotype data: applications to infer-ring missing genotypes and haplotypic phase.Am J Hum Genet 78:629–644.
Table 1: Genes that demonstrates significant RA-associated interaction withPTPN22by the Curve method
Gene Locus
aGenes in the boxes have SNPs in common. b
5. CCEMS.http://cgems.cancer.gov/data/.
6. Zheng T, Wang H and Lo SH: Backward genotype-trait association (BGTA)-based dissection of complex traits in case-control designs.Hum Hered2006,62:196–212.
7. Nonomura Y, Nagasaka K, Hagiyama H, Sekine C, Nanki T, Tamamori-Adachi M, Miyasaka N and Kohsaka H:Direct modula-tion of rheumatoid inflammatory mediator expression in retinoblastoma protein-dependent and independent path-ways by cyclin-dependent kinase 4/6. Arthritis Rheum 2006, 54:2074–2083.
8. Hayem G, De Bandt M, Palazzo E, Roux S, Combe B, Eliaou JF, Sany J, Kahn MF and Meyer O:Anti-heat shock protein 70 kDa and 90 kDa antibodies in serum of patients with rheumatoid arthritis.Ann Rheum Dis1999,58:291–296.
9. Vandooren B, Cantaert T, van Lierop MJ, Bos E, De Rycke L, Veys EM, De Keyser F, Bresnihan B, Luyten FP, Verdonk PC, Tak PP, Boots AH and Baeten D: Melanoma inhibitory activity, a biomarker related to chondrocyte anabolism, is reversibly suppressed by proinflammatory cytokines in rheumatoid arthritis.Ann Rheum Dis2009,68:1044–1050.
Publish with BioMed Central and every scientist can read your work free of charge
"BioMed Central will be the most significant development for disseminating the results of biomedical researc h in our lifetime."
Sir Paul Nurse, Cancer Research UK
Your research papers will be:
available free of charge to the entire biomedical community
peer reviewed and published immediately upon acceptance
cited in PubMed and archived on PubMed Central
yours — you keep the copyright