INTEGRATION, the VLSI journal 38 (2005) 353–382
Quality-of-service and error control techniques for mesh-based
network-on-chip architectures
Praveen Vellanki, Nilanjan Banerjee, Karam S. Chatha
Department of CSE, Arizona State University, P.O. BOX 875406, Tempe, AZ 85287-5406, USA
Received 16 June 2004; received in revised form 19 July 2004; accepted 21 July 2004
Abstract
Network-on-a-chip (NoC) has been proposed as a solution for addressing the design challenges of future high-performance system-on-chip architectures in the nanoscale regime. Many real-time applications require input data that arrives with low delay jitter. Such communication traffic can only be supported by incorporating multiple levels of service in the interconnection network. Further, as technology scales toward deep submicron, on-chip interconnects are becoming more and more sensitive to noise sources such as power supply noise, crosstalk, and radiation induced effects, that are likely to reduce the reliability of data. Hence, effective error control schemes are required for ensuring data integrity. This paper addresses two important aspects of NoC architectures, quality of service and error control schemes and makes the following contributions: (i) it presents techniques for supporting guaranteed throughput (for low delay jitter traffic) and best-effort traffic quality levels in NoC router, (ii) it presents architectures for integrating error control schemes in the NoC router architecture, and (iii) it presents cycle accurate power and performance models of the two architecture enhancements for a mesh based NoC architecture.
r2004 Elsevier B.V. All rights reserved.
Keywords:Network-on-chip; Quality-of-service, Error-control; Power consumption; Performance
www.elsevier.com/locate/vlsi
0167-9260/$ - see front matterr2004 Elsevier B.V. All rights reserved. doi:10.1016/j.vlsi.2004.07.009
Corresponding author. Department of Computer Science and Engineering, Arizona State University, Brickyard
Suite 501, 699 South Mill Avenue, Tempe, AZ85281, USA. Tel.: +480-727-7850; fax: +480-965-2751.
E-mail addresses:[email protected] (P. Vellanki), [email protected] (N. Banerjee), [email protected] (K.S. Chatha).
1. Introduction
The physical characteristics of nanoscale technologies will pose several challenges to the system-on-chip (SoC) designers. Global signal delays will span multiple clock cycles[1,2]. Signal integrity will also be compromised due to increased RC effects, inductance, and cross-coupling capacitances [3]. Nanoscale packet switched networks or network-on-chip (NoC) have been proposed as architectural solution for SoC design in the nanoscale regime[4–8]. Packet switching supports asynchronous transfer of information. It provides extremely high bandwidth by distributing the propagation delay across multiple switches, thus pipelining the signal transmission. Packet switching networks also support error detection and correction schemes that can be applied towards improving the signal integrity. Quality of service (QoS) can be ensured by distinguishing between different types of traffic.In this paper,we present techniques for supporting multiple levels of service and error control schemes for a mesh basedNoCarchitecture.
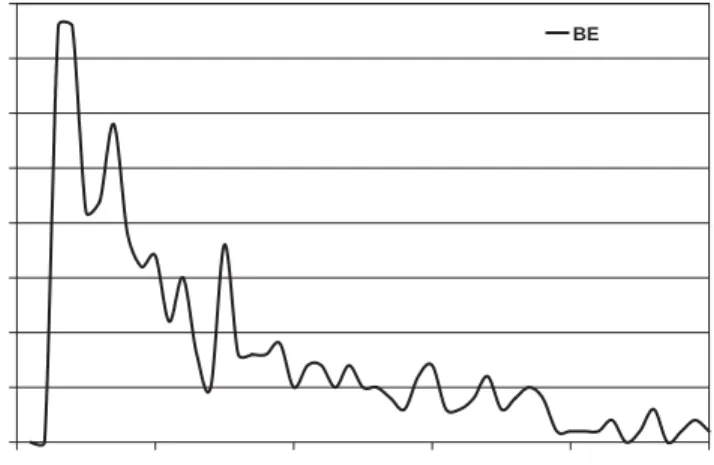
Fig. 1plots the variation in packet latency for destinations that are uniformly 3 hops away in a 44 mesh based NoC architecture for a router with 4 virtual channels at an injection rate of 0.05 packets/cycle/node. The x-axis denotes the latency of various packets, and y-axis denotes the number of packets. The mean latency of the plot is 97.87 clock cycles which is close to the peak of the plot. However, there are a large number of packets (214, over 50%) that experience transmission latency that is more than double the average latency. Such a large variance in average latency is unacceptable for many NoC implementations such as traffic between a cache and lower level memory, or different processing elements of a multimedia application. We present techniques for supporting both low jitter guaranteed throughput and best-effort traffic in a NoC router. Cycle accurate power and performance models for trade-off analysis of the two techniques are also presented.
In the nanoscale regime, crosstalk on long global wires will be a major source of errors. Switching activity on aggressor links can cause errors by either forcing a logic transition
0 5 10 15 20 25 30 35 40 0 200 400 600 800 1000 Latency (cycles) Noof Packets BE
on a stable victim link or by delaying the transition on a switching victim link. Both these instances result in capture of an incorrect logic level at the receiver. A number of error control schemes [9] have been proposed for general communication networks. In a NoC architecture, due to the stringent performance and power constraints, low complexity and low power error control schemes are desirable. Hence, we have implemented two low overhead error control:single error detection and retransmission(PAR), andsingle error correction
(SEC). We also present power and performance trade-offs of the two schemes under variable traffic profile.
The trade-off in performance versus power consumption of interconnection network is a key question. The performance of the nanoscale interconnection network can be specified by the average latency of sending a message through the network, and the bandwidth of the network. The power consumption of the network consists of the dynamic and leakage power consumption of the various components. This paper also presents results for power versus performance trade-off analysis for different service levels of traffic and error control schemes.
We integrated the QoS and error control schemes into a VHDL based cycle accurate power and performance model of NoC architecture. The model is a parameterized register transfer level (RTL) design of the NoC architecture elements. The design is parameterized on (i) size of packets, (ii) length and width of physical links, (iii) number, and depth of virtual channels, and (iv) switching technique. The model is annotated with delay, dynamic, and leakage energy estimates of the various components. The model can estimate the latency, throughput, dynamic, and leakage power consumption of a NoC architecture. The RTL design for the QoS and error control circuitry was synthesized and the SPICE level netlist was extracted from the layout. The design was then characterized for delay, and dynamic and leakage power consumption at 0:18mm:The characterized values were integrated into the VHDL based RTL design to build the cycle accurate performance model.
The paper is organized as follows: Section 2 discusses the previous work, Section 3 gives a quick overview of the NoC architecture and the cycle accurate performance model, 4 discusses the QoS schemes, 5 discusses error control techniques, Section 6 discusses the packet format and protocol, Section 7 presents the experimental results, and Section 8 concludes the paper.
2. Previous work
In recent years a number of researchers have proposed architectures, performance evaluation techniques and optimization approaches for NoC. This section classifies and presents the existing research under four categories: seminal work, router architectures, performance models, and automated optimization approaches. Our paper discusses innovative router architectures for supporting guaranteed throughput, and error control schemes in mesh based on-chip interconnection networks, and presents power and performance evaluation models for the same. The work presented in our paper can be classified under both router architectures, and performance models. Hence, in the following section we compare and contrast our work with existing techniques in both categories.
2.1. Seminal work
Guerrier et al. [4] presented a NoC design called SPIN that was based on fat-tree topology. They also presented the router architecture and cycle accurate performance model for their NoC design. Sgroi et al. [5] discussed a platform based SoC design methodology that proposed the inclusion of NoC for supporting on-chip communication. Dally et al. [6] demonstrated the feasibility of the NoC and estimated that the NoC places an area overhead of 6.6%. Benini et al.
[7] in their conceptual paper on NoC, predict that packet switched on-chip interconnection networks will be essential to address the complexity of future SoC designs. Kumar et al. [8]
presented a conceptual system-level architecture that allowed a mesh-based NoC to accommodate large resources such as memory banks, FPGA areas, or high performance multi-processors. Except for Guerrier et al.[4]all the above mentioned works did not present detailed architectures or performance models. We will address[4]in more detail when we discuss NoC architectures and performance models.
2.2. NoC architectures
Several researchers have proposed architectures, and related optimizations for on-chip interconnection networks. We classify the related research on NoC architectures based on the supported levels of traffic service classes, error control schemes, and power optimizations.
2.2.1. Architectures for best effort traffic
In this paragraph we review the NoC architectures that support only best effort traffic class. SPIN[4,10,11]was one of the seminal works to propose a detailed NoC architecture built with fat tree topology. Proteo [12,13] is a VSIA-complaint NoC architecture that can be configured for ring, star, and bus topologies. Xpipes [14] is a parameterized router architecture that can be utilized in arbitrary NoC topologies. As shown inFig. 1, best effort traffic class is limited by large deviation in average latency which is not desirable for many real-time applications. In this paper we present a technique for supporting low jitter guaranteed throughput traffic.
2.2.2. Architectures for guaranteed throughput traffic
Nostrum [15,16] is a protocol stack for mesh based NoC architecture that supports both best effort and guaranteed throughput traffic classes. Nostrum ensures bandwidth for guaranteed throughput traffic by reserving time slots called looped containers for its transmission on inter-router links. If no guaranteed throughput traffic is injected into the network the time slots are not utilized. In contrast we support guaranteed throughput traffic by reserving a certain number of virtual channels (buffers). Hence, if no guaranteed throughput traffic is injected into the network the best effort traffic can be transported with maximum bandwidth. AEthereal[17,18] is also a mesh based NoC architecture that supports guaranteed throughput traffic by utilizing a centralized scheduler for allocation of link bandwidth. Our architecture utilizes a distributed scheme where the traffic producer sets-up a guaranteed throughput connection by reserving virtual channels, transfers the data, and then tears down the connection by giving up the virtual channels. Finally, neither of these two works presented detailed results for performance and power consumption of their respective architectures.
2.2.3. Architectures with error control schemes
Bertozziet al.[19] presented power versus performance results for point-to-point error control in an on-chip bus protocol based on AMBA bus. Their work did not address NoC architectures, and did not consider the influence of network traffic on the performance of the error control schemes. Zimmer et al.[20]presented a fault model for NoC architecture. They also proposed a QoS scheme that treated control traffic with higher reliability than data traffic. In contrast, our paper presents a QoS scheme for guaranteed throughput and best-effort traffic. The performance and power consumption of the error control schemes in the presence of variable traffic profiles for a mesh-based NoC architecture have also been discussed.
2.2.4. Architectural optimizations for low power
Worm et al.[21]proposed an adaptive low power transmission scheme for NoC that minimized the voltage swing and frequency subject to the workload requirement. Chen et al.[22] proposed power-aware buffer policy that minimized the leakage power consumption in virtual channels. Simunic et al.[23]proposed a system-level power reduction scheme for SoC architectures with on-chip interconnection networks. Their scheme applied dynamic voltage management and dynamic voltage scaling policies based on both local and global workload information. Our work is focused on architecture extensions and performance models for supporting guaranteed throughput and error control schemes.
2.3. Performance evaluation
Innovative performance evaluation models are required to address the design challenges of NoC based interconnection architectures. Although there are a number of models for network performance evaluation [24–27], these models do not consider the power consumption characteristics. Current system level performance evaluation tools [28–30] are targeted towards shared bus architectures and do not consider interconnection networks. Traditional solutions for on-chip global communication include models for various shared-bus[31–33]and ad hoc point-to-point interconnections.
Wassal et al. [34] proposed system-level performance and power models for a shared-memory internet protocol/asynchronous transfer mode switching fabric. Ye et al.[35] analyzed the power consumption in the switch fabrics of network routers and proposed system-level models for the same. Pamunuwa et al.[36]performed a system level analysis and estimated the wiring overhead and the gate count for implementing mesh-based NoC architecture. They also estimated the power consumption by assuming switching activity on 50% of the gates. Wang et al.[37]proposed a power-performance simulator for interconnection network called Orion. All these models do not incorporate the QoS and error control schemes. Bolotin et al.[38]proposed analytical models for system-level performance and cost estimation of NoC architectures. They did not address the power consumption in NoC.
2.4. Automated design techniques
In the recent past researchers have begin to address the problem of synthesizing custom NoC architectures, and mapping communication traffic on them. Pinto et al.[39]presented a quadratic
programming based approach for synthesis of custom NoC architectures. Hu et al.[40]presented an integrated task and communication scheduling approach for mapping applications on mesh-based NoC architectures. Murali et al. [41] presented a technique for bandwidth constrained mapping of cores to mesh based NoC architectures. As opposed to the synthesis techniques, this paper focuses on architectural extensions and performance models.
3. NoC architecture and characterization
In the following paragraphs we describe the architecture of the various NoC elements (physical links, routers), and the techniques applied for their characterization.
3.1. Physical links
The physical links include the data and control wires for communication between two router elements of the interconnection network.
3.1.1. Characterization of physical links
The power and performance of a physical link is determined by its width (number of bits of data and control signals), length, and capacitive load of the router. In nanoscale technologies, individual wires are modeled by distributed RLC expressions for accurate description of their physical characteristics [42]. The RLC and cross-coupling capacitances of the interconnection model were obtained from the Berkeley Predictive Technology Model website [43]. We characterized the links in sets of three, two and single wire, respectively for 0:18mm technology. The three and two wire sets included the distributed RLC effects and cross-coupling capacitances, while the single wire model only included the distributed RLC effects. We considered three different types of links: local ðp1000mmÞ; intermediate
ð41000mm and ðp4000mmÞ; and global ð44000mmÞ [1]. We obtained energy values for 64
ð88Þ;16ð44Þand 4ð22Þdifferent switching combinations for the three, two and single wire sets, respectively. The wire lengths were incremented in steps of 100mm up to 1000mm; steps of 500mm up to 4000mm and steps of 1000mm up to 5000mm: Table 1 summarizes the switching energy consumed in 0:18mm technology for three wire-set switching for 100, 1000 and 5000mm; respectively.
3.1.2. Performance evaluation of physical links
We included the link characterization values as a table in our performance model. The energy consumed by an-bit wide link can be calculated from the energy consumed by the three, two and single wire sets of similar length. For example, consider the 9-bit (odd) wide link shown in the left-hand side ofFig. 2. The total switching energy consumed by the links can be calculated by adding the switching energy consumed by the three wire sets S0, S1, S2 and S3, and subtracting the energy consumed by single wire links A, B, and C, respectively. In the case of a 8-bit (even) wide link shown in the right-hand side ofFig. 2, the energy consumed by two wire set S3 is included in the calculation. The length of the physical link which is a major factor in determining its power consumption and performance is specified by the designer.
3.2. The NoC router
A router architecture that can be utilized in a 2D mesh topology is shown inFig. 3. The router consists of five unit routers to communicate inX-minus,X-plus,Y-minus, andY-plus directions, and with the processor. Unit routers inside a single router are connected through a 55 crossbar. Data is transferred across routers or between the processor and the corresponding router by an asynchronous handshaking protocol. A single unit router is highlighted in lower half ofFig. 3. It consists of input and output link controllers, virtual channels, a header decoder and an arbiter. Data arrives at an input virtual channel of an unit router from either the previous router or the processor connected to the same router. The header decoder decodes the header flit of the packet after receiving data from the input virtual channel, decides the packet’s destination direction (X;Xþ;Y;Yþ;processor), and sends a request to the arbiter of the unit router in
Table 1
3 wire-set characterization
Switching Energy (in fJ)
100mm 1000mm 5000mm (000-000), (001-001), (010-010), (011-011), 0 0 0 (100-100), (101-101), (110-110), (111-111) (000-001), (000-100), (001-101), (010-011), 0.122 5.25 99 (010-110), (011-111), (100-101), (110-111), (000-010), (001-011), (100-110), (101-111) 0.189 12.48 213 (000-011), (000-110), (001-111), (100-111) 0.1914 5.94 121 (000-101), (010-111) 0.258 13.17 235 (000-111) 0.2075 20.46 66 (001-010), (010-100), (011-101), (101-110) 0.4314 29.54 504 (001-100), (011-110) 0.2309 7.83 165 (001-110), (011-100) 0.42 20.31 378 (010-101) 0.6864 48.9 830 A B C A B C
Odd number of links Even number of links S3 S2 S1 S0 S0 S1 S2 S3
Total Energy = E(s0) + E(s1) + E(s2) + E(s3) - E(a) - E(b) - E(c)
Cross Link controller,
Arbiter & FIFO Header decoder
Link controller, Arbiter & FIFO Header decoder
Link controller, Arbiter & FIFO Header decoder Link controller,
Arbiter & FIFO Header decoder
Link controller, Arbiter & FIFO Header decoder Grant Lines
Out FIFO Request and
Data Lines Crossbar Control Lines
To/From "X+" Router
To/From "Y
To/From "Y+" Router
To/From Processor
Link Data Lines Link Control Lines
To/From "X_" Router Arbiter Header Decoder wr_req wr_ack wr_vcid rd_ack rd_req rd_vcid Error Decoder empty rd_e N N Control to crossbar req 4 4 Data from crossbar
wr_vcid full N N N full wr_e Data to crossbar grant full 4 4 wr_req empty N N Signal from out FIFO through crossbar
Signal to out FIFO through crossbar
Virtual Channel 1 Virtual Channel N Virtual Channel .... Out FIFO Virtual Channel 1 Virtual Channel N Virtual Channel .... 4 req clear 4 clear grant rd_req rd_vcid In FIFO
Data from neighbouring router
Data to neighbouring router GT GT BE BE GT GT Input Link Controller
Controller Output Link
Error Encoder
the corresponding direction. Once the grant is received the header decoder starts sending data from the input to the output virtual channel through the crossbar. The complete architecture and the detailed implementation can be found in[44].
We designed RTL models for each of the components separately. The larger components were characterized in terms of unit components like unit full adder, 2-bit comparator, 2:1 1-bit multiplexer, D flip-flop, and logic gates. SPICE net-lists for 0:18mm technology were extracted for each component and characterized for energy and performance (shown in Table 2). Power consumption of the entire router architecture is computed by including the characterized energy values as table lookups in the RTL model.
4. Quality-of-service schemes
In this section we describe the QoS schemes that are supported by our architecture, and their performance and power characterization. The NoC architecture supports two levels of service: best effort (BE) and guaranteed throughput (GT). Each packet is divided into multiple flits. The flit is a unit of transfer between two routers. The packets are routed by a deterministic dimension ordered source routing strategy. This deadlock free strategy first transmits the packet in
X-dimension till thex-offset is zero, and then the packet is transmitted in theY-dimension. Both the service levels ensure guaranteed and in-order delivery of packets. In the following few paragraphs we first describe the BE service level, and then the GT service level.
4.1. Best effort traffic service level
The BE traffic service level packets are injected from the input queue into the input virtual channel of the router by the processor if the channel is not full. The processor checks the full
Table 2
Unit components
Unit full adder 2-bit comparator
1-bit flip at the output 0.096 pJ Output transition 0.15 pJ
2-bit flip at the output 0.1608 pJ Input change but no output change 0.0708 pJ Input change but no output change 0.0552 pJ Leakage 0.077 fJ
Leakage 0.0438 fJ
2-1 Multiplexer D Flip-Flop
Output transition 0.061 pJ Output transition 0.1089 pJ
Input change but no output change 1.527 fJ Input change but no output change 0.014 pJ
Leakage 0.013 fJ Leakage 0.034 fJ
Nand gate Xor gate
Output transition 0.0312 pJ Output transition 0.0675 pJ
Input change but no output change 0.117 fJ Input change but no output change 0.0159 pJ
signal before injecting the packet. Inside the network, the same strategy is followed to transmit the each flit of the packet from the output virtual channel of one router to the input virtual channel of the neighboring router. Such a transmission strategy acts as an explicit hop-to-hop flow control mechanism, and together with the dimension ordered routing ensures guaranteed, and in-order delivery of packets.
There is a round robin priority based scheduling mechanism for each of the following tasks:
Selection of an input virtual channel by the header decoder. Selection of an output virtual channel by the arbiter. Grant of the crossbar to the header decoder by arbiter. Selection of the output virtual channel by the link controller.In all the above decision mechanisms the scheduler is invoked if (i) the packet is partially transmitted and blocked, or (ii) after complete transmission of each packet. Since all the packets are of the same size, the BE round robin priority scheme approximates the theoretically optimal, work-conserving generalized processor sharing (GPS). The GPS scheme provides fair allocation of link bandwidth to all the packets.
4.2. Guaranteed throughput traffic service level
Many applications demonstrate bursty traffic behavior that must be transmitted from source to destination with a required throughput and low jitter. Examples are traffic between a cache and lower level memory, or between various processing blocks of a multimedia processing engine. As demonstrated inFig. 1, the BE traffic service level is unable to support the desired QoS.
We support guaranteed throughput traffic by dividing the virtual channels between GT and BE service levels. The number of virtual channels assigned to each service level is a design parameter that is specified by the designer. In the case of heavy network load the GT traffic can be transmitted on the BE virtual channels, but not vice versa. The round robin service mechanism is modified to give priority to the GT traffic over the BE traffic. Among each of the two service levels, every virtual channel gets equal priority.
The GT traffic is always transmitted as a stream of packets with a designer specified fixed size. At the processor, the GT packets are queued until the stream size is reached. Once the desired stream size is reached, the GT protocol performs the following three steps; connection set-up, transmission, and tear-down. In the connection set-up, the virtual channels are reserved for the stream all the way from the source to the destination. The connection set-up stage might take a variable amount of time based on the network load. Once the connection is set-up the stream can be transmitted with maximum throughput. After the entire stream has been transmitted the reserved virtual channels are set free by tear-down step. Since, the GT traffic is always transmitted as a stream with maximum throughput, it prevents under-utilization of resources. Further, since the GT traffic is transmitted in discrete streams of fixed sizes, starvation of other GT traffic is also prevented. As the GT traffic can utilize virtual channels that are allocated for BE traffic, there is a possibility for starvation of BE traffic at high injection rates. However, as the experimental results will demonstrate the starvation can be easily avoided by limiting the ratio of GT/BE traffic
to be around 0.25 for a router with 4 virtual channels (two virtual channels allocated to GT). This is not un-realistic as only a small portion of the total network traffic is expected to be supported on the GT traffic class.
4.3. Architecture and characterization for QoS schemes
The basic router[44] supporting only BE service levels has been enhanced to support multiple levels of service as shown in Fig. 3. The round robin priority based scheduling units present in header decoder, arbiter and output link controller have been modified to give priority to channels transferring GT traffic. For instance, if there areNvirtual channels per node in the router, andK
of theseNchannels have been allocated to transmit GT traffic, then the schedulers assign priority to these K channels to transfer data. If GT traffic is not present, then BE packets are allocated resources in a round robin manner. The energy model for the modified architecture is implemented utilizing unit components shown inTable 2.
5. Error control schemes
In the nanoscale regime, crosstalk in long global communication wires is expected to be the major source of errors. In this paper, we focus on the crosstalk errors in the links between the routers. The error control schemes are incorporated into the output and input link controllers, respectively. The output link controller includes the encoder, and the input link controller includes the corresponding decoder. Due to the strict constraints on low latency and power consumption requirements, we have implemented low overhead error control schemes. The two schemes that we implemented include PAR, and SEC.
Single error detection and retransmission(PAR): The basic single bit parity check method is used to detect the error, and re-transmission of data is requested in the presence of error. The main idea behind this scheme is to enable error recovery based on the re-transmission. The hardware overhead is negligible since it requires only one extra bit of information per flit of data transfer. However, latency per packet increases in case of retransmission.
Single error correction(SEC): The basic (15,11) Hamming code[9]implementation with a single error correction capability is utilized for this scheme. The decoder present in the input virtual channel controller of a router is more complex than the encoder at the output virtual channel controller, because of the correction circuitry. The hop-to-hop transmission of 11 bit data requires 4 additional check bits.
5.1. Architecture and characterization of error control schemes
In our architecture, we have primarily concentrated on modification of the link controllers to incorporate the error model as shown inFig. 3. The data is encoded at the output link controller and is subsequently decoded at the input link controller before progressing through the next router towards its destination. This hop based error detection and correction mechanism allows strong error control. The functionality and characterization of the link controllers have been described below.
Single error detection and retransmission(PAR): This scheme is implemented as shown inFig. 4. The input link controller has 2 states, S0 and S1. S0 represents the idle state, in which the state machine waits for areqfrom the output virtual channel of the neighboring router. Once it receives areqfrom the output virtual channel, it checks the output of the parallel error detection circuitry. In absence of an error, it goes to S1 raising the ack signal and also the write signal (to its own infifo) high. In state S1, it lowers thewrite signal and stays in this state as long as the reqsignal remains high. Once the req signal is lowered, it returns to S0 lowering the ack signal in the transition. In presence of error, it shifts to state S1 raising theack signal to the previous output link controller. However, it maintains thewritesignal low in this case and waits forreqsignal to go low to shift back to S0, while raising the re-transmit signal.
The output link controller has a complimentary state sequence as shown in Fig. 5. The characterized energy values for both the link controllers are also shown inFig. 4and 5.
Single error correction(SEC): This scheme is similar to the above scheme with the controllers having 2 states each. The difference lies in the state S0 of the input link controller where an error detection leads to a subsequent correction of the error before shifting to state S1. The
or REQ = '1' / ACK = '1', write = '1' REQ = '1' / ACK = '1', error = '1', error = '0', write = '0' REQ = '0' / ACK = '0', write = '0' retransmit = error S0 S1 REQ = '0' / ACK = '0', write = '0' write = '0' REQ = '1' / ACK = '1', (E = 0.024 pJ) (E = 0.024 pJ) (E = 0.225 pJ) (E = 0.275 pJ)
Leakage energy value for the circuit = 0.6 fJ
Fig. 4. Input link controller.
read = '0' REQ = '1' ACK = '0'/ REQ = '0' read = '0' ACK != '0'/
ivc = input virtual channel
ovc = output virtual channel read = '0' REQ = '1' ACK = '1'/ REQ = '0'
ACK = '0' and ivc != full and ovc !=empty/ read = ! retransmit
S0 S1
(E = 0.09 pJ) (E = 0.09 pJ)
(E = 0.261 pJ)
(E = 0.219 pJ)
Leakage energy value of the circuit = 0.2 fJ
characterized values of both the link controllers are similar to those shown in Figs. 4 and 5. We characterize the PAR and the SEC circuitry in terms of unit xor gates (energy values shown inTable 2).
5.2. Error generation model
Hegde et al. [45] developed a model for noise from various sources in CMOS circuitry as a Gaussian source. The model has been applied towards error estimation in SoC architectures
[19,46]. In the model, it is assumed that the gate input is in error when the noise voltage VN exceeds the gate decision threshold voltageVth which is defined as
Vth ¼
Vdd 2
The model assumes that a signaling waveform has a certain noiseVNadded on to it, andVNhas a normal distribution with a variance ofs2
N and mean of 0. The probability of erroris given by ¼Q Vdd 2sN ; whereQðxÞ ¼ Z 1 x 1 ffiffiffiffiffiffi 2p p ey2=2dy
is the Gaussian pulse. We utilize the above model to generate errors in the individual wires of the NoC links.
6. Packet format and protocol
The message is partitioned into fixed length packets that are in turn broken down into flits for efficient data transfer. A packet consists of three kinds of flits—the header flit, the data flit and the tail flit, that are differentiated by two bits of control information. The header flit contains information of the destination router (X,Y) for each packet. The header flit contains additional information of one bit to indicate whether it is a best effort or a guaranteed throughput packet.
7. Results
We performed design space exploration and performance versus power trade-off analysis for a 44 mesh topology of a NoC based interconnection network. Each unit router consisted of 4 virtual channels, with 2 channels each allocated to GT and BE traffic service levels. The physical channels supported unidirectional communication with both data and control bits. International Technology Roadmap for Semiconductors (ITRS) predicts that in future the die size for high end SoC architectures would be around 22 mm22 mm: Kumar et al. [8] have also made similar predictions. Hence, we assume a chip dimension of 20 mm20 mm and consider the inter-router links to be 4.5 mm. In our experiments, the simulator generated two varieties of traffic to random destinations—uniformly distributed traffic and Poisson distributed traffic. The traffic was injected through the 16 processors by utilizing a uniform/Poisson distribution over a designer specified
time interval. In our architecture, due to the asynchronous communication protocol, it takes two clock cycles to transfer each flit.
The network was allowed to stabilize for the first 1000 cycles, after which it was run for 10,000 clock cycles. At the end of 10,000 clock cycles the total number of packets reaching the destination, their acceptance rate, and latencies were calculated. The acceptance rate is the number of packets received at the destination per cycle per node. The average dynamic and leakage power consumption of the various components was also calculated over 10,000 clock cycles. The clock width was assumed to be 3 ns.
In the following plots, we distinguish between queue and network latency. The queue latency denotes the amount of time spent by the packet at the source queue after its generation, and before its injection into the network. The network latency denotes the time required by the packet to transmit from source to destination. The total latency of the packet is summation of the queue and network latency. Additionally, for the GT traffic packets, we consider the set-up latency as the time required to reserve the virtual channels from source to destination.
The BE packets were assumed to consist of 5 flits. The GT packets also consisted of 5 flits, and the GT stream was assumed to be 15 packets long. At a particular injection rate, the number of GT and BE packets to be generated are specified as a ratior¼GT=BE:The queue latency of the GT traffic is calculated as the difference between the time when the total stream has been generated and the time when the stream is injected to the network.
7.1. Evaluation of QoS schemes
Fig. 6plots the variation in network latencies of GT and BE traffic when the destination is 3 hops away from the source at an injection rate of 0.05 packets/cycle/node. While the BE traffic experiences a wide spectrum of network latencies, the GT traffic latency spectrum has a sharp
0 10 20 30 40 50 60 70 0 200 400 600 800 1000 Latency (cycles) Noof Packets GT BE
spike. This plot validates that our router is able to provide guaranteed low jitter latency for GT traffic transmission.
Figs. 7 and8 plot the network latency of the BE and GT traffic as the injection rate is varied from 0.025 to 0.1, andris varied from 0.25 to 1. As can be observed from the plots, for all values ofr, as the injection rate is increased the average network latency of the BE traffic increases. There is also an increase of average BE network latency with increasingrvalues, since more priority is given to GT traffic over BE traffic. The average network latency for the GT traffic, on the other hand, remains almost constant.
0.025 0.05 0.075 0.1 GT/BE=0.25 GT/BE=0.5 GT/BE=1 0 100 200 300 400 500 600 700 800 900 1000 Latency (cycles)
Injection Rate (packets/cycle/node) GT/BE=0.25 GT/BE=0.5 GT/BE=1
Fig. 7. Network latency for BE.
0.025 0.05 0.075 0.1 GT/BE=0.25 GT/BE=0.5 GT/BE=1 0 100 200 300 400 500 600 700 800 900 1000 Latency (cycles)
Injection Rate (packets/cycle/node) GT/BE=0.25 GT/BE=0.5 GT/BE=1
Figs. 9and10plot the variation in queue latency of BE, and GT traffic, respectively. The queue latency for BE traffic increases dramatically with rise in injection rate and r. This observation is supported by the BE acceptance rate plot shown in Fig. 12. It should be noted that BE queue latency soars to around 3000 clock cycles forr¼1 and injection rate 0:1:The queue latency for GT traffic for lower injection rates and low values ofr remains negligible as less number of GT packets are generated by the processors and the resources can easily cater to them without any congestion. However, for higher values ofrwith higher injection rates we observe a considerable increase in queue latency because of high network congestion between GT traffic.
0.025 0.05 0.075 0.1 GT/BE=0.25 GT/BE=0.5 GT/BE=1 0 500 1000 1500 2000 2500 3000 Latency (cycles)
Injection Rate (packets
/cycle/node) GT/BE=0.25
GT/BE=0.5 GT/BE=1
Fig. 9. Queue latency for BE.
0.025 0.05 0.075 0.1 GT/BE=0.25 GT/BE=0.5 GT/BE=1 0 100 200 300 400 500 600 700 800 900 1000 Latency (cycles)
Injection Rate (packets/cycle/node) GT/BE=0.25
GT/BE=0.5 GT/BE=1
Fig. 11 plots the variation in connection set-up latency for the GT traffic. The set-up latency increases with both the injection rate and ratior. The increase has the smallest slope forr¼0:25:
Figs. 12–14plot the acceptance rates for BE, GT, and combined traffic, respectively. As can be seen from the plots, at a particularrvalue the BE acceptance rate initially increases with increase in injection rate. It peaks at around 0.05 injection rate, and then falls. However, the acceptance rate for GT traffic increases linearly with increase in injection rate andr. Priority of GT traffic over BE traffic helps explain the variation in BE acceptance rate. The combined network acceptance rate rises linearly with the injection rate before the network is congested, and is constant after congestion.
0.025 0.05 0.075 0.1 GT/BE=0.25 GT/BE=0.5 GT/BE=1 0 100 200 300 400 500 600 700 800 900 1000 Latency (cycles)
Injection Rate (packets/cycle/node) GT/BE=0.25
GT/BE=0.5 GT/BE=1
Fig. 11. Setup latency for GT.
0.025 0.05 0.075 0.1 GT/BE=0.25 GT/BE=0.5 GT/BE=1 0 0.005 0.01 0.015 0.02 0.025 0.03 0.035 0.04 0.045 0.05 AcceptanceRate (packets/cycle/node)
Injection Rate (packets/cycle/node)
GT/BE=0.25 GT/BE=0.5 GT/BE=1
Figs. 15 and 16 plot the variation in average dynamic and leakage power of the NoC for the variation in injection rates and r, respectively. The dynamic power consumption closely follows the combined BE and GT acceptance rate plot shown inFig. 14. At higher acceptance rates, the dynamic power consumption is high, and vice versa. Also the peaks in dynamic power consumption plots are mirrored by troughs in leakage power consumption, and vice versa.
The virtual channel buffers are the main contributors to both dynamic and leakage power consumption in NoC. Fig. 17 plots the power consumed by the buffers at 0.05 injection rate. There is an increase in the power consumption of the GT virtual channel buffers as the GT/BE
0.025 0.05 0.075 0.1 GT/BE=0.25 GT/BE=0.5 GT/BE=1 0 0.005 0.01 0.015 0.02 0.025 0.03 0.035 0.04 0.045 0.05 Acceptance Rate (packets/cycle/node)
Injection Rate (packets/cycle/node) GT/BE=0.25
GT/BE=0.5 GT/BE=1
Fig. 13. Acceptance rate GT.
0.025 0.05 0.075 0.1 GT/BE=0.25 GT/BE=0.5 GT/BE=1 0 0.005 0.01 0.015 0.02 0.025 0.03 0.035 0.04 0.045 0.05 Acceptance Rate (packets/cycle/node)
Injection Rate (packets/cycle/node) GT/BE=0.25
GT/BE=0.5 GT/BE=1
ratio increases from 0.25 to 1.0 since the utilization of the GT virtual channels increases with the increasing values ofr. However, for GT/BE ratio of 0.5 we see the power consumption in the BE virtual channel buffers to be more than the GT virtual channel buffers. This is observed since the BE virtual channels can be used to transfer GT traffic but not vice versa.
The power consumption of the individual components of the router network for an injection rate of 0.05 for the different values ofrhas been shown in theFig. 18. It can be seen from the plots that the virtual channel buffers are the dominant consumers of total power. It can also be
0.025 0.05 0.075 0.1 GT/BE=0.25 GT/BE=0.5 GT/BE=1 0 10 20 30 40 50 60 70 80 Power (mW)
Injection Rate (packets/cycle/node) GT/BE=0.25
GT/BE=0.5 GT/BE=1
Fig. 15. Dynamic power BE/GT.
0.025 0.05 0.075 0.1 GT/BE=0.25 GT/BE=0.5 GT/BE=1 1.265 1.27 1.275 1.28 1.285 1.29 Power (mW)
Injection Rate (packets/cycle/node)
GT/BE=0.25 GT/BE=0.5 GT/BE=1
observed that the header decoders, arbiter, and the link controllers also contribute significantly to the total power consumption.
Figs. 19–29 show similar plots for the router network under Poisson traffic distribution. It should be noted that the results of the latencies, acceptance rates and power consumption for the Poisson traffic model is very similar to that of the uniform random traffic model.This proves that our router design can effectively support both kinds of traffic profiles.
Fifo_BE Fifo_GT GT/BE=0.25 GT/BE=0.5 GT/BE=1 0 4 8 12 16 20 Power (mW) GT/BE=0.25 GT/BE=0.5 GT/BE=1
Fig. 17. Fifo power BE/GT.
FIFO Head erde code r Arbi ter Cros sbar Vitu alCo ntro llers Link s GT/BE=0.25 GT/BE=0.5 GT/BE=1 0 5 10 15 20 25 Power (mW) GT/BE=0.25 GT/BE=0.5 GT/BE=1
The following conclusion can be inferred from the extensive experimentation performed with our router architecture supporting multiple levels of service:
For a low value of r¼0:25;theGTtraffic experiences almost zero queue latency and a low setup latency.Also the acceptance ofBEtraffic is high for this case.Hence,a low value of r(around0.25)
should be utilized when designing aNoC with GT andBEtraffic service levels.
7.2. Evaluation of error control schemes
We characterized the NoC for 0:18mm technology, and consider Vdd ¼1:8 V: We evaluated the performance of the error control schemes by assigning the noise voltage variance,sN to 0.5 V
0.025 0.05 0.075 0.1 GT/BE=0.25 GT/BE=0.5 GT/BE=1 0 100 200 300 400 500 600 700 800 900 1000 Latency (cycles)
Injection Rate (packets/cycle/node) GT/BE=0.25
GT/BE=0.5 GT/BE=1
Fig. 19. Network latency for BE(Poisson).
0.025 0.05 0.075 0.1 GT/BE=0.25 GT/BE=0.5 GT/BE=1 0 100 200 300 400 500 600 700 800 900 1000 Latency (cycles)
Injection Rate (packets/cycle/node) GT/BE=0.25 GT/BE=0.5 GT/BE=1
[45] and 0.36 V, respectively. The corresponding bit error rate, is 0.035 (high, H in plots) and 0.0063 (low, L in plots), respectively. The ratio of GT/BE packets generated,r, has been taken to be 0.25.
Fig. 30plots the overall acceptance rate of the NoC under low and high error rates using both the PAR and SEC error control schemes. The acceptance for the PAR scheme is lower than the SEC scheme for higher injection rates because of the latency involved in retransmission. For lower injection rates, the difference in the acceptance rates between the two schemes diminishes due to less traffic in the network.
0.025 0.05 0.075 0.1 GT/BE=0.25 GT/BE=0.5 GT/BE=1 0 500 1000 1500 2000 2500 3000 Latency (cycles)
Injection Rate (packets/cycle/node) GT/BE=0.25
GT/BE=0.5 GT/BE=1
Fig. 21. Queue latency for BE(Poisson).
0.025 0.05 0.075 0.1 GT/BE=0.25 GT/BE=0.5 GT/BE=1 0 100 200 300 400 500 600 700 800 900 1000 Latency (cycles)
Injection Rate (packets/cycle/node) GT/BE=0.25
GT/BE=0.5 GT/BE=1
Fig. 31 plot the network latencies under various injection and bit error rates. The network latency is always higher for the PAR scheme due to retransmission delay. This is reinforced by the overall acceptance plot in Fig. 30. The average latency is higher at high bit error rates because more number of flits are prone to error and are hence retransmitted.
Fig. 32shows the network power consumption for low and high error rates using both the PAR and SEC schemes. The SEC power consumption for high injection rates is more than PAR due to high acceptance rates for SEC. For low injection and low bit error rates, the power consumption for the SEC scheme is almost equal to PAR scheme. However, the area consumed by the PAR implementation is lower than the SEC scheme, making it an attractive technique for error control
0.025 0.05 0.075 0.1 GT/BE=0.25 GT/BE=0.5 GT/BE=1 0 100 200 300 400 500 600 700 800 900 1000 Latency (cycles)
Injection Rate (packets/cycle/node) GT/BE=0.25
GT/BE=0.5 GT/BE=1
Fig. 23. Setup latency for GT(Poisson).
0.025 0.05 0.075 0.1 GT/BE=0.25 GT/BE=0.5 GT/BE=1 0 0.005 0.01 0.015 0.02 0.025 0.03 0.035 0.04 0.045 0.05 Acceptance Rate (packets/cycle/node)
Injection Rate (packets/cycle/node)
GT/BE=0.25 GT/BE=0.5 GT/BE=1
in this case. For all other cases ({low bit error rate, high injection rate}, {high bit error rate, low injection rate}, {high bit error rate, high injection rate}), SEC is a preferred choice due to high acceptance rates. Moreover, for low injection and high bit error case, the power consumed by the retransmission circuitry offsets the power consumed by error correction. The results for the error control schemes are summarized in Table 3. The table shows the appropriate error control schemes under different injection and bit error rates respectively.
Fig. 33shows the leakage power consumption for low and high error rates using both the PAR and SEC schemes. Leakage power consumption is more in the PAR scheme than in the SEC scheme since the dynamic power consumption is less and vice versa.
0.025 0.05 0.075 0.1 GT/BE=0.25 GT/BE=0.5 GT/BE=1 0 0.005 0.01 0.015 0.02 0.025 0.03 0.035 0.04 0.045 0.05 Acceptance Rate (packets/cycle/node)
Injection Rate (packets/cycle/node) GT/BE=0.25
GT/BE=0.5 GT/BE=1
Fig. 25. Acceptance rate GT(Poisson).
0.025 0.05 0.075 0.1 GT/BE=0.25 GT/BE=0.5 GT/BE=1 0 0.005 0.01 0.015 0.02 0.025 0.03 0.035 0.04 0.045 0.05 Acceptance Rate (packets/cycle/node)
Injection Rate (packets/cycle/node ) GT/BE=0.25
GT/BE=0.5 GT/BE=1
8. Conclusion
In this paper, we presented a cycle accurate performance and power evaluation model for BE and GT traffic with error correction/detection on mesh-based NoC. We presented results for extensive design space exploration and performance versus power trade-off analysis of a 44 mesh architecture. The experimental results were presented for both uniform and Poisson traffic distributions. The results demonstrated that our architecture is able to provide excellent support for both GT and BE traffic schemes as long as the GT/BE traffic ratio is around 0.25. On
0.025 0.05 0.075 0.1 GT/BE=0.25 GT/BE=0.5 GT/BE=1 0 10 20 30 40 50 60 70 80 Power (mW)
Injection Rate (packets/cycle/node) GT/BE=0.25
GT/BE=0.5 GT/BE=1
Fig. 27. Dynamic power BE and GT(Poisson).
0.025 0.05 0.075 0.1 GT/BE=0.25 GT/BE=0.5 GT/BE=1 1.26 1.265 1.27 1.275 1.28 1.285 1.29 Power (mW)
Injection Rate (packets/cycle/node)
GT/BE=0.25 GT/BE=0.5 GT/BE=1
the basis of their performance and power consumption characteristics it was also shown that PAR (single error control) scheme is better than the SEC (single error correction) at low injection and low error rates. In all other circumstances the SEC scheme gives better performance.
The current version of the model is limited to mesh based topologies supporting deterministic routing schemes and synthetically generated traffic. Future work will address developing
FIFO Head erde code r Arbi ter Cros sbar Vitu alCo ntro llers Link s GT/BE=0.25 GT/BE=0.5GT/BE=1 0 5 10 15 20 25 Power (mW) GT/BE=0.25 GT/BE=0.5 GT/BE=1
Fig. 29. Component power(Poisson).
0.025 0.075 SEC_H Parity_H SEC_L Parity_L 0 0.005 0.01 0.015 0.02 0.025 0.03 0.035 0.04 0.045 0.05 Acceptance Rate (packets/cycle/node) Injection Rate SEC_H Parity_H SEC_L Parity_L
router architectures and related power and performance models for generic topologies. Adaptive routing schemes would also be explored. Finally, design space exploration would be performed with communication traces of realistic benchmark applications that are mapped to NoC architectures. 0.0250.075 SEC_H Parity_H SEC_L Parity_L 0 50 100 150 200 250 300 350 400 450 500 Latency (cycles) SEC_H Parity_H SEC_L Parity_L Injection Rate Fig. 31. Network latency PAR/SEC.
0.025 0.075 SEC_H Parity_H SEC_L Parity_L 0 10 20 30 40 50 60 70 80 Power (mW) SEC_H Parity_H SEC_L Parity_L Injection Rate
References
[1] D. Sylvester, K. Keutzer, A global wiring paradigm for deep submicron design, IEEE Trans. Comput. Aided Design Integrated Circuits Systems (2000) 242–252.
[2] R.Ho, K. Mai, M. Horowitz, The future of wires, Proc. IEEE (2001) 490–504.
[3] J. Davis, D. Meindl, Compact distributed RLC interconnect models—Part II: coupled line transient expressions and peak crosstalk in multilevel networks, IEEE Trans. Electron Devices 47 (11) (2000) 2078–2087.
[4] P. Guerrier, A. Greiner, A generic architecture for on-chip packet-switched interconnections, in: DATE, Paris, France, March 2000.
[5] M. Sgroi, M. Sheets, A. Mihal, K. Keutzer, S. Malik, J. Rabeay, A. Sangiovanni-Vincentelli, Addressing the system-on-a-chip interconnect woes through communication-based design, in: Proceedings of Design Automation Conference, June 2001, pp. 667–672.
[6] William J. Dally, Brian Towles, Route packet, not wires: on-chip interconnection networks, in: Proceedings of DAC, June 2002.
[7] Luca Benini, Giovanni De Micheli, Networks on chips: a new SoC paradigm, IEEE Comput. (2002) 70–78. 0.025 0.075 SEC_H Parity_H SEC_L Parity_L 1.2 1.21 1.22 1.23 1.24 1.25 1.26 1.27 1.28 1.29 1.3 1.31 Power (mW) Injection Rate (packets/c ycle/node) SEC_H Parity_H SEC_L Parity_L
Fig. 33. Leakage power PAR/SEC. Table 3
Summary of error control schemes
Injection rate (Low) Injection rate (High)
Bit error rate (low) PAR SEC
[8] S. Kumar, A. Jantsch, M. Millberg, J. Oberg, J.P. Soininen, M. Forsell, K.T.A. Hemani, A network on chip architecture and design methodology, in: IEEE Computer Society Annual Symposium, on VLSI, Pittsburg, Pennsylvania, April 2002.
[9] S. Lin, D.J. Costello, Error Control Coding: Fundamentals and Applications, Prentice-Hall, Englewood Cliffs, NJ, 1983.
[10] A. Andriahantenaina, A. Greiner, Micro-network for SoC: implementation of a 32-port SPIN network, in: DATE, Munich, Germany, March 2003.
[11] A. Andriahantenaina, H. Charlery, A. Greiner, L. Mortiez, C.A. Zeferino, SPIN: a scalable, packet switched, on-chip micro-network, in: DATE, Munich, Germany, March 2003.
[12] D. Siguenza-Tortosa, J. Nurmi, Proteo: a new approach to network-on-chip, in: Proceedings of IASTED International Conference on Communication Systems and Network, Malaga, Spain, 2002.
[13] D. Siguenza-Tortosa, J. Nurmi, VHDL-based simulation environment for Proteo NoC, in: High-Level Design Validation and Test Workshop, Paris, France, October 2002.
[14] M. Dall’Osso, G. Biccari, L. Giovanninni, D. Bertozzi, L. Benini, Xpipes: a latency insensitive prameterized network-on-chip architecture for multi-processor SoCs, in: Proceedings of ICCD, San Jose, CA, October 2003. [15] M. Millberg, E. Nilsson, R. Thid, S. Kumar, A. Jantsch, The Nostrum backbone—a communication protocol
stack for networks on chip, in: VLSI Design Conference, Mumbai, India, January 2004.
[16] M. Millberg, E. Nilsson, R. Thid, A. Jantsch, Guaranteed bandwidth using looped containers in temporally disjoint networks within the Nostrum network on chip, in: DATE, February 2004, pp. 890–895.
[17] J. Dielissen, A. Ra˘dulescu, K. Goossens, E. Rijpkema, Concepts and implementation of the Philips network-on-chip, in: IP-Based SOC Design, November 2003.
[18] E. Rijpkema, K.G.W. Goossens, A. Radulescu, Trade offs in the design of a router with both guaranteed best-effort services for networks on chip, in: DATE, 2004.
[19] D. Bertozzi, L. Benini, G. De Micheli, Low power error resilient encoding for on-chip data buses, in: DATE, 2003. [20] H. Zimmer, A. Jantsch, A fault model notation and error-control scheme for switch-to-switch buses in a
network-on-chip, in: ISSS/CODES, 2003.
[21] F. Worm, P. Ienne, P. Thiran, G. De Micheli, An adaptive low-power transmission scheme for on-chip networks, in: Proceedings of ISSS, Kyoto, Japan, 2002.
[22] X. Chen, L.-S. Peh, Leakage power modeling and optimization in interconnection networks, in: Proceedings of ISLPED, Seoul, Korea, 2003.
[23] T. Simunic, S. Boyd, Managing power consumption in networks on chips, in: Proceedings of DATE, Paris, France, 2002.
[24] J. Duato, S. Yalamanchili, L. Ni, Interconnection networks, an engineering approach, IEEE Computer Society, 1997.
[25] H.J. Seigel, A model of SIMD machines and a comparison of various interconnection networks, IEEE Trans. Comput. 28 (12) (1979) 907–917.
[26] W.J. Dally, Performance analysis of k-ary n-cube interconnection network, IEEE Trans. Comput. 39 (6) (1990) 775–785.
[27] J.F. Draper, J. Ghosh, A comprehensive analytical model for wormhole routing in multicomputer systems, J. Parallel Distributed Comput. 23 (1994) 202–214.
[28] D. Brooks, V. Tiwari, M. Martonosi, Wattch: a framework for architectural-level power analysis and optimizations, in: International Symposium on Computer Architecture, 2000, pp. 83–94.
[29] W. Ye, N. Vijaykrishna, M. Kandemir, M.J. Irwin, The design and use of simplepower: a cycle-accurate energy estimation tool, in: Proceedings of Design Automation Conference, June 2000.
[30] T. Givargis, F. Vahid, J. Henkel, Instruction-based system-level power evaluation of system-on-a-chip peripheral cores, IEEE Trans. VLSI 10(6) (2002).
[31] Arm Inc., AMBA specification, 1999. [32] IBM, The coreconnect bus architecture, 1999.
[33] D.Wingard, MicroNetwork-based integration of SOCs, in: DAC, Las Vegas, Nevada, June 2001.
[34] A.G. Wassal, M.A. Hasan, Low-power system-level design of VLSI packet switching fabrics, IEEE Trans. CAD 20 (2001) 723–738.
[35] Terry T. Ye, Luca Benini, Giovanni De Micheli, Analysis of power consumption on switch fabrics in network routers, in: Proceedings of DAC, 2002.
[36] D. Pamunuwa, J. Oberg, L.R. Zheng, M. Millberg, A. Jantsch, H. Tenhunen, Layout, performance and power trade-offs in mesh-based network-on-chip architectures, in: IFIP International Conference on Very Large Scale Integration (VLSI-SOC), Darmstadt, Germany, December 2003, pp. 362–367.
[37] H.-S. Wang, L.-S. Peh, S. Malik, Orion: a power-performance simulator for interconnection network, in: International Symposium on Microarchitecture, Istanbul, Turkey, November 2002.
[38] E. Bolotin, I. Cidon, R. Ginosar, A. Kolodny, Cost considerations in network on chip, in: Integration—the VLSI Journal, November 2003.
[39] A. Pinto, L.P. Carloni, A.L. Sangiovanni-Vincentelli, Efficient synthesis of networks on chip, in: ICCD, 2003. [40] J. Hu, R. Marculescu, Energy-aware communication and task scheduling for network-on-chip architectures under
real-time constraints, in: DATE, Paris, France, February 2004.
[41] S. Murali, G. De Micheli, Bandwidth constrained mapping of cores onto NoC architectures, in: DATE, Paris, France, February 2004.
[42] P. Sotiriadis, A. Chandrakasan, A bus energy model for deep sub-micron technology, IEEE Trans. VLSI 10(3) (2002).
[43] Berkeley predictive technology modeling,http://www-device.eecs.berkeley.edu/ptm, technical report.
[44] N. Banerjee, P. Vellanki, K.S. Chatha, A power and performance model for network-on-chip architectures, in: DATE, 2004.
[45] R. Hegde, N. Shanbhag, Towards achieving energy efficiency in presence of deep submicron noise, IEEE Trans. VLSI 8 (4) (2000) 379–391.
[46] L. Li, N. Vijaykrishnan, M. Kandemir, M.J. Irwin, Adaptive error protection for energy efficiency, in: ICCAD, 2003.