Clustering Algorithm Analysis of Web Users
with Dissimilarity and SOM Neural Networks
Xiao Qiang
School of Economics and management, Lanzhou Jiaotong University, Lanzhou; China, Email:[email protected]
Qian Xiao-dong
2, Lanzhou Jiaotong University Graduate School, Lanzhou; China, Email:qianxd@mail. lzjtu.cn
Liao Hui
School of Economics and management, Lanzhou Jiaotong University, Lanzhou; China, Email:[email protected]
Abstract—To effectively organize and analyze massive web information, design a web user’s clustering mining algorithm. SOM neural network algorithm has lots of disadvantages, to solve the data clustering, propose a new method that uses D-SOM (Dissimilarity-Self Organizing feature Mapping) algorithm, for clustering web user’s. This algorithm can estimate the center and number of clustering data set by dissimilarity computing, optimize SOM neural network learning and improve clustering effect. Through design the experiment, these web data are collected and processed by D-SOM algorithm Experimental results verify which D-SOM clustering algorithm has better clustering accuracy and imore efficient than SOM neural network algorithm.
Index Terms—Clustering; Dissimilarity; Self Organizing feature Mapping; E-commerce
Ⅰ.INTRODUCTION
With the information technology development, E-commerce offers the different forms of platform for the various business activities by using internet [1]. How to help users gain exact information quickly is becoming an urgent problem, especially web data mining technology is the core problem in network for researchers.
The web log files contains the information of customers browse, if we can effectively analyze the web logs and understand customers behaviors, we can reveal the relation between web users and access paths, improve web site, find the behavior of user’s access, and provide web user’s personalized service support.
In knowledge discovery in database, SOM neural network has developed rapidly in recent years, it solved many data mining problems, because neural network can simulate human brain thinking, and strength ability to learn [2]. We can optimize cluster effect by iterative computation. However, it is observed that SOM has many disadvantages, so in this paper, we use improved SOM
neural network as clustering to design the system of web clustering mining.
This paper is organized as follows. In section 2 we will review web log data and build web session matrix. In section 3 we will introduce SOM neural network structure and the lack of clustering in the data. In section 4 we will introduce D-SOM neural network algorithm, followed by the experimental evaluations in section 5. The conclusions will be given in section 6.
Ⅱ.BUILDING MATRIX OF WEB USER’S DIALOGUE When a user access to website, it will come into being a series of log files in websites. The log files are recorded in the web server. The web log files include data and time , IP address , the method , status , size , agent and referee [3].In order to realize clustering analysis about E-commerce websites of users, we need to obtain the users browse mode and extract users the information the server logs, namely:
P=<ip|(url-id ,url-time)>
Where P denotes browse page in a certain of time, where IP denotes access to Ecommerce site users, where url-id denotes access the page, where url-time denotes the user access a web page time.
To web users ,if the pages of the visits isn’t successful, or access time is less than the threshold of visited links, these web users will be deleted, according to the final web users session, establish Tables I, the list below:
TABLEⅠ WEB USER’S SESSION I P UR L1 UR L2 UR L3 …… …. URL N i p1 0 1 1 …… …. 0 i p2 0 1 0 …… …. 1 ………. i pn 1 0 0 …… …. 1
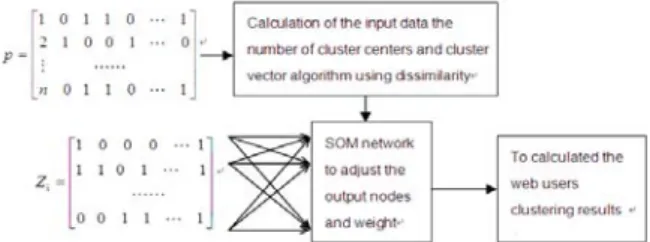
As the table Ⅰ shows, where URLN denotes E-commerce website links, ipn denotes user which access to E-commerce web site, where 0 denotes the users do not click the link of the website, where 1 denotes the user the link of website. We build the matrix P of web user session by use Table I: 1 0 0 1 ip 1 0 1 0 ip 0 1 1 0 ip n 2 1 L L L L L = P (1)
The matrix P will be input vector and processed in SOM neural network, to realize clustering of web user.
Ⅲ.THE SOM NEURAL NETWORK
Self-organized feature mapping neural network is named SOM neural network, and it is the numerical simulation method. It was present by Kohonen professors according to the characteristics of the human brain[5][6]. The SOM algorithm mainly includes the competition, cooperation, weights adjust; obtain network training and unsupervised organization learning [9]. The SOM neural network structure is shown in Fig.1:
Fig 1 SOM neural network structure
From Fig.1, the network includes input layer , output layer and weight. The input layer includes input nodes and input vector, the output layer includes output nodes and output vector, there is weight between input layer and output layer [8][9].Where xnk denotes the input vector, yj denotes the output vector, Wij denotes weight. The input vector will be clustered in output layer by computed and adjusted Wij. So we can obtain clustering result of data sets. However, SOM neural network structure has disadvantages, the clustering effect isn’t satisfied, the reasons include:
1) It is difficult to establish output nodes, affecting the clustering effect about date sets.
2) Linking the output node of the weight, select the initialization values may lead to different clustering results.
How to improve these disadvantages, we need to fix the input vector and select a suitable weight, so we can obtain a better clustering effect. In section 4, we propose a new algorithm to address these deficiencies.
Ⅳ.D-SOMNEURAL NETWORK ALGORITHM
Analyzed the shortcomings of the SOM neural network, a new algorithm is presented. Input vector will be clustered by dissimilarity-calculated. According to the number clustering and center clustering vector, we can determine the output layer number nodes and link weight between the input nodes and the output nodes. So cluster initialization data will be entered into the input layer of SOM network, so we can obtain a better clustering effect. On basis of D-SOM neural network, the system of web users clustering is designed as Fig.2
Fig.2 The system of D-SOM Algorithm
A. Input Vectors Dissimilarity-calculated
Dissimilarity denotes the similar degree between object and object. How to calculate the dissimilarity, to binary variables, the dissimilarity will be calculated by the Jaccard coefficient d (i,j) [4] [7], given by:
10 01 11 00 11 00 ) , ( f f f f f f j i d + + + + = (2)
Where f00 denotes number, when x and y take 0, f01 denotes number, when x take 0 and y take 1, f10 denotes number, when x take 1 and y take 0, f11 denotes number, when x and y take 0. the greater Jaccard coefficient means the more similar to two objects, the smaller means the less similar to two objects.
Dissimilarity can be expressed by dissimilarity matrix [10] [11], so we can build the dissimilarity matrix according matrix of web users dialogue, given by:
⎥ ⎥ ⎥ ⎥ ⎦ ⎤ ⎢ ⎢ ⎢ ⎢ ⎣ ⎡ = 0 ) 3 , ( ) 2 , ( ) 1 , ( (, ) 0 ) 2 , 3 ( ) 1 , 3 (2,1) 0 ( 0 ) ( L L n d n d n d j i d d d d t D (3)
The clustering of matrix D (t) is as follows:
1) Select the largest element d (i,j) in the matrix D (t), when t=0, i line and j line merged into a class.
2) Calculate dissimilarity between the new class and other class. Build a new dissimilarity matrix D (t+1).
3) If all simples have been clustered into one class, then stop algorithm, otherwise t=t+1, go to step 2.
4) Set different thresholds to get different center clustering.
In order to understand the dissimilarity matrix D, we take a sample, matrix p [6×7] given by:
⎥⎦ ⎤ ⎢⎣ ⎡ = ⇒ ⎥ ⎥ ⎦ ⎤ ⎢ ⎢ ⎣ ⎡ = ⇒ ⎥ ⎥ ⎦ ⎤ ⎢ ⎢ ⎣ ⎡ = ⇒ ⎥ ⎥ ⎥ ⎦ ⎤ ⎢ ⎢ ⎢ ⎣ ⎡ = ⇒ ⎥ ⎥ ⎥ ⎥ ⎥ ⎦ ⎤ ⎢ ⎢ ⎢ ⎢ ⎢ ⎣ ⎡ = ⇒ ⎥ ⎥ ⎥ ⎥ ⎥ ⎦ ⎤ ⎢ ⎢ ⎢ ⎢ ⎢ ⎣ ⎡ = ⇒ ⎥ ⎥ ⎥ ⎥ ⎥ ⎦ ⎤ ⎢ ⎢ ⎢ ⎢ ⎢ ⎣ ⎡ = ⇒ ⎥ ⎥ ⎥ ⎥ ⎥ ⎦ ⎤ ⎢ ⎢ ⎢ ⎢ ⎢ ⎣ ⎡ = 0 4286 . 0 0 2 4 c 0 2857 . 0 5714 . 0.42860 0 0 5 2 3 c 0 2857 . 0 5714 . 0.42860 0 0 5 2 1 c 0 5714 . 0 4286 . 0 7143 . 0.5714 0.28570 0.4286 0 0 0 6 5 2 1 c 0 5714 . 0 4286 . 0 5714 . 0 7143 . 0 5714 . 0.71430.57140.42860.2857 0 0.2857 0.4286 0.85710 0.1429 0.2857 0 0.85710 0 0 6 5 4 3 2 1 0 ) 5 , 6 ( ) 4 , 6 ( ) 3 , 6 ( ) 2 , 6 ( ) 1 , 6 (5,1) (5,2) (5,3) (5,4) 0 (4,1) (4,2) (4,2) 0 (3,1) (3,2) 0 (2,1) 0 ( 0 6 5 4 3 2 1 0 ) 5 , 6 ( ) 4 , 6 ( ) 3 , 6 ( ) 2 , 6 ( ) 1 , 6 (5,1) (5,2) (5,3) (5,4) 0 (4,1) (4,2) (4,2) 0 (3,1) (3,2) 0 (2,1) 0 ( 0 6 5 4 3 2 1 1 0 0 1 0 1 011 0 0 0 1 1 0 0 01 0 0 001 0 0 1 0 0 1 0 0 1 0 0 1 01 10 01 1 6 5 4 3 2 1 c D x c D x c D x x c D x x x x x x D d d d d d d d d d d d d d d d x x x x x x D d d d d d d d d d d d d d d d x x x x x x D x x x x x x P
The c4 and c2 cluster into one class, denoted by c5. The clustering dendrogram is shown as Fig.2:
Fig.2 the Clustering dendrogram
According to cluster dendrogram, set dissimilarity threshold α is 0.6 and determine the cluster center vector data sets x1, x4, x5.
B. Determine the Output Layer and Link Weight of SOM Neural Network
By calculating the dissimilarity matrix, we get the Web site of the Web user clustering center vector C1, C2 ... Cn and the number of clusters,the process is as follow:
Step 1: SOM neural network output nodes determined by the number of clusters.
Step2:SOM neural network to determine the regulation of weights obtain from the dissimilarity matrix of the cluster center vector clustering, such as W1=C1, W2=C2……Wn=Cn.
Step 3: Matrix P in the session from the Web site of vector composed of WEB users, as the network input samples, one sample represents a user's access link.
Step 4: Calculate the input vector at time the distance to all the output nodes,
2 1 )) ( ) ( (
∑
= − = n i ij i j x t W t d (4)Where dj denotes at time t the distance the distance, where xi (t) is input vector.
Step 5: Select a minimum of nodes as the best match neuron that i (x) = min (dj), neuron i as we have obtained neurons.
Step 6: By updating the formula to adjust weight
vector neurons, adjust the output node of the connection weights vector. )) ( ) ( )( ( ) ( ) 1 (t W t t xt W t Wij + = ij +η − ij (5), Where ) 100 1 ( ) (t =e−n − t η
Step 7: The training times for different t, repeat steps 2, until the network weights stabilize as convergence.
Step 8: Network convergence, according to the node response, determine the sample clustering.
V.EXPERIMENTS
In order to prove that SOM method and the D-SOM method to cluster in the Web site data, in this paper to evaluate by the density of cluster and the average separation between the two clustering [12]. The density of cluster is concentrated all the data points and the center of similarity, that the value is the higher denotes the effect that clustering is the better.
∑
∈=
) (/
)
,
(
1
p N o iS
m
c
dist
S
,Where
dist
(
c
i,
S
)
denotes that the distancebetween two points, the method can be used in Euclidean distance, Manhattan distance, and Minkowski distance. If dist (Ci, S) = 0, then that Ci, S is a point, not to each other as Ci neighbors. N (p) said that after the data points and cluster, m set number of clusters that cluster.
The average separation between the clustering is the difference between the centers of the different degree of clustering, that on average value is higher denot effect that clustering is the better.
nn c c c c c c ds n i n j jm im j i j i ) ( ) ( ) / ( 1 1 2 2 2 2 2 1 1
∑∑
= = − + − + − = L Where(
c
i1,
c
i2,L
c
im)
and(
c
j1,
c
j2,L
c
jm)
denote he centers of clustering.In this experiment, the operating environment is Pentium (R) Dual-core CPU E5300 2.6GHZ 1.98GB RAM, experimental software is MATLAB2007b. Experiments using UCI KDD ARCHIVE sites provide access to log data
(http://kdd.ics.uci.edu/databases/msnbc/msnbc.data.html), use of Web log user access to data to construct the session matrix P, the two algorithms in accuracy and running time comparison, Web log of user data by removing the length of less than 4 sessions focused on recording and session length greater than 7 records, select one of the 160 users of experimental data as a URL link. And four data sets were collected 20, 40, 80,160, the assessment of two algorithms to cluster.
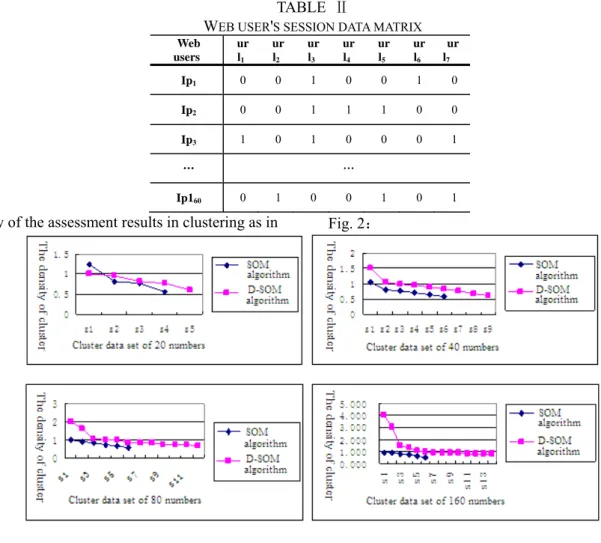
TABLE Ⅱ WEB USER'S SESSION DATA MATRIX
Web users ur l1 ur l2 ur l3 ur l4 ur l5 ur l6 ur l7 Ip1 0 0 1 0 0 1 0 Ip2 0 0 1 1 1 0 0 Ip3 1 0 1 0 0 0 1 … … Ip160 0 1 0 0 1 0 1
Density of the assessment results in clustering as in Fig. 2:
Figure 2: SOM clustering algorithm and the improved SOM algorithm assessment within the density map The average separation between the assessment of clustering is shown in Fig. 3:
Fig. 3: SOM algorithm and the improved SOM algorithm the average separation within the evaluation map From Fig. 2, clustering within the density assessment
maps can be seen that the amount of data for different SOM algorithm and the improved SOM algorithm, clustering effect is not the same. In a small amount of data, the two algorithms are similar, but with the increasing amount of data, the improved SOM algorithm to cluster significantly is better than SOM algorithm. From Fig. 3, the average separation between poly assessment charts can be seen, for different data, the improved SOM algorithm to cluster the data better than the SOM algorithm to cluster the data. Mainly because of the improved SOM algorithm can create more accurate SOM output nodes, and initialize the weights closer to the
cluster center. SOM algorithm using the improved access to the Web site clustering can be linked with the same access to interest users together, Web site easy to improve the website's link structure, once again access to the IP for different users according to the specific Web site is services, improve site click-through rates and increase the efficiency of Web site users to buy.
Ⅵ. CONCLUSION
In this paper, the proposed method for Web user access patterns in the clustering is valid. The data have proved this experiment, the SOM algorithm for neural network
itself defective and that in the data mining application is not very good. In this paper, the SOM algorithm to improve the lack of improvement can be well used in Web log data mining. Improving the design of personalized business website has broadened application prospects. Further work is the combination of the user's registration information, such as age, gender, income, region, etc., to access the time to extend this algorithm.
ACKNOWLEDGEMENT
This work is supported National Funds of Social Science (NO. 08XTQ010) by to Qian Xiao-dong respectively and project supported by young scholars science Foundation of LAN Zhou Jiao Tong university (NO.2011044).
REFERENCES
[1] Zhou Huan, Huang Li-Ping. C-means clustering
algorithm based on SOM neural network. Computer Application.2007.VOL.27 NO.6 Page 51-52
[2] Guo Wei-ye,Zhao Xiao-dan,Pang Ying-zhi,etc Reseach on Clustering Algorithm Based on SOM Neural Network in Data Mining. Information Science.2009.vol.26 NO.6
Page874-876
[3] Li Gang AN Lu.Clustering analysis of E-commerce
Transactions with self-organizing map.New Techonlogy Of Library and Information Sercice 2008.VOL.169 NO.9
Page70-77
[4] DONG Yi-Hong ZHUANG Yue-Ting.Web log mining
based on a novel a novel competitive neural
network.Journal Of Computer Research And
Development.2003.vo1.40 NO.5 Page:661-667
[5] KRISHMA.MURTY MN. Cenetiv k-means
algorithm.IEEE Transactions on system,Man and
Cybemetics Part B.1999.VOL.29 NO.3:433-439.
[6] KOHONEN T. Self organized formation of topologically
correct fear ture maps.Biological Cy-bemetics
1982.VOL.43 NO.1:59-69.
[7] G A Carpenter,S Grossberg.A massively parallel
architecture for a self-organizing neural pattern
recognition machine.Computer vision,Graphics and
Image Processing,1987,VOL.37:54-115.
[8] J Kangas, T Kohonen et al.Variants of self-organizing
maps,IEEE Trans on Neural Networks,1990,VOL.1
NO.1:93-99
[9] Ding C,Patra J C.User Modeling for Personalized Web
Search with Self-Organizing Map.Journal of the
American Society for information Science and Technology.2007.VOL.58 NO.4:494-507
[10] Zhao Ming-Qing, JIANG Chang-Jun, Tao Shu-feng, dissimilarity matrix based on equivalence of cluster.
Computer Science, 2004,VOL.31 NO.7 :183-184
[11] Gu Zongwei, in Huijuan, based on the dissimilarity
measure of the graph clustering method. Shanxi
Agricultural University. 2009,VOL.29 NO.3 :284-288
[12] Bing Liu a, Yu Chung, Xue Guirong, South Korea set a translation. Web data mining.Tsinghua University Press,