Procedia Environmental Sciences 33 ( 2016 ) 317 – 323
1878-0296 © 2016 The Authors. Published by Elsevier B.V. This is an open access article under the CC BY-NC-ND license (http://creativecommons.org/licenses/by-nc-nd/4.0/).
Peer-review under responsibility of the organizing committee of LISAT-FSEM2015 doi: 10.1016/j.proenv.2016.03.082
ScienceDirect
The 2
ndInternational Symposium on LAPAN-IPB Satellite for Food Security and Environmental
Monitoring 2015, LISAT-FSEM 2015
Web-Based clustering application using Shiny framework and
DBSCAN algorithm for hotspots data in peatland in Sumatra
Rachma Hermawati* and Imas Sukaesih Sitanggang
Department of Computer sciences, Faculty of Mathematics and Natural Sciences, Bogor Agricultural University, Indonesia
Abstract
Forest and land fires currently have become serious problems in Indonesia. Peatlands are frequently burnt because of its character istic, i.e. combustible when it was in dried condition. In the previous work, hotspots as on indicators for forest and land fires inclu ding in peatland were analyzed by applying density based clustering algorithm namely Density-Based Spatial Clustering Algorith m with Noise (DBSCAN). Clustering results hotspots distribution that can be used for preventing and controlling fire events. Thi s research aims to build a web-based clustering application for grouping hotspot data in peatlands in Sumatra using the Shiny fra mework, that is available in programming language R. Clustering was performed on hotspots data in peatland in 2002 and 2013 u sing the DBSCAN algorithm. This algorithm finds clusters by identifying areas that have a high hotspots density. The application was successfully built and has several features, namely: a) clustering hotspots, b) visualization of clustering results based on a ty pe of landuse, land depth, and peat type, c) providing the value of within cluster for cluster evaluation, and d) displaying a summ ary of clustering results. These features have been tested using the blackbox approach and the test results show that the features w ork properly and produce outputs in corresponding to the test scenario.
© 2016 The Authors. Published by Elsevier B.V.
Peer-review under responsibility of the organizing committee of LISAT-FSEM2015. Keywords: Clustering; DBSCAN; hotspots; peatland fires; R; Shiny
* Corresponding author. Tel.: +62-857-1525-7152
E-mail address: [email protected]
© 2016 The Authors. Published by Elsevier B.V. This is an open access article under the CC BY-NC-ND license (http://creativecommons.org/licenses/by-nc-nd/4.0/).
318 Rachma Hermawati and Imas Sukaesih Sitanggang / Procedia Environmental Sciences 33 ( 2016 ) 317 – 323
1. Introduction
Peatland area in Indonesia is estimated at 12.8 million hectares or about 10.8 percent of the land area of Indonesia [1]. The total area of about 4.5 million acres or 35 percent are found in Sumatra. At this moment, a peat thickness had shrinkage caused by forest-and-land fires [1]. Forest-and-land fires disaster is a serious problem that must be faced by Indonesia almost every year during the dry season. Fires that have occurred not only on dry land but also on wetlands (particularly peat). Peatland fires are much more difficult to be handled than the fires that have occurred in the soil minerals forest or the highlands [2] because a fire in peatland is difficult to know its spread. The fire could spread to the large area or extends to a location much further in which the fire cannot be seen from the surface. In addition, during the dry season, the surface of the peatland will be drying fast and can turn into charcoal-like nature that causes flammable peatland [2]. The incident of forest and peatland fires that recently happened in Indonesia left a very great damage. Since February 20 through March 11, 2014, Global Forest Watch detected 3101 high confidence hotspots alerts in Sumatra island using NASA’s Active Fire Data [3]. The Fig. exceeds the total number of 2643 hotspots alerts detected on March 13 to June 30, 2013, at the peak of the previous fires and haze crisis [3].
Adinugroho et al. [2] informs that data hotspots can be used as one indicator of a possible occurrence of fires. Therefore, it is necessary to do hotspots analysis to be used as reference in the control of forest-and-land fires. One of the hotspots data analysis techniques that can be used is the clustering technique. Clustering algorithms have been applied on hotspots data in the previous works. The clustering method k-means was used in [4] to identify global and collective outliers on hotspot frequency in the study area Riau Province, Indonesia. In addition, the work [5] developed a web-based Online Analytical Processing (OLAP) to visualize k-means clustering results on hotspot data in Indonesia. Another algorithm for clustering is the Density-Based Spatial Clustering Algorithm with Noise (DBSCAN) that is designed to find clusters and noises on spatial data [6].
DBSCAN is clustering algorithms that developed based on the level of density of the data. DBSCAN looking the center of objects, that is the objects that have a dense neighborhoods. DBSCAN connects the center of the object with its neighborhoods to form 1 areas as cluster [7]. DBSCAN algorithm first introduced by Esther et al. [6] in 1996 designed to look for clusters and noises on spatial data. This algorithm has two main parameters, namely Eps and MinPts. Eps is the minimum distance from the center of the cluster object in neighborhood, while MinPts is the minimum amount of neighbor from the central object of a cluster [6].
A previous research conducted clustering on hotspots data of Sumatra using the DBSCAN algorithm [8], but it had not yet built a web-based clustering application for hotspots data. A web-based clustering application is needed to make easier to analyze clustering results of hotspots data because it can be accessed from anywhere and anytime. Many frameworks that can be used to build a web-based application, one of which is Shiny. Shiny is a framework that uses the programming language R. Shiny is easy to use to build interactive web applications. Automatic binding reaction between input, output, and pre-built widgets causes Shiny to be able to build responsive applications. Therefore, this research utilizes the Shiny framework in programming language R to develop a web-based application for clustering hotspots data using the DBSCAN algorithm.
2.
MethodsThe data used in this research are hotspots data in 2002 and 2013 in peatland in Sumatra. Data were obtained from the previous research [8] that sourced from the Ministry of Forestry of the Republic of Indonesia and have been through the preprocessing data stage that are data cleaning and data reduction. Data cleaning and data reduction was aim to get the attribute longitude and latitude. There are 13253 hotspots of Sumatra peatland in 2002, and 3335 hotspots in 2013. The attribute used on both data are longitude and latitude. These data are stored in a file with csv format.
In addition to hotspots data in peatland in 2002 and 2013, spatial data in shapefile are used for visualization the clustering results. Shapefile data used are the shapefile of province borders in Sumatra in the file format -.shp, .dbf, .shx, .sbn, and .spx and the shapefile of peatland in Sumatra in the file format .shp, .dbf, .shx, .prj, and .qpj. Both these shapefile data were obtained from previous research [8] that sourced from Wetlands International Program Indonesia.
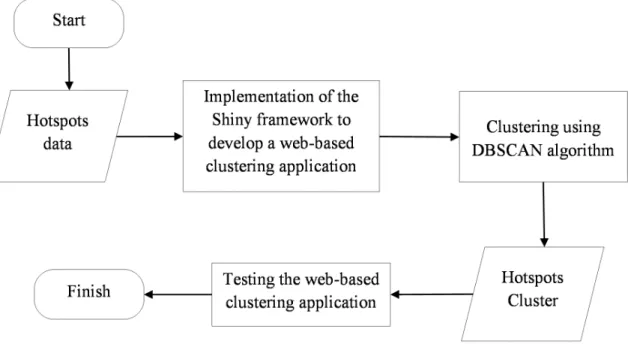
Fig. 1. Diagram of research method.
The research was conducted through the following steps as shown in Fig. 1: first, implementation of the Shiny framework to develop a web-based clustering application. Shiny is a package of the R programming language that makes it easy to deliver interactive data summaries to users through a web browser. At this step, a web-based clustering application was built using Shiny framework on RStudio. RStudio is an integrated development environment (IDE) for R language. It includes a console, syntax-highlighting editor that supports direct code execution, as well as tools for plotting, history, debugging and workspace management. The DBSCAN algorithm was implemented using the dbscanCBI function that is available in the fpc library in programming language R. The dbscanCBI function used in this application is a function that perform clustering using the DBSCAN algorithm. This function is reactive that any changes to the value of input will cause the reloading the dbscanCBI function and generate new clusters without reloading the browser page. The results of clustering are plotted using the ggplot function that is available in the ggplot2 library in RStudio. This ggplot function will display the results of clustering in the web browser with the attractive interface.
The second step is clustering hotspots data using the DBSCAN algorithm. Clustering was conducted on the web-based clustering application by user that has been built in the previous stage. Parameter values of Eps and MinPts in the DBSCAN algorithm are provided by a user as the input of the algorithm to run clustering. The value of Eps and MinPts which can be entered by the user is limited to within a range of values. The value range is determined based on the previous research [8]. That value range has been evaluated in previous research [8] and the evaluation indicates that the value range produces the good cluster, so this value range used in this research. The results obtained from this stage are hotspot cluster, the value of within cluster, as well as the plot of clustering result that displayed in web browser. The last step is testing the web-based clustering application. This step was conducted to know if the features of application that has been built are work properly or not. The main features of the application are clustering, displaying a plot based on types of landuse, peatland depth, and peatland type, showing the value of Within cluster, and displaying a summary of clustering results.
320 Rachma Hermawati and Imas Sukaesih Sitanggang / Procedia Environmental Sciences 33 ( 2016 ) 317 – 323
3. Results
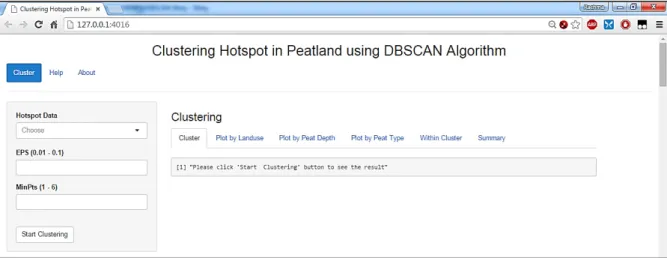
Shiny application is composed of two components, namely a server and an interface. The server part contains instructions which are used on the application and stored in the file Server.R. Input on the application is a dataset in a form of csv file. Furthermore, the dataset is modified into a data frame to be used as the input of the DBSCAN algorithm.
The interface part on the web-based clustering application contains instructions for displaying clustering results on the web page browser. These instructions are stored in the file UI.R. In the interface part using fluidPage function to produce a display that we can adjust the size of the user's browser. The interface component consists of headerPanel, sidebarPanel, and mainPanel. The headerPanel is the title page of the application. The sidebarPanel is the area which contains the various types of input that are used by users. To do the clustering, users must choose the data and enter the value of MinPts and Eps at the sidebarPanel in advance. The types of input used in this research are the selectInput to select a dataset to be used for clustering and the numericInput to get the value of Eps and MinPts. Then clustering results are displayed on the mainPanel.
Fig. 2 shows the application interface, the sidebarPanel is shown on the left of the screen. The section mainPanel tab is divided into cluster, plot by landuse, plot by peatland depth, plot by peatland type, value of Within cluster, and the summary tab. The cluster tab is the area to display clustering results. Plot tab is the area to display the plot of clustering results with the layer that can be selected for plotting, including landuse, peatland depth, or peatland type. The within cluster tab is area to display the values of Within cluster for cluster evaluation. The summary tab is an area to view a summary of clustering results. A summary of the clustering results consists of the value of Eps, MinPts, the number of clusters, noise, and the total value of within cluster.
Fig. 2. Main page of web-based clustering application.
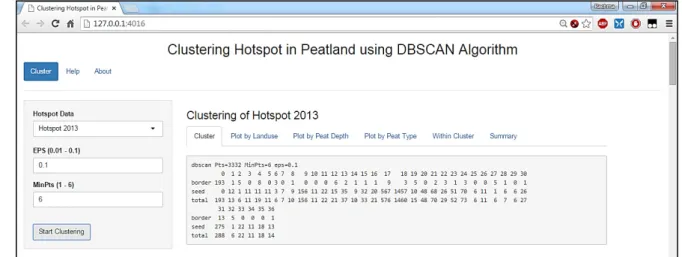
In this research, the experiment was performed with values of Eps 0.01 to 0.06 and 0.1, as well as the values of the MinPts 1 to 6 for each value of Eps. These values refer to the previous research [8]. The experiment was conducted directly on the application using hotspots data in peatland in 2002 and 2013. Fig. 3 represents a display of clustering results using hotspots data in peatland in Sumatra in 2013 with Eps = 0.1 and MinPts = 6.
Fig. 3. Clustering results on hotspots data in peatland in Sumatra in 2013.
In addition to displaying clustering results in the form of the number of clusters, border point, and the seed point, users can obtain the values of Within cluster that can be seen on the Within cluster tab as shown in Fig. 4. In Fig. 4, the table has 2 columns, namely cluster-i and value of within cluster. Above the table, there is the option to choose the number of clusters and value of within cluster that users want to display on the first page of the browser. The user can select 10, 25, 50, or 100 clusters to be visualized, the default value is 10 clusters. The application also displays the total value of Within cluster on the top of within cluster tab page. Total value of Within cluster can be compared to other clustering results based on parameters MinPts and Eps.
Fig. 4. Display of within cluster values.
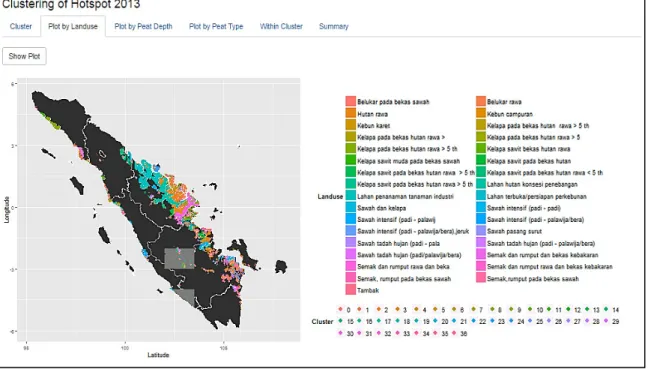
In addition to displaying clustering results and the value of cluster evaluation, on this application users can also plot clustering results based on landuse, peatland depth, and peatland type. In the plot, each object is represented by a small circle with different color for each cluster. Plot of clustering results on hotspots data based on landuse can be seen in Fig. 5.
322 Rachma Hermawati and Imas Sukaesih Sitanggang / Procedia Environmental Sciences 33 ( 2016 ) 317 – 323
Fig. 5. Plot of clustering results on hotspots data based on landuse.
After the application was successfully built and clustering hotspot data was performed, testing of the main features of the application was conducted. The main features of the application are clustering, displaying a plot based on types of landuse, peatland depth, and peatland type, showing the value of Within cluster, and displaying a summary of clustering results. The testing results for the main features of the application are provided in Table 1. The testing results indicate the features of the application can work properly and generates output in accordance with the test scenario.
Table 1. Testing results of the application.
No. Features Test Scenario Expected Results Work Properly
1 Clustering
The user selects data and inserts the value of Eps and MinPts that are appropriate to the defined range (Eps = 0.1; MinPts = 6) then press the button "Start Clustering"
The user selects data and inserts the value of the Eps and MinPts that are not appropriate to the defined range (Eps = 0.2; MinPts = 7 ) then press the button "Start Clustering"
Clustering overview appears in the form of the number of clusters, the number of border points, and the number of seed points.
Message error appears: “Eps must in range between 0.01 and 0.1”
Yes
Yes
2 Showing cluster plot based on
land use User press the button “Show Plot”
The map of Sumatra island appears with the land use layer and the hotspot layer along with a description of the legend of the cluster.
Yes
3 Plotting clustering results
based on peatland depth User press the button “Show Plot”
The map of Sumatra island appears with the peat land depth layer and the hotspot layer along with a description of the legend of the cluster.
4. Conclusion
The web-based clustering application has been successfully developed using the DBSCAN algorithm and the Shiny framework for hotspots data in peatland of Sumatra in 2002 and 2013. The main features of the application include clustering in which, users can obtain the results in the form of a list of a number of clusters, borders, seeds, and noises. Another feature is that users can plot spread of hotspot clusters that can be overlaid with landuse, peatland depth, or peatland types. In addition to clustering and plots, the application also displays measurement values for users to analyze and evaluate the clustering results. All features of the application have been tested and they work properly in corresponding to the test scenario.
References
1. Wahyunto, Ritung S, Subagjo H. Peta luas sebaran lahan gambut dan kandungan karbon di Pulau Sumatra 1990 – 2002. Bogor: Wetlands International – Indonesia Programme dan Wildlife Habitat Canada; 2003.
2. Adinugroho WC, Suryadiputra INN, Saharjo BH, Siboro L. Panduan pengendalian kebakaran hutan dan lahan gambut, Climate Change, Forests and Peatlands in Indonesia Project. Bogor: Wetlands International – Indonesia Programme dan Wildlife Habitat Canada; 2005. 3. Sizer N. Fires in Indonesia spike to highest levels since June 2013 haze emergency, 2014, [internet], [downloaded 2014, 9 Okt], Available at:
http://www.wri.org/blog/2014/03/fires-indonesia-spike-highest-levels-june-2013-haze-emergency
4. Sitanggang S, Baehaki DAM. “Global and collective outliers detection on hotspot data as forest fires indicator in Riau Province, Indonesia”, In Proceedings 2015 Second IEEE International Conference on Spatial Data Mining and Geographical Knowledge Services (ICSDM 2015): Fuzhou, China; 2015. P. 66-70.
5. Sitanggang S, Fuad T, Annisa. K-Means clustering visualization of Web-Based OLAP operations for hotspot data. In Proceedings International Symposium on Information Technology 2010 (ITSim 2010): Kuala Lumpur; 2010.
6. Ester M, Kriegel H, Sander J, Xu X. A density-based algorithm for discovering cluster in large spatial database with noise. In Proceeding 2nd Int Conf. on Knowledge Discovery and Data Mining, California (US): AAAI; 1996. p. 226-231.
7. Han J, Kamber M, Pei J. Data mining: concepts and techniques. 3rd ed. San Francisco (US): Morgan Kauffman; 2011.
8. Usman M, Sitanggang IS, Syaufina L. Hotspot distribution analyses based on peat characteristics using density-based spatial clustering.
Environmental Sciences 2015;24 (1):132-40. 4 Plotting clustering results
based on peat land type User press the button “Show Plot”
The map of Sumatra island appears with the peat land type layer and the hotspot layer along with a description of the legend of the cluster.
Yes
5 Displaying Within cluster
value User selects Within Cluster tab
A table that contains the values of within cluster and the total value of within cluster is displayed.
Yes
6 Displaying summary of
clustering results User selects Summary tab
The summary table is shown up which contains Eps, MinPts, the number of clusters, the number of noises, and the total value of within cluster.