Theses
8-2014
Probabilistic Modeling and Inference for Obfuscated Network
Probabilistic Modeling and Inference for Obfuscated Network
Attack Sequences
Attack Sequences
Haitao Du
Follow this and additional works at: https://scholarworks.rit.edu/theses Recommended Citation
Recommended Citation
Du, Haitao, "Probabilistic Modeling and Inference for Obfuscated Network Attack Sequences" (2014). Thesis. Rochester Institute of Technology. Accessed from
This Dissertation is brought to you for free and open access by RIT Scholar Works. It has been accepted for inclusion in Theses by an authorized administrator of RIT Scholar Works. For more information, please contact [email protected].
Obfuscated Network Attack Sequences
by
Haitao Du
A Dissertation Submitted
in
Partial Fulfillment of the
Requirements for the Degree of
Doctor of Philosophy in Computing and Information Sciences
in
GCCIS PhD Program in Computing and Information Sciences
Supervised by
Dr. Shanchieh Jay Yang
Department of GCCIS PhD Program in Computing and Information
Sciences
B. Thomas Golisano College of Computing and Information Sciences
Rochester Institute of Technology
Rochester, New York
The dissertation “Probabilistic Modeling and Inference for Obfuscated Network Attack Sequences” by Haitao Du has been examined and approved by the following Examination Committee:
Dr. Shanchieh Jay Yang Associate Professor Dissertation Advisor
Dr. Pengcheng Shi Professor
Dissertation Committee Member
Dr. Bo Yuan
Associate Professor
Dissertation Committee Member
Dr. Justin Domke Senior Researcher
Dissertation Committee Member
Dr. Michael Kuhl Professor
Dedication
Acknowledgments
I would like to thank my advisor Dr. Yang and my committee members for all the guidance, support and help through these years.
Abstract
Probabilistic Modeling and Inference for Obfuscated Network Attack
Sequences
Haitao Du
Supervising Professor: Dr. Shanchieh Jay Yang
Prevalent computing devices with networking capabilities have become critical network infrastructure for government, industry, academia and every-day life. As their value rises, the motivation driving network attacks on this infrastructure has shifted from the pursuit of notoriety to the pursuit of profit or political gains, leading to network attack on various scales. Facing diverse network attack strategies and overwhelming alters, much work has been devoted to correlate observed malicious events to pre-defined scenarios, attempting to deduce the attack plans based on expert models of how network attacks may transpire.
We started the exploration of characterizing network attacks by investigating how tem-poral and spatial features of attack sequence can be used to describe different types of attack sources in real data set. Attack sequence models were built from real data set to describe different attack strategies. Based on the probabilistic attack sequence model, at-tack predictions were made to actively predict next possible actions. Experiments through attack predictions have revealed that sophisticated attackers can employ a number of ob-fuscation techniques to confuse the alert correlation engine or classifier. Unfortunately, most exiting work treats attack obfuscations by developing ad-hoc fixes to specific obfus-cation technique. To this end, we developed an attack modeling framework that enables a
systematical analysis of obfuscations.
The proposed framework represents network attack strategies as general finite order Markov models and integrates it with different attack obfuscation models to form proba-bilistic graphical model models. A set of algorithms is developed to inference the network attack strategies given the models and the observed sequences, which are likely to be ob-fuscated. The algorithms enable an efficient analysis of the impact of different obfuscation techniques and attack strategies, by determining the expected classification accuracy of the obfuscated sequences. The algorithms are developed by integrating the recursion concept in dynamic programming and the Monte-Carlo method.
The primary contributions of this work include the development of the formal frame-work and the algorithms to evaluate the impact of attack obfuscations. Several knowledge-driven attack obfuscation models are developed and analyzed to demonstrate the impact of different types of commonly used obfuscation techniques. The framework and algorithms developed in this work can also be applied to other contexts beyond network security. Any behavior sequences that might suffer from noise and require matching to pre-defined mod-els can use this work to recover the most likely original sequence or evaluate quantitatively the expected classification accuracy one can achieve to separate the sequences.
Contents
Dedication. . . iii
Acknowledgments . . . iv
Abstract . . . v
1 Introduction. . . 1
1.1 Overwhelming, diverse and evolving network attacks . . . 1
1.2 Intrusion detection and alert correlation . . . 2
1.3 Host clustering and botnet detection . . . 5
1.4 Network attack modeling and prediction . . . 7
1.5 Network attack data set . . . 11
1.6 Overview the rest of the dissertation . . . 16
2 Network attack characterization, modeling and prediction . . . 18
2.1 Attack action sequence features . . . 18
2.2 Predict possible attack actions . . . 30
2.3 Technical gap for dealing noisy attack sequences . . . 40
3 Modeling obfuscated attack sequences . . . 42
3.1 Attack obfuscation and countermeasures . . . 42
3.1.1 Review of network attack obfuscation . . . 42
3.1.2 Current attack obfuscation countermeasures . . . 51
3.2 Probabilistic modeling on attack obfuscations . . . 51
3.2.1 Type-I model for action alteration . . . 53
3.2.2 Type-II model for action insertion and action removal . . . 57
3.3 Probabilistic inference and impact assessment for obfuscated sequences . . 61
4 Inference algorithm design . . . 66
4.1.1 Basic probabilistic inference problem . . . 67
4.1.2 Inference for different obfuscation models . . . 74
4.2 Performance evaluation for sequence classification . . . 80
4.3 Algorithm efficiency verification . . . 82
5 Network attack obfuscation simulation and results . . . 86
5.1 Simulation framework and set up . . . 86
5.1.1 Attack action space . . . 86
5.1.2 Attack models . . . 88
5.1.3 Obfuscation models . . . 89
5.1.4 Simulation overview . . . 90
5.2 Type-I model simulation and results . . . 91
5.2.1 A case study of action alteration obfuscation . . . 91
5.2.2 Action alteration impact evaluation . . . 94
5.2.3 Evaluation the impact inaccurate obfuscation model . . . 98
5.3 Type-II model simulation and results . . . 102
5.3.1 Action insertion simulation . . . 102
5.3.2 Action removal simulation . . . 105
6 Conclusion . . . 109
Bibliography . . . 111
A Snort alerts explanation . . . 119
List of Tables
1.1 An example of alert correlation scenario . . . 4
1.2 Review of alert correlation work . . . 5
1.3 Review of host clustering work . . . 7
1.4 Review of alert correlation and prediction work with data set . . . 15
1.5 Review of host clustering work with data set . . . 15
2.1 An example of attack from real-world data . . . 19
2.2 Examples of coordinated attacks with different strategies . . . 21
2.3 Packet level details for attack source 0.86.249.218 . . . 29
2.4 Per attribute prediction example by VLMM. . . 31
2.5 Fuzzy inference rules used to combine VLMM outputs . . . 33
2.6 Projection performance achieved by F-VLMM for the various datasets . . . 36
2.7 A high efficiency attack with percentile rank interval achieved by F-VLMM 38 2.8 A low efficiency attack with percentile rank interval achieved by F-VLMM 39 2.9 A stealthy attack with percentile rank interval by F-VLMM . . . 39
3.1 Hex payload and explanation for RPC Sadmind Snort rule . . . 43
3.2 An example scenario of action alteration obfuscation . . . 45
3.3 An example scenario of noise injection obfuscation . . . 46
3.4 An example scenario of self-throttling obfuscation . . . 47
3.5 An example scenario of activity splitting obfuscation . . . 48
3.6 An example scenario of action removal obfuscation . . . 49
3.7 An example of attack sequence obfuscation . . . 50
3.8 An example ofP(Yk|Xk)for HMM . . . 56
3.9 An example ofP(Yk|Xk)for proposed action alteration model . . . 56
3.10 An example of parameter set up for link removal toy example . . . 61
3.11 Notations used in algorithm design . . . 65
5.1 Attack model 1 (partial) used in simulation . . . 89
5.3 Attack model 3 (partial) used in simulation . . . 90 5.4 Attack obfuscation model (partial) used in simulation . . . 90 5.5 Network attack sequence used in the case study . . . 93
List of Figures
1.1 Attack sophistication vs. Intruder technical knowledge . . . 2
1.2 Examples of data points for host clustering . . . 6
1.3 Example of Bayesian networks for attack prediction . . . 8
1.4 An example of attack prediction using recommendation system [27] . . . . 9
1.5 Examples of suffix tree for VLMM attack prediction . . . 10
2.1 Example of spatial feature for coordinated attacks . . . 21
2.2 Example of ASG analysis . . . 23
2.3 Attack source labeling . . . 25
2.4 Degree centrality based attack sources clustering . . . 25
2.5 Spatial pattern sets probabilities . . . 27
2.6 Label sequence comparison for different attacking strategies . . . 27
2.7 Label Sequence and ASG Subgraphs for Attack Source 0.86.249.218 . . . . 30
2.8 A scatter plot ofP rojtversusP rojdof all hosts . . . 32
2.9 The fuzzy membership functions . . . 33
2.10 The I/O surface plot of the fuzzy combination system . . . 34
2.11 Network A used for attack prediction simulation . . . 35
2.12 Network B used for attack prediction simulation . . . 36
2.13 The number of targets receiving different threat scores: all targets (top) vs. only attacked targets (bottom) . . . 37
3.1 An example of RPC Sadmind Snort rule . . . 43
3.2 Network used for illustrating obfuscation techniques . . . 44
3.3 Graphical model notation for1st order model . . . 53
3.4 Graphical model notation for HMM . . . 54
3.5 An example of proposed Type-I model (second order) . . . 55
3.6 Graphical representation for action insertion . . . 58
3.7 Graphical representation for action removal . . . 59
3.8 Graphical representation of action insertion model 1 . . . 59
3.10 An example of adding dependencies and constrains on Type-II model . . . 60
3.11 An toy example of dependency link removal . . . 61
3.12 An example of attack sequence classification by comparing the likelihood . 63 3.13 Comparison of classify attack sequence with/without noise . . . 65
4.1 An example of chain structure . . . 68
4.2 An example of chain structure with constrain . . . 71
4.3 An example of8×5dynamic programming table . . . 73
4.4 An example of adding dependencies onY . . . 79
4.5 An example of adding dependencies betweenXandY . . . 79
4.6 Monte Carlo approximation accuracy . . . 83
4.7 Monte Carlo approximation time saving . . . 84
4.8 Brute force time cost for calculatingP(Y|C) . . . 85
4.9 Proposed algorithm time cost for calculatingP(Y|C) . . . 85
5.1 An example of action space (attack patterns) . . . 87
5.2 Simulation overview for attack sequence classification with obfuscations . . 91
5.3 Network used for the case study . . . 92
5.4 Likelihood comparison on obfuscated attacks . . . 94
5.5 Classification performance vs. observation length . . . 96
5.6 Classification performance vs. noise level . . . 98
5.7 Inaccurate M estimation with respect to different sequence length . . . 99
5.8 Inaccurate M estimation with respect to different noise level . . . 100
5.9 Inaccurate M estimation with respect to different noise level . . . 101
5.10 Inaccurate M estimation with respect to different noise level . . . 102
5.11 Graphical representation of action insertion case 1 . . . 103
5.12 Graphical representation of action insertion case 2 . . . 104
5.13 Simulation results for two different noise insertion (NI) models . . . 105
5.14 Graphical representation for action removal case 1 . . . 106
5.15 Graphical representation for action removal case 2 . . . 106
5.16 Simulation results for two different action removal (AR) models . . . 107
Chapter 1
Introduction
1.1
Overwhelming, diverse and evolving network attacks
Prevalent computing devices with networking capabilities have become critical network infrastructure for government, industry, academia and every-day life. As their value rises, the motivation driving network attacks on this infrastructure has shifted from the pursuit of notoriety to the pursuit of profit [1, 2] or political gains, leading to network attack on various scales.
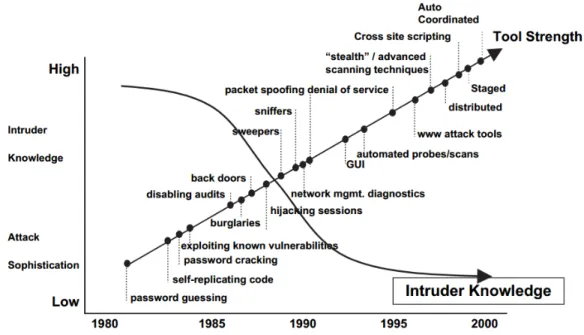
As new software vulnerabilities are discovered by few elite attackers, they are routinely bought and sold by underground organizations. Corresponding attack tools take advantage of the novel vulnerabilities and recruit new zombie (compromised) hosts for the attacker. As shown in Fig. 1.1, Fuchsberger [3] published ten years ago, gives the trends of network attack, i.e., attack sophistication will increasing over time, at the same time only limited intruder’s knowledge are needed. All of these trends are coming from the automated attack tools and compromised zombie hosts.
According to the Symantec Internet security threat report [1] [4], the largest botnet observed in 2010 had over 1 million bots under control, and underground economy adver-tisements promote 10,000 bots for $15. There are 552 million identities exposed during year 2013, which is almost five times than identities exposed during 2012. Moreover, there are more targeted attacks [4] with reasonable level of sophistication for specific sensitive data, in addition of random attacks created by virus or worms for propagation. Large-scale cyber attacks can take the traditional form of a botnet, from which a large number of hosts
Figure 1.1: Attack sophistication vs. Intruder technical knowledge
perform similar actions, e.g., Distributed Denial-of-Service (DDoS) or distributed stealthy scans [2]; they can also consist of a set of colluding sources dividing up tasks, interleav-ing actions over time and dispersinterleav-ing over the IP and port spaces to conceal their overall strategy.
1.2
Intrusion detection and alert correlation
Network attacks can be captured and observed by Intrusion Detection System (IDS) alerts. The essential goal of a IDS is to differentiate malicious activities from the normal ones and report suspicious actions to network analyst. For more than two decades, significant effort has been put into advancing intrusion detection via anomaly-based and signature-based systems [3]. Anomaly-signature-based detection techniques model the users or systemsnormal behavior, and report outliers as potential malicious activities. On the other hand, signature-based detection systems usually maintain a database of malicious behavior signatures and use pattern matching techniques to detect malicious actions. Anomaly-based detection systems can be very effective to deal with novel attacks, but suffer from overwhelming false
positives. Signatures-based system can have more accurate detection but can be ineffective on novel attacks. Details of intrusion detection techniques can be found in several survey papers,e.g., [5, 3, 6, 7].
Intrusion detection is challenging because of the variety of normal behaviors, fast changing cyber environment (network services and configuration) as well as new vulnera-bilities and attacks. While intrusion detection techniques continues to evolve and improve, the overwhelming and heterogeneous IDS alerts has made the analysis difficult and unable to provide an effective situation assessment. As a result, alert correlation has become a popular topic in the past decade [8, 9]. Ideally, the goal of alert correlation is to determine collections of IDS alerts, where each collection corresponds to a high-level description of the attack.
The tasks of alert correlation can be categorized into Normalization (Norm.), Aggrega-tion (Agg.), CorrelaAggrega-tion (Corr.) and Strategy Analysis (SA) [9]. The normalizaAggrega-tion orga-nizes the format of alerts from heterogeneous IDS sensors. Aggregation combines alerts that share the same root causes, e.g., originated from same source IP or attack the same target. In the correlation step, aggregated alerts are mapped into an attack scenario tem-plate. Further, the causal relationship,i.e., pre-condition and post-condition, can be used in strategy analysis to infer attack intention and strategies.
The details of alert correlation and a performance evaluation1 can be found in [9, 10]. Table 1.1 uses an example to illustrate an ordered sequence of seven alerts for alert corre-lation. The example is extracted from [11] which provides a comprehensive framework for alert correlation.
The monitored network has four heterogeneous IDS sensors,i.e., network based IDS 1 and 2, (N1,N2), host based and application based IDS (H, A). The attacker (31.3.3.7) first launches a port scan against 10.0.0.1 and discovers the vulnerability of Apache server. After
1Performance evaluation is very challenging for alert correlation. To best of our knowledge, Haines’s work
[10] is the only one systematically evaluates and compares the performance for different alert correlation system. In the end of Chapter 2, we will discuss the technical gap of performance evaluation for existing attack analysis systems.
Table 1.1: An example of alert correlation scenario
Alert ID Description Sensor Start/End Time Source Target
1 IIS Exploit N1 12.0/12.0 80.0.0.1 10.0.0.1, port: 80 2 Scanning N2 10.1/14.8 31.3.3.7 10.0.0.1 3 Port Scan N1 10.0/15.0 31.3.3.7 10.0.0.1 4 Apache Exploit N1 22.0/22.0 31.3.3.7 10.0.0.1, port: 80 5 Bad Request A 22.0/22.1 localhost, Apache 6 Local Exploit H 24.6/24.6 linuxconf 7 Local Exploit H 24.7/24.7 linuxconf
scanning, the attacker performs a successful Apache buffer overflow exploit on the target and obtains user privilege on the server. Finally, the attacker launches privilege escalation by using a local exploit linuxconf. In addition, there is one noisy alert triggered by a worm that probes the same target while the attack is in progress. The ideal output of alert correlation would successfully group Alerts #2 and #3 as malicious scanning, Alerts #4 and #5 as vulnerability attempts, Alerts #6 and #7 as privilege escalation, and the noisy Alert #1 will be marked as irrelevant. After the aggregation of alerts, the scanning, vulnerability attempts and privilege escalation should be correlated and reported to security analysts. This example shows that once correlated, an analyst can be more effective to process the high-level attack descriptions instead of individual alerts.
The methodologies widely used in correlation engines include similarity-based cluster-ing and causal relationship based (pre/post condition) reasoncluster-ing [9]. The attack scenario templates can be pre-defined or automatically learned from data. Uncertainties usually are captured with Bayesian networks, which will be reviewed in Section 1.4. Table 1.2 is a summary of representative alert correlation approaches.
Alert correlation synthesizes the raw IDS alerts into attack scenarios and provides better situation awareness to security analysts. However, as discussed earlier, the ever-changing environment, e.g., software patches, new IDSs, customized alerts, and new exploits, make alert correlation challenging. In addition, the attack-scenario (pre/post-condition) based
Table 1.2: Review of alert correlation work
Ref. Framework Methodology
[12] Agg. Similarity-based clustering [13] Corr., SA Pre/post condition based correlation [14] Norm., Agg., Corr. Exam source-target relationship [15] Agg., Corr. Pre/post condition based correlation
[16] Corr. Similarity based, Pre/post condition based correlation [17] Agg., Corr. Bayesian networks based inference
[18] Corr. Bayesian networks, Pre/post condition based correlation [19] Corr. Bayesian networks based inference
[20] Agg., Corr. Similarity-based clustering
[11] Agg., Corr. Complete system, attack scenario based correlation [21] Corr. Data mining for frequent structured patterns
approaches are accurate but will not scale for a large number of diverse and unknown attacks, similar to the limitation of signature-based intrusion detection.
1.3
Host clustering and botnet detection
Going beyond focusing on examining the detailed attack action level and alert correlation, in a large scale, host clustering work allows us to group a large number of (normal or ma-licious) hosts that share similar behavior into clusters. Host clustering and botnet detection are other useful tools for network analyst to understand large scale attacks.
The input for host clustering usually is passive Internet backbone traffic [22, 23, 24, 25] or malicious traffic [26, 27] and the outputs are host clusters with behavior pattern descrip-tions, which could be useful for anomaly detection and attack profiling. Some malicious activities, such as worms, scanning and DDoS attacks, can be detected behavior by host clustering work [24, 25]. An example of host clustering for botnet detection can be found in [25]. Scan activity, spam activity, binary downloading and exploit activity are classical activities that botnet hosts would behave. By looking at the host clusters that exhibit these different activities, one can infer the structure of botnet zombie hosts.
The key differences between various types of host clustering work can be understood as selecting differentfeaturesto form a multi-dimensional data point andobjective function
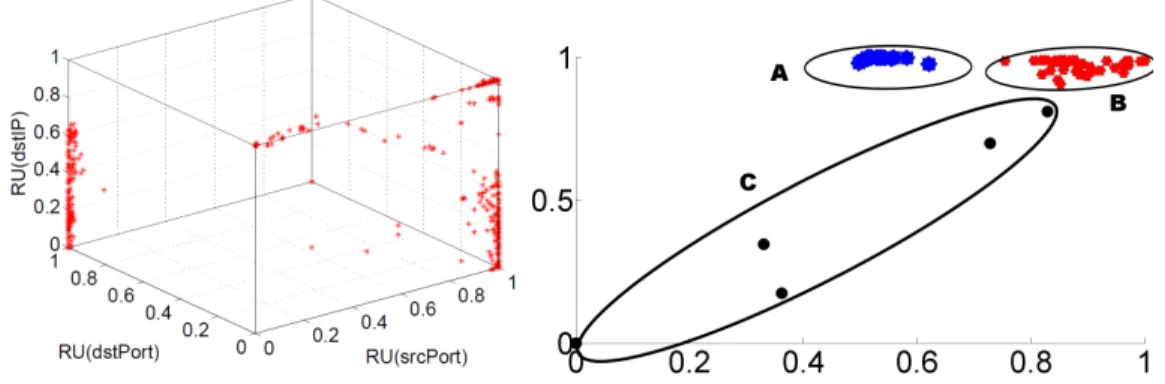
for clustering them. The data pointxrepresents an attacking host that contains several fea-tures on security context. Among all the basic attributes in the communications, the widely used features are statistics from flow information (source IP, destination IP) and protocol information (TCP/IP protocol, source port, definition port). Figure 1.2 is an example of data points from host clustering work [23] and [28]. For the left subfigure, every point in the figure represents one attacking host. Three features, Relative Uncertainty (RU) on source port, destination port, and destination IP are taken into account to characterize an attacker’s behavior. For the right subfigure, every data points represents a set of attacking sources sharing the same spatial attributes,e.g., number of targets,etc... The data points in Fig. 1.2 exhibit cluster patterns,. After selecting the features, the next step is clustering the data points, which optimizes on specific objective function. Different objective functions group data points based on different principles. Some of them minimize the distance be-tween data points and cluster center (e.g., K-means clustering) and some utilizing the graph cut notion (e.g., spectral clustering) to separate points are distinct from each other. Table 1.3 is a summary review of host clustering work.
Figure 1.2: Examples of data points for host clustering
Host clustering analyzes a large number of attacking sources by grouping similar attack sources and extracting patterns of clusters. It may be ineffective to discover sophisticated
Table 1.3: Review of host clustering work
Ref. Features Methodology
[25] Flows and packets statistics X-means clustering [22] Flows and protocol statistics Hierarchical clustering [23] Relative uncertainty on flows Customized algorithm [24] Relative uncertainty on flows Spectral clustering [26] Statistics on flows Hierarchical clustering [27] Statistics on flows Customized algorithm
attacks, which take slow actions and utilize multiple attack sources. Nevertheless, the fea-tures and the clustering analysis methodology can be very helpful for treating overwhelm-ing numbers of alerts. Further, the overwhelmoverwhelm-ing attackoverwhelm-ing data with various types of fea-tures has led to challenges to extract, comprehend and predict the diverse attack strategies and goals within the mixture of various attack strategies.
1.4
Network attack modeling and prediction
Network attack modeling is a widely used term, in early stage, most models are descriptive and deterministic model. In late 1990’s, Cohen et al.[29] provided one of the pioneering network attack modeling frameworks. They used cause-and-effect models to deduce 37 threat profiles (behaviors), 94 attacks (physical and cyber), and 140 defense mechanisms, and reported a set of simulation results [30]. Their work, along with several others [31, 5, 32] in late 1990’s and early 2000’s, have provided a comprehensive understanding of the different cyber attack types and their effect to networked systems.
Computational and probabilistic modeling is another important branch of attack mod-eling. Bayesian networks are widely used to model uncertainty in the security context because the conditional dependency fits perfectly with pre/post-condition and attack sce-narios. Several works [19, 33, 34] utilize Bayesian networks for predicting high-level goal of an attack. The use of Bayesian networks to model high level attack plans requires a
mapping between specific alerts to attack categories, but it allows probability inference and helps reduce from all possible future attack actions to a differentiable list of likely future attacks. Figure 1.3 gives an example of Bayesian networks modeling applied to the security context.
Consider a simplified attack scenario with four random variables representing the stages of an attack. LetBdenote “install Backdoor on the system”,Cas “Compromise application account and password”,M as “Monitor confidential transactions”, andSdenote “Success-fully obtain the confidential data”. The conditional dependencies of the random variables can be described in Fig. 1.3. It indicates that the success ofC(compromise application ac-count and password) andM (monitor confidential transactions) are independent given their parentB(install back door on system). Meanwhile,S(Successfully obtain the confidential data) depends onC andM.
B
C
M
S
Figure 1.3: Example of Bayesian networks for attack prediction
In addition to the structure of the model, the parameters, i.e., the conditional proba-bilities, of the model could potentially be derived from security knowledge. In particular, a complete model will specify P(B), P(C|B), P(M|B)andP(S|C, M). Therefore, ac-cording to the conditional dependencies, the joint distribution P(B, C, M, S) can be de-composed into P(B)P(C|B)P(M|B)P(S|C, M). With simplified joint probability, one can perform any inference on interested events.
There are many challenges when using Bayesian networks for cyber attack modeling and prediction. The key problem for Bayesian networks is the assumption of the model. Unlike other fields, the model structure and parameters have very high uncertainty for multistage cyber attacks. Furthermore, training using up-to-date multistage data is almost
impossible, as little ground truth exists for the stages a cyber attack goes through. Manually specifying both the structure and the parameters may be error-prone for a large network.
Because of its limitations on scalability and the requirement of domain knowledge, Bayesian networks are typically used to predict the high-level goal of an attack, for exam-ple, whether the attacker will compromise an application account and password. On the other hand, sequence modeling, e.g., [27, 35], has been utilized to predict more detailed attack actions,e.g., the next attack target or service.
Generally speaking, sequence modeling techniques learn attack patterns from observed attack sequences and predict the future actions of a given sequence based on the aggregate likelihood of similar attack patterns. Soldoet al.[27] developed a cyber attack prediction system by drawing an analogy from the context of recommendation systems [36], which has been used to recommend movies based on similar users’ preferences. Figure 1.4 shows an example of this analogy between recommendation systems and cyber attack prediction, reproduced from Soldoet al.[27]. Figure 1.4(a) is the matrix denoting a user’s preference in a recommendation system. Elementai,jrepresents whether the itemiis borrowed by user
j. Figure 1.4(b) presents a similar idea in the context of cyber attacks. Similar preference on the choice of targets from similarly behaving attacks are used to ‘recommend/predict’ the targets of a given attack.
(a) Recommendation system (b) Network attacks
Figure 1.4: An example of attack prediction using recommendation system [27]
A more explicit approach to extract the sequential dependencies between attack action attributes within each attack sequence is to use a Variable Length Markov Model (VLMM
[35]). Consider an ongoing attack withNobserved actions{X1, X2,· · ·, XN}. A model of
orderLassumes the current observed event is conditional depend on previousLevents. The probabilities are obtained from sample counts in historical and ongoing attack sequences. A sequence of lengthNwill contribute to the building ofLthorder models for1≤L≤N.
More specifically, a sequence of lengthN will provide one sample to thenthorder model, two samples to the (N −1)thorder model, ... , and N samples to the 1st order model2.
For implementation, a suffix tree can be used to record the samples and to store models of different orders, which allows making predictions based on observed context in O(N)
time given a sequence of length N. Figure 1.5 shows the suffix tree corresponding to a single sequence of ‘A, B, A, B, B’, where the edge weights indicate the number of times the corresponding transition has occurred.
Figure 1.5: Examples of suffix tree for VLMM attack prediction
In reality, the suffix tree will be built with many attack sequences and continuously up-dated with incoming alerts. The overall suffix tree represents the various possible Markov relationships of different orders. For a given ongoing sequence with length N, the foroth
order model Po(XK), ∀ −1 ≤ o ≤ N can be found from the suffix tree inO(N2)time,
which may be further simplified. The probability of next event in the sequence Po(XN+1)
can then be blended to make the prediction for next event as
2From the perspective of Bias-Variance trade-off [37], we may not need to learn a very higher order
model, because there is no sufficient data to train such order, and will lead to a very high variance. The weight assignment for different order’s model takes this factor into account, and generally the higher order model will have a very small weights.
P(XK+1) =
K
X
o=−1
wo·P(XK+1|XK−o+1,· · · , XK)
wherewo is the weight associated with theothorder model, andPKo=−1wo = 1. Note that
finite sequences should be penalized by their rarity and rewarded by their specificity. The weights are designed to be adaptive to take into account the Bias-Variance trade-off [37]. Examples of the weight functions can be found in [38]. Fava [35] shows that there is no significant performance difference when using different weight functions, as long as the the weights satisfy the properties described above. Notice that the summation starts at−1. The minus-one order model assigns all characters a probability of1/|Ω|to prevent thezero frequency problem [38]. The zero order model assumes all observations are independent and holds the frequency count of all X ∈ Ω. For the given example in Fig. 1.5, after observing ‘A, B, A, B, B’, we predict next event by considering the minus-one order model (P0(A) =P0(B) = 0.5), zero order model (P1(A) = 0.4,P1(B) = 0.6), first order model
(P2(A|A) = 0,P2(B|A) = 0.5,P2(B|B) = 0.25,P2(B|B) = 0.25), all the way to the fifth
order model. The predictions in different models will be blended using different weights. The VLMM model allows us to discover patterns within attack sequences without ex-plicitly defining attack plans [35]. In fact, an ongoing attack sequence can match patterns from numerous different types of preceding attack sequences. A VLMM combines the probabilities associated with all matched patterns and produce a better guess.
1.5
Network attack data set
The lack of representative data set with comprehensive ground truth label always be the fundamental challenge for network security research, from intrusion detection, alert corre-lation to attack prediction. In this section, we will review widely used data set in aforemen-tioned related work. Such review allows us to have better understanding of related work’s objective and limitations.
typical enterprise networks, the collection of IDS alerts and host logs would not be useful for security research, because the data contains no label to the intrusion stage or specific attacking behavior. There are also many privacy concerns to release the such data for research purposes. Therefore, some milestone data set generated by government or research institute, such as MIT Lincoln lab (DARPA data set [39] [40] [10]) and DEFCON data set [41], are widely used across most security research.
In 1998 and 1999, DARPA intrusion detection evaluation group of MIT Lincoln Lab-oratory collected and distributed two data set, DARPA 1998 and DARPA 1999, for IDS evaluation purpose, i.e., the goal is investigating the performance of IDS detection en-gine on reporting malicious activities. The data set was collected over several weeks in a controlled environment to simulate an enterprise network. Various types of attack tools, includingprobes,remote to local attacks,user to root attacksandDoS attacksare utilized to conduct attacks (some of the attacks would not be valid today because the vulnerability does not exist anymore, such as Ping of Death vulnerability). Finally, the data sets are divided into training data set and testing data set and labeled with ground truth intrusion activities.
In 2000, DARPA released two data sets with more sophisticated, multi-stage attack scenarios. The attack goal is to install components and conduct DDoS attack in the target network. The whole process has five attack phases, over the course of which the attacker probes the network, breaks in to a host by exploiting the vulnerabilities, installs Trojan DDoS software and eventually launches a DDoS attack from compromised hosts [42]. The data sets also contains detailed labels for intrusion activities over the phases. Un-like DARPA1998 and DARPA1999 data set, whose purpose is validating the IDS detection engine, DARPA 2000 data set contains multistage attack and is widely used to validate the alert correlation research. In 2003, DARPA Cyber Panel Program released Grand Chal-lenge Problem (GCP) for alert correlation evaluation[10]. Dataset is generated by an attack simulator, which simulates two innovative worm attack scenarios in an enterprise network. Data set includes multiple heterogeneous IDS alerts, and firewall logs generated by attacks
as well as many background alerts that make alert correlation and attack strategy detec-tion more challenging. GCP data set is one important benchmark data to evaluate alert correlation system performance and the results are published in [10].
In addition to the DARPA data set, hacking competitions provide another useful re-sources of understand network attacks. DEFCON is the world’s largest annual computer hacker conference, and it organizes Capture the Flag (CTF) hacking competition every year. During the competition, hackers are organized as teams, and vulnerable virtual ma-chine images are provided to each team. The goals are protecting its own system and attack other teams. DEFCON CTF 8 and CTF 9 data set (collected in 2000 and 2001) are also used for intrusion detection and alert correlation research. University of California, Santa Barbara and United States Military Academy West Point also organize International catch the flag (iCTF) [43] and cyber defense exercise [44] hacking competitions and release the traffic capture, IDS alerts and host logs to public.
Comparing to the benchmark data set created by DARPA, there are limited work using the hacking competition data. Cipriano et al. [45] developed a production system called Nexat. The approach groups intrusion alerts into attack sessions based purely on the source and destination IP addresses recorded in the alerts. Then, statistics are recorded to deter-mine which types of attack actions are more likely to be in the same session. Prediction of future attack actions are, thus, chosen based on the overall statistics given recently captured alerts. Nexat was evaluated using the iCTF competition dataset and has show reasonably good prediction performance. However, it is unclear whether the simplistic definition of the attack session and the statistics can be generalized and applicable for large-scale networks with diverse attack goals.
On the other hand, in a larger scale it is possible to capture Internet attacks by passive data collection. Passive attack data can be originated from worm propagation probing, DDos and distributed stealthy scans. Such data sets that are widely used for host clustering, includes CAIDA data set [46], Dshield data set [47], and other Honeypot data set. The Cooperative Association for Internet Data Analysis (CADIA) is an organization based at
the University of California’s San Diego supercomputer center. It collects several different types of data at geographically and topologically diverse locations, and makes the data available to the research community [46]. Similarly, DShield Internet Storm Center is an organization that collects data for different contributes for discovering trends in activity, confirming widespread attacks, or assisting in preparing better firewall rules [47].
As discussed earlier, Soldoet al.[27] adopted recommendation systems to predict vic-tim networks based on similarly behaving malicious source IP. While theoretical sound and performing well against the DShield dataset, the recommendation system approach does not provide insights on how the attack actions happen sequentially or causally. Note that DSheild data reports attack incidents on the Internet for blacklisting purposes, but does not really contain sophisticated multistage attack strategies. It serves for a different purpose of predicting victim networks from blacklisted source IP, but not predicting next attack ac-tions among ongoing attacks in enterprise networks. Chenget al.[48] developed a system that measures similarity between attack progressions and project into future actions based on most similar portions of the progressions seen in other attack sequences. The approach is based upon the solution for the classical Longest Common Subsequence problem, and a key novelty lies in the definition of the attack progression as a time-series of 3-digit num-bers: the first digit indicates the zone distance between the source and destination IP, the second digit stands for the network protocol used, and the third digit reflects the distance between port clusters. From there, an attack sequence becomes a trajectory moving in this 3-digit space. While the idea is interesting and unique, the authors evaluated their system against the DARPA dataset, which is limited in terms of attack sophistication as discussed before.
Tables 1.4 and 1.5 summarize the aforementioned alert correlation and host clustering works with data sets.
After reviewing the data sets that widely used in intrusion detection, alert correlation, host clustering and attack prediction, we want to argue that, to the best of our knowledge,
Table 1.4: Review of alert correlation and prediction work with data set
Ref. Framework Datasets
[12] Agg. Private datasets [49] Corr., SA Private datasets [14] Norm., Agg., Corr. Private datasets [15] Agg., Corr. DARPA 2000, DEFCON 8
[50] Corr. DARPA 2000
[17] Agg., Corr. DARPA 1999 [18] Corr. DEFCON 9, DARPA GCP
[19] Corr. DARPA GCP
[20] Agg., Corr. Private datasets
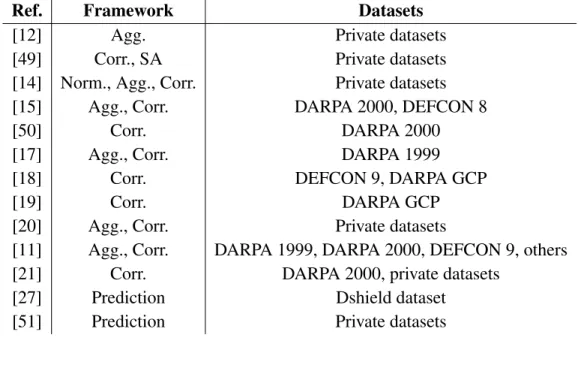
[11] Agg., Corr. DARPA 1999, DARPA 2000, DEFCON 9, others [21] Corr. DARPA 2000, private datasets
[27] Prediction Dshield dataset [51] Prediction Private datasets
Table 1.5: Review of host clustering work with data set Ref. Features Algorithm Datasets
[25] Flows and packets statistics X-means clustering Campus network traffic [22] Flows and protocol statistics Hierarchical clustering CAIDA CoralReef traffic [52] Relative uncertainty on flows Customized algorithm Internet backbone traffic [24] Relative uncertainty on flows Spectral clustering CAIDA Internet traffic [26] Statistics on flows Hierarchical clustering CAIDA Network Telescope [27] Statistics on flows Customized algorithm DShield dataset
there is no work that comprehensively evaluate the performance for different alert analy-sis system and take possible attack obfuscations into consideration. One of the reason is because that the widely used data sets contain no ground truth on attack obfuscations.
For the works based on DARPA 1998, and 1999 data set, they are dealing with the attacks without multiple steps and stepping stone hosts and there is no obfuscated attacks. This is because the major goal of creating these two data sets is evaluating the performance of IDS. For the works based on DARPA 2000 and GCP data set, most work are correlating
the observable into complicated attack scenarios and eliminating unrelated alerts. The variety and number of attacks in DARPA 2000 and GCP data set are also limited (one attack with five phases and two worm attacks respectively). For the works based on DEFCON data set, few attack obfuscation exists because the goal of hacking competition is capture the flag instead of to be stealthy. On the other hand, most passive and honeypot data sets, such as CAIDA data set and DShield data set are collections of malicious probings and sophisticated attack with stealthy and decoy actions may not exist.
1.6
Overview the rest of the dissertation
Combating against large-scale, sophisticated attacks requires advances on various fronts, including intrusion detection, alert correlation, host clustering, attack modeling and predic-tion. Advances in intrusion detection [53, 3], though not perfect, have provided significant observables or alerts that contain attributes of individual malicious actions. Alert corre-lation, e.g., [20, 54, 14, 13, 55, 11, 16, 56, 57], processes and groups the observed alerts based on their similarity or a pre-defined attack scenarios. Attack characterization and prediction, e.g., [19, 58, 56, 59, 35, 51, 60], aims to analyze the temporal or sequential characteristics of alert sequences of individual attack sources, so as to predict behaviors of future actions. Host clustering,e.g., [22, 23, 25, 27, 24], explores thespatialcharacteristics as well as packet and flow level anomalies among Internet hosts, to group them into clusters of normal, infected or botnet hosts.
While the computational techniques used to analyze network attacks are advancing, the attack tools, hacker skills and the attack strategies are also becoming more sophisticated. This calls for new techniques to characterize attacks and their strategies when the critical observables are embedded in the large volume and diverse malicious activities. In addition, dealing with the attack obfuscations, e.g., IDS evasion, stealthy and decoy attack, will be another challenge for network analysis. This chapter reviews and summarizes related work shows that there is no work to address the attack obfuscations explicitly, to the best of our knowledge.
Chapter 2 will expand the discussion on attack characterization and modeling and dis-cuss our works that investigate how temporal and spatial analyses can be used to discover attack sources that play different roles in a network attack and to discover different attack strategies. We will show for different algorithms understand and projecting next possible actions is a daunting challenge, especially with noisy observations. Chapter 2 will end by discussing the technical gap for dealing with noisy attack sequences, which gives us the motivation of probabilistic modeling and inference for obfuscated network attack se-quences.
Chapter 3 analyzes existing attack obfuscation techniques and derive attack obfuscation models from the security domain knowledge. Eventually propose a framework of modeling attack obfuscation explicitly to understand and quantitatively access the impact of obfus-cation on current framework attack modeling, alert correlation and attack prediction.
To take advantage of the proposed framework, efficient algorithms are necessary to preform probabilistic inference for given attack and obfuscation model. Chapter 4 derives theorems and the algorithms to perform exact inference on proposed probabilistic model. Given the inference algorithm, the problem of impact assessment for obfuscated sequences is discussed and solved by Monte-Carlo approximation with desired accuracy.
Chapter 5 gives the simulation and results for different attack scenarios based on pro-posed framework. And we will demonstrate how such knowledge can be used for security analysis. Finally Chapter 6 concludes the dissertation. The detailed IDS alerts explanation, theorem proofs are given in appendix.
Chapter 2
Network attack characterization,
mod-eling and prediction
This chapter discusses our work on attack characterization modeling and prediction and gives the motivation of the framework proposed in Chapter 3. We begin by assessing the real attack data from hacking competition [61] and network telescope data produced by UCSD [62]. Several useful features are proposed to describe different types of attacks, and used to cluster the attack hosts into different groups [26] [28]. The idea is treating hosts as instances and attacking relationship as social connections. Taking advantage of social network analysis, e.g., centrality, community structure, influence concept, possible coordinated attacks can be discovered [28]. In addition, this chapter discusses the novel attack action transition feature [63] and spatial feature [64] to discover non-trivial attack sources which are difficult for classical packet analysis to reveal. Finally, an attack predic-tion model is presented [51] to show the challenge of dealing with noisy attack sequences on simulated data set, which will lead to the discussion of attack obfuscation in Chapter 3.
2.1
Attack action sequence features
The mixture of organized cyber crimes, random attacks and computer virus against enter-prise and government networks has led to overwhelming data to be analyzed. In this sec-tion, we start our investigation from a more controlled environment, International Capture the Flag (ICTF) hacking competition [43, 61], where participants are divided into teams
to accomplish specific attack task. This enables us to investigate how coordinated, sophis-ticated attacks work, which take advantage of multiple host level attack sources and are conducted by an attacker or a group of attackers1.
Table 2.1 gives an example coordinated attack by listing a sequence of Snort [53] IDS alerts from real-world data. Basic alert attributes are listed, which include time, source IP, target IP and attack signature. The attack signature is the Snort description of alert which can be looked up in an IDS database to get more information about the attack action.
Table 2.1: An example of attack from real-world data
No. Time Src. IP Dest. IP Snort alert description
1 11:02:07 10.13.148.213 10.14.0.100 (portscan) TCP Portscan 2 12:52:02 10.13.148.223 10.14.0.1 ICMP PING NMAP 3 12:52:02 10.13.148.223 10.14.0.2 ICMP PING NMAP 4 12:52:02 10.13.148.223 10.14.0.3 ICMP PING NMAP 5 12:52:02 10.13.148.223 10.14.0.4 ICMP PING NMAP 6 12:52:02 10.13.148.223 10.14.0.5 ICMP PING NMAP 7 12:52:02 10.13.148.223 10.14.0.6 ICMP PING NMAP 8 12:52:02 10.13.148.223 10.14.0.7 ICMP PING NMAP 9 12:52:02 10.13.148.223 10.14.0.8 ICMP PING NMAP 10 12:52:02 10.13.148.223 10.14.0.9 ICMP PING NMAP 11 12:52:02 10.13.148.223 10.14.0.10 ICMP PING NMAP 12 14:36:15 10.13.148.217 10.14.1.9 (portscan) TCP Portscan 13 14:51:26 10.13.148.210 10.14.1.17 WEB-MISC cat%20 access 14 15:02:30 10.13.148.210 10.14.1.17 WEB-MISC cat%20 access
15 16:15:37 10.13.148.150 10.14.1.17 WEB-MISC http directory traversal 16 16:25:35 10.13.148.50 10.14.1.17 WEB-MISC /etc/passwd
17 17:00:22 10.13.148.150 10.14.1.17 WEB-MISC http directory traversal 18 17:11:03 10.13.148.150 10.14.1.17 WEB-MISC http directory traversal
There is a coordination among attack sources described in Table 2.1. According to the alert description, Alerts #1–12 are reconnaissance actions, and Alerts #13–18 are web
1In general, it is hard to infer about the attacker(s), because the basic unit of most observable is at host
server vulnerability attempt actions. Although these two steps are closely related,i.e., vul-nerability attempts depend on reconnaissance, but they originated from different sources. Attack source 10.13.148.218 is utilized for probing across the target space within the sub-net 10.14.0.x. After the reconnaissance, 10.13.148.210 and 10.13.148.150 are utilized to try different vulnerabilities on web services2.
In fact, this is a simple example where the source IP subnet can be indicative of co-ordinated behavior. This property occurs because the example is extracted from hacking competition and participating teams are assigned specific range of source IPs. In the real world where IP spoofing and zombie machines are common, inferring coordinated attack sources by source IP alone will not be practical.
The use of multiple attack sources, possibly spoofed, make detection of coordinated attack team more difficult. Table 2.2 includes a sequence of alert data from the ICTF hacking competition [43]. Alerts triggered by two teams,ENOFLAG (EF) andChocolate Makers(CM), are listed in the table. Both teams utilize multiple attacking sources to work together for achieving a certain goal. Basic alert attributes are listed, and the last column shows the team assignment for each attack source.
The two teams shown in Table 2.2 have different strategies,i.e., the attacks performed by two teams are different in both spatial and temporal domains. For the reconnaissance stage, team EF is morecentralized. EF mainly uses three hosts for comprehensive recon-naissance. On the other hand, team CM is more distributed. Eleven sources are used for probing the whole target space. If we use vertices to represent hosts and edges represent attacks, the graphical representations 3 are very different for two teams, as shown in Fig.
2.1.
In the temporal domain, the sequences of attack sources by the two teams are also different from each other. Team EF’s members perform TCP port sweep and port scan
2Note that, there are missing steps between Alert #12 and Alert #13. Vulnerability attempts are conducted
against 10.14.1.17, but no alerts indicates the target has been probed and discovered. This is because Snort alert is one type of observed evidence, and it may not be comprehensive since current IDS does not perform perfect detection.
Table 2.2: Examples of coordinated attacks with different strategies
Src. IP Dest. IP Snort alert description Team
10.13.1.86 10.100.113.48 (portscan) TCP Filtered Portsweep EF 10.13.1.86 10.120.113.42 (portscan) TCP Filtered Portsweep EF 10.13.1.86 10.199.113.36 (portscan) TCP Filtered Portsweep EF 10.13.1.32 10.100.113.24 (portscan) TCP Filtered Portsweep EF 10.13.1.32 10.100.113.9 (portscan) TCP Filtered Portscan EF 10.13.1.32 10.100.113.3 (portscan) TCP Filtered Portscan EF 10.13.1.32 10.100.113.8 (portscan) TCP Filtered Portscan EF 10.13.1.32 10.100.113.7 (portscan) TCP Filtered Portscan EF 10.33.1.13 10.100.133.1 ICMP PING NMAP CM 10.33.1.12 10.100.133.2 ICMP PING NMAP CM 10.33.1.16 10.100.133.3 ICMP PING NMAP CM 10.33.1.16 10.100.133.4 ICMP PING NMAP CM 10.33.1.17 10.100.133.5 ICMP PING NMAP CM 10.33.1.12 10.100.133.6 ICMP PING NMAP CM 10.33.1.20 10.100.133.7 ICMP PING NMAP CM 10.33.1.16 10.100.133.8 ICMP PING NMAP CM
(a) Spatial relationships of attacks by EF (b) Spatial relationships of attacks by CM
Figure 2.1: Example of spatial feature for coordinated attacks
against the target space. For team CM, six attack sources collaboratively use NMAP to probe the target space. Therefore, for all alerts listed in the table, building the action sequence for each attack source will lead to following results: team EF will have two
sequences with length 4 and 6 respectively. Team CM will have ten sequences, which with only one action.
Classical works may not be effective for treating coordinated attacks because the ac-tions are originated from different attack sources. For alert correlation, with missing ob-servables, it is very challenging to perform correlation by examining the pre-condition and post-condition. For example, consider the attack conducted by team CM given in Table 2.2, coordinated reconnaissance, the pre/post-condition and attack scenario based approach will fail to group the coordinating attackers. For attack characterization and prediction, Bayesian networks and sequence modeling may be also inefficient in the presence of miss-ing actions, because coordinated attacks will break the dependence structure of the model (for both Bayesian networks and Markov model). Host clustering may work for same cases where attack sources behave similarly, such as botnet DDoS attack, but may not work for the general case of coordinated attack.
Classical works may not be effective on coordinated attacks because they mostly focus on examining individual attack source’s actions, which will only givelocal informationand ignores the global informationon the whole network. On the other hand, classical works suggest Markov models and graph-based analysis can greatly benefit the analysis for large-scale attacks. Using spatial features can provide additional insights about the relationship of the attack sources and the use of sequence modeling can help for characterize the attack behavior.
To analyze the spatial feature, an Attack Social Graph (ASG) can be defined as follows to represent attacks in a given network [26] as follows:
An Attack Social Graph ASGT(V, E) is a directed graph representing the malicious
traffic within a time interval[0, T], where a vertexv ∈V is a host, and an edgee(u,v) ∈E
exists if attacks are observed from utov. Edge direction is from the attacking host to its target.
on other real-world data, which can provide us important insights on understanding coor-dinated attacks. For example, consider two ASG subgraphs shown in Fig. 2.2 which are extracted from CAIDA Network Telescope data [62, 65]. In Fig. 2.2(a) and 2.2(b), the attack sources circled with the dotted line act similarly to attack one and only one target. This is unlikely to happen by chance due to the large target space. On the other hand, the two attack sources circled with the solid line in Fig. 2.2 are suspicious. They attack severalheavily attacked targetsand are the common denominator among the all attacking sources. One possible interpretation of such a situation is that this is a coordinated attack. The sources in dotted circles are zombie machines controlled by the two sources in the solid circles4.
Figure 2.2: Example of ASG analysis
Based on the intuition given in Fig. 2.2, two approaches can be applied to analyze ASG. The first approach is to calculate certain graph properties, such as centrality distribution [66]. The second approach is to define the labels that have specific meanings, and analyze attack sources with label sequences. For the spatial labeling approach,Attack Conspirator,
Heavily Attacked Target (HAT)can be defined as follows: Let Tu
.
= {v | e(u,v) ∈ E, v ∈ Vt} be the targets attacked by u ∈ Vs, the attack
conspirators ofu∈Vs, denoted asCu, is a set of vertices:Cu
.
={v |Tu∩Tv 6=∅, v ∈Vs},
4In the real-world data set, there is no ground truth suggesting how attack sources are coordinated. We
col-lect evidence to support our assumption. In this two example, inter-arrival time and geographical information are consistent with the assumption of leader and zombie hosts.
whereVtandVsrepresent the set of targets and attacking sources respectively.
A heavily attacked target is a vertexv ∈Vt, s.t.din(v)≥H, whereHis a pre-selected
threshold.
Using these definitions, each source can be characterized by its spatial pattern. In par-ticular, we can label the attack sources according to their behavior, and examine their roles in coordinated attack. There are many disjoint subgraphs in each ASG, the first level of la-beling is to differentiate the sources based on the type of subgraph they reside: one-to-one,
one-to-many,many-to-oneandmany-to-manyrelationships. The first three ASG subgraph types are relatively easy to analyze in the security context. One-to-onerelationships could indicate the sensor was triggered by chance5 or focused attack on specific target.
One-to-manyrelationships represent service scanning on a set of targets.Many-to-onerelationships represent DDoS or coordinated attacks. In the case ofmany-to-manysubgraphs, additional factors are needed to differentiate the attack sources. Specifically, we use the HAT to differ-entiate whether a source is part of a potentially coordinated attack,i.e., unlikely to happen by chance. The attack sources that do not have any HAT are further differentiated depend-ing on whether they have any Heavily Attackdepend-ing Conspirator (HAC). The idea here is to examine whether the source, which can be attacking because of mis-configuration or it has a specific target, has a conspirator that is part of a potentially coordinated attack. Note that, the sources that have at least one HAT must have HACs. We further differentiate sources with only one HAT or multiple targets. Figure 2.3 summarizes our labeling approach.
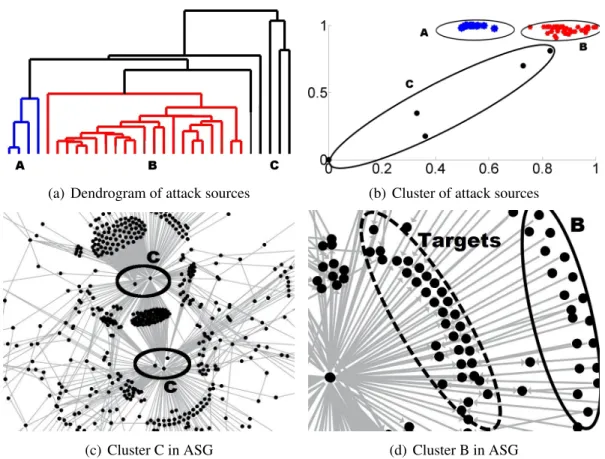
Spatial relationships among attack sources and targets are important features of coor-dinated attacks. With the degree centrality measure and labeling scheme, one can charac-terize the possible role for given attacking sources. Figure 2.4 gives the result of degree centrality based clustering results. In Du’s work [26], connectivity attributes and hierarchi-cal clustering are used for categorize the coordinated attack. Figure 2.4(a) and 2.4(b) are the clustering results at the top level and Fig. 2.4(c) and 2.4(d) show the corresponding
5The spatial pattern example is extracted from UCSD data set, in which the alert can be triggered by
attack sources in the ASG.
Figure 2.3: Attack source labeling
(a) Dendrogram of attack sources (b) Cluster of attack sources
(c) Cluster C in ASG (d) Cluster B in ASG
By analyzing the clusters from Fig. 2.4(a), we find several sets of interesting collabora-tive attack patterns. First, the five feature points within cluster C are actually five distinct attack sources that attack a large number of targets within the network monitored by the Network Telescope. These five sources are outliers on the 2D plane (see clusterC in Fig. 2.4(b)), it is shown in Fig. 2.4(c) to identify these sources in the ASG. Second, some attack sources form clusterB since these sources all have a “special” conspirator 0.211.214.160
6, which is an attack sources in Cluster C and has out-degree 18,920. Being a
conspira-tor of such hosts makes their features significantly different from others and thus forms a cluster. Figure 2.4(d) identifies some of the Cluster B sources in a zoom-in view of the corresponding ASG.
For the spatial labeling approach, by analyzing the joint probabilistic distribution over time of the spatial labels, the patterns can be extracted from a very large training set (2,322,134 attack sources). For convenience, letd(p)denote the number of unique values in a label pattern p. We define this value as the diversityof an attack sequence. Further-more, let {a, b} denote the label patterns with d(p) = 2 that contain x and y regardless of the order over which they occur. Similarly, we can define {a, b, c} and {a, b, c, d}for patterns with d(p) = 3and d(p) = 4, respectively. Figure 2.5 shows the probabilities of occurrence for label patterns withd(p)=1, 2, 3 and 4., for which there are a total of 8, 28, 56, 78 patterns in each set, respectively. The most popular label pattern sets are highlighted in the subfigures. These patterns represent the cases where DDoS and distributed scanning occurred and sometimes switched targets.
The connectivity features are also effective for differentiating different attack behav-ior. Consider two different probing behaviors: web probing andshare probing. The web probingattacks ports 80, 8000 and 8080, and it is widely used to identify live targets at the beginning of the reconnaissance. The destination ports ofshare probinginclude ports 139 and 445, and it is also used for host discovery and OS fingerprinting. The spatial label can
6For anonymity reason, in this chapter, the first byte of IP address from real-world data (UCSD CAIDA
(a) Pattern sets ford(p) = 1 (b) Pattern sets ford(p) = 2
(c) Pattern sets ford(p) = 3 (d) Pattern sets ford(p) = 4
Figure 2.5: Spatial pattern sets probabilities
effectively differentiate these two different behaviors.
(a) Target IP (b) Target port (c) Target IP (d) Target port
(e) Label sequence (f) Label sequence
Figure 2.6: Label sequence comparison for different attacking strategies
of two attack sources from each group. The subfigures (a), (b) and (e) on the left show the behavior ofweb probeand those on the right (c), (d) and (f) show the share probe for comparison. Note that target IP and target ports are two key factors to describe an attacking behavior. The target IPs and ports are shown in a 212 by212IP space and a 28 by28 port
space. Subfigure (e), (f) provide the corresponding label sequence.
Comparingweb probewithshare probe, their target port and IP selections are distinct. In addition to ports 80, 8080 and 8000, web probe also attacks other variations, such as ports 808, 1080 and 2080. share probeonly attacks ports 139 and 445. In terms of target IP,web probeoften explores randomly over the IP space. share probefocuses on scanning individual subnets – the strips in (c) represent the continuous target IPs.
The label sequences of different strategies are very different from one to another. For
web probe, the majority of the labels are Label-2s and Label-5s, along with other non-zero labels spreading over 24 hours. In such case, it is more likely to be an automatic script attack, and have few HATs (Label-6 and Label-7). For share probe, the majority of the labels are Label-0s with occasional occurrences of Label-2s, Label-5s and Label-7s. This suggests share probeis somewhat sporadic with short breaks, which is consistent with it scanning on a subnet basis. Furthermore, Label-7 will also occur sometimes because the concentration of target IPs is likely to hit some HATs.
As discussed earlier, the challenge of discovering coordinated attacks is due to the stealthy actions distributed across multiple attack sources. The spatial features can effec-tively discover such sophisticated attacks buried in the overwhelming data. For example, consider an attack source 0.86.249.218, which sent 59 malicious packets over 24 hours in the Network Telescope data set [65] (the whole data set contains over109 packets).
Table 2.3 gives the details of the first10packets if only traffic volume and target range are considered. There are 21 distinct targets, seemingly randomly selected, and 4 distinct ports (ports 80, 8080, 808 and 8000). There is no evidence suggesting this attack source is important and worthy of further investigation. However, the label sequence for this attack source suggests it could be indicative of advanced attack, where the hacker is switching
Table 2.3: Packet level details for attack source 0.86.249.218 Time Source IP Target IP Protocol Target port 19:11:08 0.86.249.218 0.145.245.69 TCP 80 19:11:21 0.86.249.218 0.145.245.69 TCP 80 19:27:39 0.86.249.218 0.111.153.210 TCP 80 19:28:53 0.86.249.218 0.140.180.153 TCP 8080 19:27:40 0.86.249.218 0.111.153.210 TCP 80 19:28:52 0.86.249.218 0.140.180.153 TCP 8080 19:30:11 0.86.249.218 0.141.139.196 TCP 80 19:29:48 0.86.249.218 0.141.139.196 TCP 80 19:30:22 0.86.249.218 0.141.68.93 TCP 80 19:27:36 0.86.249.218 0.111.153.210 TCP 80
between compromised hosts, which can be exhibited by the ASG subgraphs. Therefore we further verify our discoveries by examining the corresponding ASG over time. Figure 2.7(a) to 2.7(d) give the ASG subgraphs in four consecutive time frames T6 to T9. The
attack source 0.86.249.218 is highlighted with the solid circle. For better visualization, only the attack source, its targets and its conspirators are shown. The extracted ASGs show that the attack source is not a inconsequential attacker. Although the malicious traffic volume and the out-degree of the attack source are both small, most of its targets are heavily attacked. During the entire20minutes, the attack methodically narrowed down the point-of-interest and increased the volume of attacks on specific targets. At T6, it attacked 6
targets, and 4 of them were also attacked by other sources. At T7, it reduced the range of
targets by 1. Among the remaining 5 targets, 2 were attacked by others. ForT8, the target
declined to 4, but 2 of them were heavily attacked by 7 and 14 other sources, respectively. In addition, there were 3 suspicious sources that attacked both HATs. Note that, in a large targets space, it is unlikely to have 4 hosts simultaneously select the same two targets. One can hypothesize that these attack sources are controlled as zombie machines or collaborated together for the attack. Finally, at T9 the source reduced the attack to only three targets
and focused on one to perform comprehensive attacks using multiple hosts. This example illustrates that an attack source with transitions between Label-6 and Label-7 can be critical
and worth further investigation.
(a) Attacks inT6 (b) Attacks inT7 (c) Attacks inT8 (d) Attacks inT9
Figure 2.7: Label Sequence and ASG Subgraphs for Attack Source 0.86.249.218
2.2
Predict possible attack actions
Connectivity features as well as the computational models based on the proposed features allow the discovery of notorious attacking sources and non-trivial attacking sources. On the other hand, one may want to focus on one specific attacking source and predict what next attack action may happen. Sequence modeling and prediction will allow us for such tasks.
As discussed in Chapter 1, Variable Length Markov Model (VLMM) has been used to adaptively extract patterns in cyber attacks [35]. Though showing promising results, the VLMM approach focused on extracting patterns and projecting based on specific attributes of IDS alerts. A projection made based on one attribute may not match to that based on another. Consider a simplified example shown in Table 2.4.
The VLMM predictions will suggest ‘192.168.3.x,’ ‘UDP,’ and ‘WEB-MISC http di-rectory traversal’ as the top choices for attributes, tip(subnet), prt, anddsc, respectively. A granularity at the subnet level is used for better capturing the movements of the at-tack across the accessible regions (collision domains that are typically defined similarly by router firewall rules). The per attribute choices, however, cannot be combined di-rectly since: (1) the ‘HTTP request’ does not utilize ‘UDP’ protocol and (2) the subnet 192.168.3.x in the test network does not contain a web server. Therefore, it is necessary to develop an intelligent and robust combination.
Table 2.4: Per attribute prediction example by VLMM.
Attributes Possible Values Probability
tip(subnet) 192.168.1.x 0.1602 192.168.3.x 0.8141 192.168.20.x 0.0256 prt TCP 0.4318 UDP 0.5681 dsc SMTP sendmail 5.5.5 exploit 0.4349
WEB-MISC http directory traversal 0.5513
FTP adm scan 0.0138
The per alert attribute VLMM predictions need to be transformed to projection scores with respect to the target machines for combination. Two projections scores, P rojt and
P rojd, are derived based on VLMM predictions based on ‘tip(subnet)’ and ‘dsc,
respec-tively. The P rojt(h)represents how likelyh may be targeted next according to the order
of subnets that have been attacked, and is referred to as the IP projection. TheP rojd(h)
is based on the sequence of service exposure being exploited, referred to as the exposure projection. Letpt(·)andpd(·)be the probabilities derived based on VLMM with respect to
‘tip (subnet)’ and ‘dsc, respectively. Also letN(h)be the subnet hresides, andE(h)be the set of vulnerability exposureshcontains.
P rojt(h) = pt(N(h))
P rojd(h) =
X
i∈E(h)
pd(i)
To combineP rojtandP rojd, we chose to use fuzzy inference, for its effectiveness as
an information fusion tool that mimics human analytics [67, 68]. There are two types of fuzzy inference systems, Mamdani and Sugeno [69]. We utilized Sugeno System since it guarantees continuity of output surface. The system has two components: themembership functionsfor fuzzifying inputs and theinference rulesfor combination.
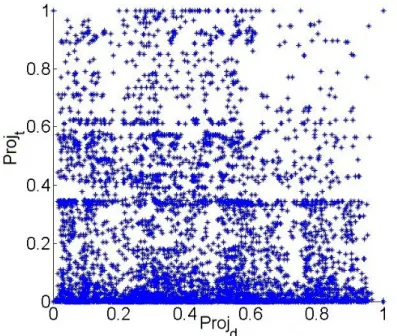
Membership functions can be derived from examining the distribution of the inputs. Figure 2.8 shows a scatter plot ofP rojtversusP rojdfor all targets throughout a training
while there is a concentration of inputs between 0 and 0.1 forP rojt. Interestingly, different
experimental datasets are tested and the results scatter plots are similar. This is due to the fact that while many machines are hidden behind firewalls in most instances, the estimation based on service exposure do not account for such and produce uniform distribution with a sufficiently large set of services and machines.
Figure 2.8: A scatter plot ofP rojtversusP rojdof all hosts
In order to differentiate within the concentration region of [0,0.1], more membership functions are used forP rojt. Figure 2.9 shows the membership function design: 5
mem-bership functions and 3 memmem-bership functions are used to fuzzify the P rojt and P rojd,
respectively.
Given the membership functions, there are 15 inference rules combining P rojd and
P rojt. The rules places a higher emphasis onP rojtbecause human analysts typically give
more credit to where the attack has reached instead of what services have been attacked. Table 2.5 gives a tabular view of the rules. The elements (aij) in Table 2.5 are aggregated to
(a) Exposure projection (b) IP Projection
Figure 2.9: The fuzzy membership functions
using the fuzzy logic AND operator.
projection= 5 X i=1 3 X j=1 uij ·aij/ 5 X i=1 3 X j=1 uij where uij ,µi(P rojt)·µj(P rojd),
andµi andµj denote theithand thejthmembership function ofP rojtandP rojd.
Table 2.5: Fuzzy inference rules used to combine VLMM outputs
P rojt
P rojd low 1 low 2 low 3 medium high
low 0.0 0.2 0.4 0.6 0.8 medium 0.2 0.4 0.6 0.8 1.0 high 0.4 0.6 0.8 0.8 1.0
The resulting overall system can be illustrated using the input/output surface plot shown in Figure 2.10. Note that the surface quickly rises in the dense region of IP exposure, to differentiate the inputs and reduce false positives. The changes with respect to the exposure projection is gradual to reflect the uniform distribution described earlier.
Attack prediction by VLMM prediction and fuzzy combination (F-VLMM) were tested via simulation. Simulated multi-stage attacks were gener
![Figure 1.4: An example of attack prediction using recommendation system [27]](https://thumb-us.123doks.com/thumbv2/123dok_us/351409.2538678/22.918.165.766.726.940/figure-example-attack-prediction-using-recommendation.webp)