PTTA
PERPUS
TAKAAN
TUNKU
TUN
AMI
NAH
AN IMPROVED ALGORITHM FOR IRIS CLSSIFICATION BY USING SUPPORT VECTOR MACHINE AND BINARY RANDOM MACHINE
LEARNING
AHMAD HAADZAL BIN KAMARULZALIS
A project submitted in partial
fulfillment of the requirement for the award of the degree of Master of Science (Applied Mathematics)
Faculty of Applied Sciences and Technology Universiti Tun Hussein Onn Malaysia
JULY 2018
PTTA
PERPUS
TAKAAN
TUNKU
TUN
AMI
NAH
iii
Dedicated to my beloved father and mother, Kamarulzalis Bin Majid and Nora Binti Matzin for their endless moral and financial support from the beginning until the end of this Master’s Project Report.
PTTA
PERPUS
TAKAAN
TUNKU
TUN
AMI
NAH
Iv ACKNOWLEDGEMENT
In the name of ALLAH, the Most Beneficent and the Most Merciful for His blessing. First of all, I would like to express my gratitude to my beloved supervisor Dr. Mohd Asrul Affendi Bin Abdullah from Universiti Tun Hussein Onn Malaysia (UTHM) for all his help, guidance and encouragement during the completion of this research thesis. Besides, I also would like to thank my program coordinator, Dr. Fazlina Binti Aman for her cooperation and information all the way in finishing my research thesis.
In addition, thanks to my family, all of my course mate and friends for their sharing in the knowledge and opinion regarding this study. Then, a big appreciation for them for their full support and suggestions while completing this research thesis.
ABSTRACT
In machine learning, there are three type of learning branch that can used in classification procedures for data mining. Those branch are consist of supervised learning, unsupervised learning and reinforcement learning. This study focuses on supervised learning that seek to classify all the Iris dataset respect to three species (setosa, versicolor and virginica) in order them to mimic the actual dataset by using Support Vector Machine with four different kernel function (Linear, Radial Basis,
Sigmoid and Polynomial), Random Forest (RF), k-Nearest Neighbors(k-NN) and Random Nearest Neighbors (RNN) as a method. The first objective of this study is to improve a new algorithm technique for classification. The new algorithm come from a combination of an ideas of k-NN algorithm and ensemble concept. The second objective is to conduct a supervised and binary ensemble machine learning technique for classification. This is done by using method of RF and RNN that share the same
PTTA
PERPUS
TAKAAN
TUNKU
TUN
AMI
NAH
v ensemble concept. The last objective is to identify the best model for classification procedures. Performance Measurement Tools such as overall accuracy, kappa, average sensitivity, average specificity, average precious, average detection rate, average prevalence and misclassification error rate (MER) were used by refers confusion matrix values output during data analysis for average and individual performance of each classifier. Besides that, Performance Visualization such as Stacked Bar Plot, Fourfold Plot, Receiver Operating Characteristic (ROC) Curve and
Lollipop Chart are used to simplify each output for more clear understanding. Random Nearest Neighbors (RNN) has highest accuracy value that is 98.67% and just 1.33% misclassification error rate (MER) compare to other classifier. Therefore, Random Nearest Neighbors (RNN) is preferable for supervised learning classification procedures.
PTTA
PERPUS
TAKAAN
TUNKU
TUN
AMI
NAH
vi ABSTRAK
Dalam pembelajaran mesin, terdapat tiga jenis cabang pembelajaran yang boleh digunakan dalam prosedur klasifikasi untuk perlombongan data. Cabang ini terdiri daripada pembelajaran berselia, pembelajaran tanpa selia dan pembelajaran peneguhan. Kajian ini menumpukan kepada pembelajaran dengan pengawaasan yang bertujuan untuk mengklasifikasikan semua dataset Iris kepada tiga spesies (setosa, versicolor dan virginica) agar mereka menyamai dataset asal dengan menggunakan Mesin Vektor Sokongan dengan empat fungsi kernel yang berbeza (Linear, Radial Basis, Sigmoid dan Polinomial), Hutan Rawak (RF), k-Jiran Terdekat (k-NN) dan Jiran Rawak Terdekat (RNN) sebagai kaedah. Objektif pertama kajian ini adalah untuk menaiktaraf teknik algoritma baru untuk klasifikasi. Algoritma baru datangnya dari gabungan idea algoritma dan konsep ensembel k-NN. Objektif kedua adalah melakukan teknik pembelajaran mesin secara ensembel dengan pengawasan dan binari untuk klasifikasi. Ini dilakukan dengan menggunakan kaedah RF dan RNN yang berkongsi konsep ensembel yang sama. Objektif terakhir adalah untuk mengenal pasti model terbaik untuk prosedur klasifikasi. Alat Pengukuran Prestasi seperti ketepatan keseluruhan, kappa, kepekaan purata, kekhususan purata, nilai julat purata, kadar pengesanan purata, kelaziman purata dan kadar kesalahan klasifikasi (MER) telah digunakan dengan menggunakan output nilai-nilai matriks kekeliruan semasa analisis data untuk prestasi purata dan individu setiap kaedah klasifikasi. Di samping itu, Visualisasi Prestasi seperti Susunan Carta Bar, Carta Empat Bahagian, Ciri Pengendali Penerima (ROC) dan Carta Lollipop digunakan untuk mempermudahkan output ini untuk difahami. Jiran Rawak Terdekat (RNN) mempunyai nilai ketepatan tertinggi iaitu 98.67% dan hanya 1.33% kadar kesalahan klasifikasi (MER) berbanding dengan kaedah klasifikasi lain. Oleh itu, Jiran Rawak Terdekat (RNN) lebih baik untuk prosedur klasifikasi pembelajaran yang diawasi.
TABLE OF CONTENTS TITLE i DECLARATION OF AUTHOR ii DEDICATION iii
PTTA
PERPUS
TAKAAN
TUNKU
TUN
AMI
NAH
vii
ACKNOWLEDGEMENT iv
ABSTRACT v
ABSTRAK vi
TABLE OF CONTENTS vii
LIST OF TABLE x
LIST OF FIGURE xi
LIST OF APPENDICES xiii
CHAPTER 1 INTRODUCTION 1 1.1 Background of study 2 1.2 Problem statement 2 1.3 Objective of study 3 1.4 Scope of study 3 1.5 Significance of study 3 1.6 Definition of terms 3 CHAPTER 2 LITERATURE REVIEW 5
2.1 k-Nearest Neighbors (KNN) 5
2.2 Random Nearest Neighbors (RNN) 6
2.3 Support Vector Machine (SVM) 6
2.4 Random Forest (RF) 8
2.5 Performance measurement tools 10
2.6 Summary 11
CHAPTER 3 RESEARCH METHODOLOGY 12
3.1 Method of data analysis 12
3.1.1 Stage 1: Data collection 13
3.1.2 Stage 2 : Classification method 14
3.1.2.1 Support Vector Machine (SVM) Algorithm 15
PTTA
PERPUS
TAKAAN
TUNKU
TUN
AMI
NAH
viii
3.1.2.2 Random Forest (RF)
Algorithm 18
3.1.2.3 k-Nearest Neighbors (KNN) Algorithm 19
3.1.2.4 Random Nearest Neighbors (RNN) Algorithm 20
3.1.3 Stage 3 : Classifiers performance measures 21
3.1.4 Stage 4 : Performance visualization 23
3.2 Summary 25
CHAPTER 4 RESULT AND FINDINGS 26
4.1 Data analysis 26 4.2 Machine learning 27 4.2.1 Support Vector Machines (SVMs) 27
4.2.2 Random Forest (RF) 29
4.2.3 k-Nearest Neighbors (KNN) 29
4.2.4 Random Nearest Neighbors (RNN) 29
4.3 Confusion matrix and stacked bar plot 30 4.4 Visualization analysis 42 4.4.1 Receiver Operating Characteristics (ROC) Curve 42
4.4.2 Lollipop Chart 44
CHAPTER 5 CONCLUSIONS AND RECOMMENDATION 46
5.1 Conclusions 46 5.2 Recommendation 47 REFERENCES 48 APPENDICES 51
PTTA
PERPUS
TAKAAN
TUNKU
TUN
AMI
NAH
ix LIST OF TABLES
3.1 Summary of SVM with different function 17
3.2 Summary of coding for changing kernel types 18
3.3 Example of confusion matrix for predicted class 22
4.1 Confusion matrix of Linear Support Vector Machine 30
4.2 Confusion matrix of Radial Support Vector Machine 32
4.3 Confusion matrix of Sigmoid Support Vector Machine 32
4.4 Confusion matrix of Polynomial Support Vector Machine 33
4.5 Confusion matrix of Random Forest 34 4.6 Confusion matrix for k-Nearest Neighbors (KNN) for k=1 35
4.7 Confusion matrix for k-Nearest Neighbors (KNN) for k=3 36
4.8 Confusion matrix for k-Nearest Neighbors (KNN) for k=5 37
4.9 Confusion matrix for k-Nearest Neighbors (KNN) for k=7 37
4.10 Confusion matrix for k-Nearest Neighbors (KNN) for k=9 38
4.11 Confusion matrix for Random Nearest Neighbors (RNN) 39
4.12 Performance comparison table for Iris species classification. 41 LIST OF FIGURE 3.1 An image of all Iris species 13
3.2 Iris dot plot for all species 14
3.3 An example of hyper-plane for SVM 15
3.4 An illustration of Random Forest Algorithm 19
3.5 An example of Receiver Operating Characteristic (ROC) curve 24
PTTA
PERPUS
TAKAAN
TUNKU
TUN
AMI
NAH
x
4.1 Stacked bar plot for Iris data 27
4.2 Output of Linear & Radial SVM 28
4.3 Output of Sigmoid & Polynomial SVM 28
4.4 Stacked bar plot on Linear Support Vector Machine 31
4.5 Stacked bar plot on Radial Support Vector Machine 32
4.6 Stacked bar plot on Sigmoid Support Vector Machine 33
4.7 Stacked bar plot on Polynomial Support Vector Machine 34
4.8 Stacked bar plot on Random Forest (RF) 35 4.9 Stacked bar plot on k-Nearest Neighbors (KNN) for k=1 35
4.10 Stacked bar plot on k-Nearest Neighbors (KNN) for k=3 36
4.11 Stacked bar plot on k-Nearest Neighbors (KNN) for k=5 37
4.12 Stacked bar plot on k-Nearest Neighbors (KNN) for k=7 38
4.13 Stacked bar plot on k-Nearest Neighbors (KNN) for k=9 38
4.14 Stacked bar plot on Random Nearest Neighbors (RNN) 39
4.15 ROC curve comparing classification performance for all machine learning model based on overall accuracy for all species. 42
4.16 ROC curve comparing classification performance for all Machine Learning models based on average values for all species. 43
4.17 ROC curve comparing classification performance for all machine learning models respect to versicolor & verginica species 44
4.18 Lollipop chart for machine learning performance on Iris classification. 45 LIST OF APPENDICES
PTTA
PERPUS
TAKAAN
TUNKU
TUN
AMI
NAH
xi
APPENDIX TITLE PAGES
A Coding for all classifier 51 B Summary for all Support Vector Machine 54
C Summary for all classifier based on confusion matrix 56 D Iris dataset using microsoft excel 67
PTTA
PERPUS
TAKAAN
TUNKU
PTTA
PERPUS
TAKAAN
TUNKU
TUN
AMI
NAH
CHAPTER 1 INTRODUCTION
The science of extracting useful information from large data sets, big data or databases is known as data mining according to Hand et al. (2001). It is a new discipline, lying at the intersection of statistics, mathematics, machine learning, data management and artificial intelligence in computer science areas and others. All of these are concerned and involve with certain aspects of data analysis, so they have much in common. But each also has its own variety pattern, emphasizing problems and types of solution. Data mining encompasses a wide variety of topics in computer science, statistics and mathematics. So, impossible to view all of them in this study. On the other hand Machine Learning is a sub-field of data science that can be used for data mining. Given, for this study one of the branch will be focused that is classification area.
Basically, classification have divided into three branches. These branches are Supervised, Unsupervised and Reinforcement Learning methods. But, for this study improvement supervised learning techniques (Machine learning) are focused. Learning from numerical data (independent variables) to classify a categorical data (dependent variable) in order to mimic actual data was carried on for this study. The variable that going to predicted is typically called as class variable (for obvious reasons). While, for independent variable usually in form of features, attributes, explanatory variables, input, and so on.
PTTA
PERPUS
TAKAAN
TUNKU
TUN
AMI
NAH
2 In this study, classification was done to classify an Iris dataset respectively to fifty flowers from three species that are Iris setosa, versicolor and virginica while to verify a new ensemble technique. This chapter provides background, problems statement, objectives, scope, significant of study and summary of definition of terms.
1.1 Background of study
In machine learning, there are three basically type of algorithms used, they are supervised, unsupervised learning and reinforcement learning. Supervised learning are requires learning a function from training data provided as input. Supervised learning basically used in classification procedures. In classification, to determine an object is a member of a set or not is a difficult problem nowadays. The data classification has a wide variety scope in data mining applications such as in Medical Disease Diagnosis, Multimedia Data Analysis, Social Network Analysis, Business Analysis, and so many more according to Aggarwal (2015). For this study, classification on data was done by using Machine Learning classifier and some improvement method to handle various types of data were done.
1.2 Problem statement
Nowadays, all over the world keep pushing their self, busy and focused on term of data science, big data and data mining. But, the fundamental concepts behind the scene is the technique it-self. To deal with an infinite numbers and types of data for various areas especially in classification. In classification there are three types of learning which are supervised, unsupervised and reinforcement learning but, when user decide to run a wish list classifier usually they having a problem to pick the most suitable algorithm respect to their data structures. In addition, classifier user didn’t know the techniques to do a classification that generate high accuracy output and problem to interpret theirs result in a simplest manner. On the other hand, the classifier user didn’t know which technique robust for them to use. 3
1.3 Objectives of study
The objectives of this study are:
PTTA
PERPUS
TAKAAN
TUNKU
TUN
AMI
NAH
ii. To conduct a supervised and binary ensemble machine learning technique for classification.
iii. To identify the best model for classification procedures.
1.4 Scope of study
This study will seeks on supervised learning technique to classify an Iris Flower dataset accordingly based on actual one in order to test, analyze and verify accuracy levels of our new classifier approach. This study rely on theoretical part when new algorithm technique are produced by combined two basic ideas in order to improve accuracy of classifier for classification.
1.5 Significance of study
This study is to help classifier user to improve their level of accuracy in classification. The results obtained from this study can be used as a stepping stone for more robustness of classification procedures to researchers, academician, diagnostician, data scientist, data engineer and to all that uses classification algorithm in their field of work.
1.6 Definition of terms
Support Vector Machine (SVM) – SVM is one of the supervised machine learning algorithm that acts as a discriminative classifier, formally defined by an optimal hyper plane that splits all the classes. SVM have four types linear, radial, sigmoid and polynomial kernel that depend on the data for a better result.
Random Forest(RF) - RF is a combination of trees that each tree depends on the values of random sampled independently and with same split for all tree in the forest. It is one of the ensemble learning techniques that used a bootstrap aggregation/bagging samples with replacement for data collection and using majority voting sample as a criteria for decision making in classification procedures.
PTTA
PERPUS
TAKAAN
TUNKU
TUN
AMI
NAH
4
K-Nearest Neighbours (KNN) – k-NN is a non-parametric method that commonly used in classification and prediction. K-NN uses to classify a point based on their nearest neighbors by considers the shortest Euclidean Distance neighbors and majority vote as a main element for classification and prediction.
Random Nearest Neighbours (RNN) – RNN is one of the classification method that use concept of ensemble learning. RNN consist of an ensemble of base k-nearest neighbor model form a random consideration of neighbors depend on user itself and sometimes it can be a repeated and distinct values. In this algorithm, ensemble here refer to an ensemble or collection of output. This method shows how the majority votes play an important role in output priority and classification.
5 CHAPTER 2 LITERATURE REVIEW
In this study, information and dealing with data of the previous work for classification were used. In addition, several techniques and methods associated with the project are reviewed briefly.
2.1 k – Nearest Neighbors (KNN)
The k-Nearest Neighbors (k-NN) method are one of the supervised classification algorithms that used neighbours distances to identify unknown point and this method also known as lazy method. There are several journal about k-NN algorithm. :
PTTA
PERPUS
TAKAAN
TUNKU
TUN
AMI
NAH
Jabbar et al. (2013) used nearest neighbors for their research in order overcome misclassification regarding heart disease issues and to reduce no. of test for diagnosis for disease detection of each patient. Disease diagnosis often done based on doctors experience and personal opinion rather than the data hidden in the medical data base, which leads to wrong diagnosis and increases diagnosis costs which in turn affects the quality of services provided by hospitals to the patients that why this research are carried on. As a way to validate the proposed methods, they are testing with emphasis on heart disease on A.P besides other machine learning data sets, taken from UCI repositories. This method indirectly reduces no. of tests to be taken by patients. This prediction model even helps the doctors in efficient decision making process.
Sutton (2012) in the studied views on how KNN algorithm work and how it can be visualize by using Applet software. In this research paper, more application on how to robust the output of classification are shown. In addition, cross validation test also be views in order to find the best values of nearest neighbor, that lead to highest accuracy when unstructured data take place. In conclusion, this show the limitation of KNN algorithm that need to more improvement when dealing with outlier and hidden data especially.
2.2 Random Nearest Neighbors (RNN)
RNN are one of the new method that classify in supervised learning techniques with ensemble approach. Actually RNN come from collection of k-NN output with majority vote. RNN an improved of k-NN, which implies a multiples consideration nearest neighbors for each unknown point compared to k-NN that used single nearest neighbors consideration .Values of K for nearest neighbors should be an odd value in order to avoid ties.
2.3 Support Vector Machines (SVMs)
Support vector machines (SVMs) are a group of supervised classification algorithms that be modified to handle various data in order to achieve their aim to separate a binary classes by using hyper plane with low misclassification rate. There are several journal about SVMs.
PTTA
PERPUS
TAKAAN
TUNKU
TUN
AMI
NAH
6 Ogunlana et al. (2015) conducted a study on fish classification by using support vector machines and by using others machine learning classifier such as KNN, ANN and K-mean clustering. Fish recognition is presently a very complex and difficult task despite its commercial and agricultural usefulness. Some of the challenges facing accurate and reliable fish recognition include distortion, noise, segmentation error, overlap and occlusion. In this research they have viewed a comparison table with distinct classifier. The technique is based on the shape features of fish that was divided into two subsets with the first comprising 76 fish as training set while the second comprises of 74 fish as testing set. The body and the five fin lengths; namely anal, caudal, dorsal, pelvic and pectoral were extracted in centimeter
PTTA
PERPUS
TAKAAN
TUNKU
TUN
AMI
NAH
7
(cm). Results based on the new technique show a classification accuracy of 78.59% when SVM take place, which is significantly higher than what obtained for ANN, KNN and K-mean clustering-based algorithms.
Mountrakis et al. (2011) conduct a research on remote sensing field by using SVM to analyse it performance in generalize even limited samples. According them, SVMs can yield comparable accuracy using a much smaller sample size. This is in line with the support vector concept that relies only on a few data points to define the classifier’s hyperplane. This property has been exploited and has been prove that SVM very useful in any application. Furthermore, SVM is suitable for image recognition and classification that sometimes has complex environment.
Ciobanu (2012) conducted a study and review the utilization of SVM for classification problems and exemplify this with application on IRIS datasets by using Matlab programming language to implement the algorithm and applied it on the dataset. In this paper, many SVM algorithm been shows such as Lagrangian (LSVM), Lagrangian finite Newton SVM (NLSVM) and others. In addition, it shows how to handle data by using Lagrange multipliers function when distinct values of parameter take place. Besides that, generalization in multi-dimension feature space also be shown, such as radial, polynomial, and sigmoid function by using iris dataset. At the end of this paper, he mention that the best classification for linearly inseparable case, were obtained for polynomial and radial basis kernels which underlines once again the importance of a correct choice for the kernel function used.
Kavzoglu and Colkesen (2009) conduct a study on land cover classification by using different kernel function and it parameter by using support vector machines. They used Gebze district of Turkey using Landsat ETM+ and Terra ASTER images as their sample. In their research, analysis and distinct values of parameter for radial basic function (RBF) and polynomial are tested. At the end, they found that it was found that the radial basis function kernel produced more accurate results than the polynomial kernel by about 2% overall accuracy. While the accuracy of polynomial support vector machine influence by the degree values when different data sets were introduced.
Gunn (1998) view technical ways for support vector machines for classification and regression. In this paper, more manner technical and theoretical part are shown especially on how to optimize the hyper plane in SVM, multiple function of support vector machine application consist of Gaussian radial basis, polynomial, linear and
PTTA
PERPUS
TAKAAN
TUNKU
TUN
AMI
NAH
8
Fourier series SVM. Gunn says that, kernel mapping provides unifying framework for most of the model and data structures.
2.4 Random Forest (RF)
Random forest is an ensemble machine learning method that come from combination of decision trees output. There are several journal that shows implementation of random forest.
Jia et al. (2013) conducted a research on comparison between support vector machine and random forest algorithm to predict β-hairpin motifs in proteins. βhairpin is a super secondary structure motif. In the β-β motif, if two anti-parallel βstrands are connected by loop and there are one or more hydrogen bonds between two adjacent strands, then the structure is called as β-hairpin, otherwise it is considered as non-β-hairpin. Correct prediction of β-hairpin motifs is helpful to folding recognition, and it is vital for simplifying folding numbers of unknown structure. Therefore prediction of β-hair- pin motifs has very important meaning.
Through this paper, combination sample of β-hair sample are shows with same characteristic parameter and the same method applied. At the end of this paper, it shows Random Forest algorithm is better than Support Vector Machine since random forest doesn’t produce over-fitting when the dimension of characteristic parameter are higher.
Random Forest that had been originally proposed by Leo Breiman (2001) and has been classify as an ensemble classifier, it contains many decision trees. For each tree in the forest, a training set is firstly generated by randomly choosing N times with replacement from all N samples of the original dataset (bootstrap), and the rest are used as a testing set. When each node of single decision tree is splitting, the number of features used for splitting each node of decision tree is firstly specified. Then out of features are randomly selected and the best split attribute on these features is used to split the node, such that the impurity at each node of single decision tree is minimized and each tree in the forest fully grows without pruning. A Random Forest with k
decision trees is formed by repeating k times as above procedure, and then the Random Forest is used to predict test data. The final classification results are decided by all the votes.
PTTA
PERPUS
TAKAAN
TUNKU
TUN
AMI
NAH
9
Leo Breiman (1996) view a bagging concepts for prediction in order to generate version of a predictor when dealing with numerical outcome. The multiple versions are formed by making a bootstraps replication with replacement to generate new learning sets. Through the research, various datasets are used in order to test the significant bootstrap method. Each data that has been generate will be divide into two, first testing and second test data. An output of the research be measures by using multiple tools. Besides that, Breiman also view how to choose a significant variable for classes. After a few bootstrap replacement process be measures, they found that bootstrap is an easy way to improve an existing method.
Leo Breiman (2002), conducted a study on how to setting up, used and understanding the random forest briefly and has been view in manual page. In that manual many perspective have been discuss such as setting parameter, setting up and run, option and variable importance, option based on proximities, saving the forest and output controls. In addition, he has views the advantages of random forest compare to decision trees, an examples of that are, random forest does not over-fit. Users can run it as much as possible. Lastly, he also view how to modify the parameter according to user data framework and pattern.
Baylander (2002) conduct a study on estimating generalization error using Out of Bag (OOB) estimates. In bagging, each predictor is learned from a bootstrap sample of the training examples, the output of a bag (a set of predictors) on and it determined by voting. The out of-bag estimate is based on recording the votes of each predictor on those training examples omitted from its bootstrap sample. In addition, this research also discuss on how to use the out-of-bag estimate to estimate generalization error. The experiments on several datasets show that the out-of-bag estimate and 10-fold cross-validation have very inaccurate (much too optimistic) confidence levels. Two classes are involve in this research. Each class are classify by using random forest and their error are been measures and OOB values also be calculate for overall performance. After evaluation, it show that the OOB error are significant with the overall test, that why it is important to use as many examples as possible for training the hypothesis (or hypotheses) from a dataset. He, views that, it is also important to determine a good estimate of generalization error so that we can have confidence that a good hypothesis has been learned.
PTTA
PERPUS
TAKAAN
TUNKU
TUN
AMI
NAH
10
There are several types for methods in performance measurement in classification. The performance measurement is the process of collecting, analyzing and reporting information regarding the performance of a certain scope of interest. Kappa statistic and error test are among the techniques used. For this stage, performance measurement is the last step to determine the level of correctly classified. Many researchers used this techniques to determine the validity their classification result. Some researcher used this in reduce the cost and researchers generally decide about the sample size arbitrarily either at their convenience Malhotra et al. (2010). The explanation from other researcher are very useful in analyzing the performance.
In 2012, in another research by Indrayan et al. was carried out. They used sensitivity and specificity method as their main techniques in doing research in scope of Medical Biostatistics in order to identify present and absent of a diseases. The primary target of this study is on the patient that they expect to have a cancer disease. In this study, they have collected a data from 4000 patient. All of their respondents have do some medical procedures. After the classification process, they have viewed an output of confusion matrix. By the confusion matrix, the specificity, sensitivity, positive predictivity, negative predictivity and accuracy have be shows manually. From the result, 95% sensitivity, 94.5% specificity, 47.5% positive predictivity and 99.7% values are be generate. In addition, it showed that from the testing, most of the respondent free from cancer diseases. As a conclusion, this cross-validation under discriminant analysis can be used to check the validity of classification level. In order to analyze the disease classification output and to applying concept of sensitivity and specificity to a test. Kanchanaraksa (2009) a researcher in Johns Hopkin University used the screening test as a procedures in complete the study. Screening test ware used to identify the presence or absent of a disease when the patients shows the symptoms. This study conducted an analysis on 1000 persons who have a symptom in a disease, 100 have a disease and the others are free from disease. This screening test is to identify 100 persons with the disease correctly. After classification is done, the level of sensitivity is 80% and for specificity 89%. In addition, this study also views on how the concept of sensitivity and specificity perform when it is deals with various type of test and method of classification. Besides that, he shows how to separate or cut yields different sensitivity and specificity.
PTTA
PERPUS
TAKAAN
TUNKU
TUN
AMI
NAH
11
According to the above resources, all method can be applied for various purposes with different input and lead to the best result. Iris Flower classification can be analyzed by using others several techniques and can be interpret with by using various ways. These method is significant in classification of Iris dataset and for verifying procedure of a new method. Besides that, there are no proofs that, no specific method that can be used to classify those dataset, and all methods are suitable for classification in this study.
PTTA
PERPUS
TAKAAN
TUNKU
TUN
AMI
NAH
12
CHAPTER 3 RESEARCH METHODOLOGY
This chapter provides a few details on the techniques that will be focused on this study in order to complete and finish this project. In this project, four types of major classifiers will be used, they are Support Vector Machine (SVM), Random Forest (RF) k-Nearest Neighbours (KNN) and Random Nearest Neighbors (RNN). Parameter or Kernel changing for Support Vector Machine (SVM) will be done respect to four type of Kernel that is Linear, Radial, Sigmoid and Polynomial Kernel and for KNN algorithm, five odd k values are used with respect to 1, 3, 5, 7, 9. Odd values were choose to avoid ties. The flow chart are proposed to be applied in this project and will be presented and discussed in this chapter. R programming software and the manual equation of each classifier is shown.
3.1 Method of data analysis
The method of data analysis consists of four stages. First procedure, is data collection. Second stage is classification method, briefly describe an algorithm that involve in this study. All data will be classify with three distinct classifier that is Support Vector Machines, Random Forest and Random Nearest Neighbors. Third stage is Classifier Performance Measures tools, all classifier output will be measures correctly by using various measurement tools such as sensitivity, specificity, misclassification error (MER) and so on. Fourth, is Performance Visualization by using ROC curve and so on. R
PTTA
PERPUS
TAKAAN
TUNKU
TUN
AMI
NAH
13 programming software will be uses as a tool to recall a package for SVM, Random Forest and other package that needed for this study. Based on all classifier, their result are shown in confusion matrix and other visualization graph and chart to make it easy to understand an interpreting procedures.
3.1.1 Stage 1: Data collection
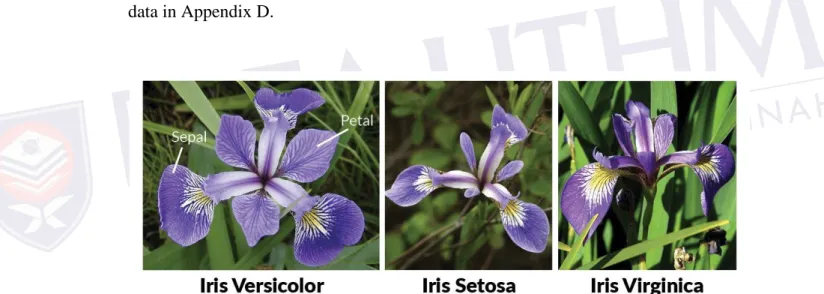
For the first stage that is data collection. For this study, secondary data was used. Data can be read into R from a file that already built into R. One such dataset is the well-known Iris data also the famous (Fisher's or Anderson's) data set. The dataset also been used in Fisher (1936) research and it contains measurements in centimeters (cm) of the variables sepal length and width and petal length and width on 150 flowers, 50 each from 3 species that is Iris setosa, versicolor and virginica. Below are the Iris Images and Dot plot for the data set based on Maindonald (2008) research paper. Detail on Iris data in Appendix D.
Figure 3.1: An Image of all Iris Species
(https://s3.amazonaws.com/assets.datacamp.com/blog_assets/Machine+Learning+R/i ris-machinelearning.png )
PTTA
PERPUS
TAKAAN
TUNKU
TUN
AMI
NAH
47
REFERENCES
Aggarwal, C. C. (2015). Data classification : algorithms and applications. Series: Chapman & Hall/CRC data mining and knowledge discovery series ; 35.
Retrieved from
http://www.worldcat.org/oclc/890721171%5Cnhttps://www.chapters.indigo.c a/en-ca/books/data-classification-algorithms-and applications/9781466586758- item.html
A. Liaw and M. Wiener, “Classification and Regression by Random Forest,” R News, Vol. 2, 2002, pp. 18-22.
Boulet, R., & Jouve, B. (2008). The lollipop graph is determined by its spectrum. arXiv preprint arXiv:0802.1035.
Bylander, T. (2002). Estimating generalization error on two-class datasets using out of-bag estimates. Machine Learning, 48(1-3), 287-297.
Chih-Wei Hsu, Chih-Chung Chang, and C.-J. L. (2008). A Practical Guide to Support Vector Classification. BJU International, 101(1), 1396–1400.
https://doi.org/10.1177/02632760022050997
Ciobanu, D. (2012). Using SVM for classification. Acta Universitatis Danubius.
Œconomica, 8(5).
Cutler, A. (2013). Trees and random forests. NIH 1R15AG037392-01, 92.
David M W (2011). "Evaluation: From Precision, Recall and F-Measure to ROC, Informedness, Markedness & Correlation" (PDF). Journal of Machine Learning Technologies. 2 (1): 37–63.
PTTA
PERPUS
TAKAAN
TUNKU
TUN
AMI
NAH
48 Fisher, R. A. (1936) The use of multiple measurements in taxonomic problems.
Annals of Eugenics, 7, Part II, 179–188.
Fawcett, T. (2003). ROC Graphs: Notes and Practical Considerations for Data
MiningResearchers ROC Graphs : Notes and Practical Considerations for Data Mining Researchers. HP Invent, 27. https://doi.org/10.1.1.10.9777
Gunn, S. R. (1998). Support vector machines for classification and regression. ISIS technical report, 14, 85-86.
Hand, D., Hand, D., Mannila, H., Mannila, H., Smyth, P., & Smyth, P. (2001).
Principles of data mining. Drug safety : an international journal of medical
toxicology and drug experience (Vol. 30). https://doi.org/10.2165/00002018 200730070-00010
Heagerty, P. J., Lumley, T., & Pepe, M. S. (2000). Time‐ dependent ROC curves for
censored survival data and a diagnostic marker. Biometrics, 56(2), 337-344 Heiberger, R. M., & Robbins, N. B. (2014). Design of diverging stacked bar charts for likert scales and other applications. Journal of Statistical Software, 57(5) ,
1–32. https://doi.org/10.18637/jss.v057.i05
Indrayan, A. (2012). Medical biostatistics. CRC Press, 400.
Jabbar, M. A., Deekshatulu, B. L., & Chandra, P. (2013) . Heart disease classification using nearest neighbor classifier with feature subset selection. Anale. Seria Informatica, 11.
Jia, S., Hu, X., & Sun, L. (2013). The Comparison between Random Forest and Support Vector Machine Algorithm for Predicting β-Hairpin Motifs in Proteins. Engineering, 5(10), 391.
Kanchanaraksa, S. (2009). Evaluation of diagnostic and screening tests: validity and reliability. Baltimore: John Hopkins University.
Karatzoglou, A. (2006). Kernel Methods Software , Algorithms and Applications Dissertation Zur Erlangung des akademischen Grades an der Technischen
PTTA
PERPUS
TAKAAN
TUNKU
TUN
AMI
NAH
49 Kavzoglu, T., & Colkesen, I. (2009). A kernel functions analysis for support vector
machines for land cover classification. International Journal of Applied Earth
Observation and Geoinformation, 11(5), 352-359.
Kuhn, M. (2008), “Building predictive models in R using the caret package, ” Journal of Statistical Software,
(http://www.jstatsoft.org/article/view/v028i05/v28i05.pdf).
L. Breiman. Bagging predictors. Machine Learning, 24 (2):123–140, 1996. 18
L. Breiman. Manual on setting up, using, and understanding random forests v3.1, 2002. http://oz.berkeley.edu/users/breiman/
Using_random_forests_V3.1.pdf. 18, 19
L. Breiman, “Random Forests,” Machine Learning, Vol. 45, 2001, pp. 5-32. http://dx.doi.org/10.1023/A:1010933404324
Likert R (1932). “A Technique for the Measurement of Attitudes.” Archives of Psychology, 22(140), 1–55.
Maindonald, J. H. (2008). Using R for Data Analysis and Graphics Introduction Code and Commentary. Australian Journal of Zoology, 22(January), 1–99. https://doi.org/10.1002/hbm.20951
Malhotra, R. K., & Indrayan, A. (2010). A simple nomogram for sample size for
estimating sensitivity and specificity of medical tests. Indian journal of
ophthalmology, 58(6), 519.
Mountrakis, G., Im, J., & Ogole, C. (2011). Support vector machines in remote
sensing: A review. ISPRS Journal of Photogrammetry and Remote Sensing, 66(3),
247- 259.
Ogunlana, S. O., Olabode, O., Olwadare, S. A. A., & Iwasokun, G. B. (2015). Fish
Classification Using Support Vector Machine. African Journal of Computing & ICT,
8(2), 75-82.
Pepe, M. S. (2000). Receiver operating characteristic methodology. Journal of the American Statistical Association, 95(449), 308-311
PTTA
PERPUS
TAKAAN
TUNKU
TUN
AMI
NAH
50 Sutton, O. (2012). Introduction to k nearest neighbour classification and condensed nearest neighbour data reduction. University lectures, University of Leicester.