Mining as Support for Economic Decision
Systems
This Thesis is submitted for the degree of
Doctor of Philosophy
ELENI ROZAKI
April 2019
Cardiff University
The evolution from wired voice communications to wireless and cloud computing services has led to the rapid growth of wireless communication companies attempting to meet consumer needs. While these companies have generally been able to achieve quality of service (QoS) high enough to meet most consumer demands, the recent growth in data hungry services in addition to wireless voice communication, has placed significant stress on the infrastructure and begun to translate into increased QoS issues. As a result, wireless providers are finding difficulty to meet demand and dealing with an overwhelming volume of mobile data. Many telecommunication service providers have turned to data analytics techniques to discover hidden insights for fraud detection, customer churn detection and credit risk analysis. However, most are ill-equipped to prioritise expansion decisions and optimise network faults and costs to ensure customer satisfaction and optimal profitability. The contribution of this thesis in the decision-making process is significant as it initially proposes a network optimisation scheme using data mining algorithms to develop a monitoring framework capable of troubleshooting network faults while optimising costs based on financial evaluations. All the data mining experiments contribute to the development of a super –framework that has been tested using real-data to demonstrate that data mining techniques play a crucial role in the prediction of network optimisation actions. Finally, the insights extracted from the super-framework demonstrate that machine learning mechanisms can draw out promising solutions for network optimisation decisions, customer segmentation, customers churn prediction and also in revenue management. The outputs of the thesis seek to help wireless providers to determine the QoS factors that should be addressed for an efficient network optimisation plan and also presents the academic contribution of this research.
Firstly, I would like to express my appreciation to my supervisor Professor Stuart Allen for his continuous guidance, motivation and constant feedback.
Secondly, I would like to thank Cormac Dullaghan for contributing to this thesis with his knowledge and expertise from the telecommunication industry. Cormac also provided us with the opportunity to access essential information for our research. This is greatly appreciated.
Finally, I would like to also say thank you to Pauline Kildunne who provided insight and expertise in R programming language that greatly assisted the final part of this thesis.
Table of Contents
ABSTRACT ... vi
List of Figures ... xiv
List of Tables ... xv
PART 1 ... xxi
Chapter 1. Introduction ... 1
1.1 Purpose of the study ... 4
1.2 Scope and structure of the thesis ... 6
1.3 Significance and contribution ... 8
Chapter 2. Background ... 13
2.1 Automated Defect Management ... 16
2.2 Fault diagnosis in cellular networks ... 18
2.3 Performance of mobile networks ... 19
2.4 Resource optimisation ... 21
2.5 Financial analysis ... 23
2.6 Cost optimisation ... 24
Chapter 3. Network Performance Measure ... 27
3.1 Key Performance Indicators ... 27
3.1.1 Measurement techniques for fault diagnosis using KPI ... 30
3.2 Proposed approach: Characteristics of optimal solution ... 36
3.3 Correlation of Key Performance Indicators and faults ... 37
3.4 Applied Statistics for fault diagnosis ... 38
3.5 Define Null Hypothesis (H0) and Alternate Hypothesis (H1) for KPI Values ... 40
3.5.1. Defining the levels/limits of the KPI false alarms. ... 42
3.5.2 Two-Tailed Test of KPI False Alarms Population Proportion ... 44
3.5.3 Null hypothesis and an alternative hypothesis of the optimisation decisions ... 45
3.6 Applying alarm correlation techniques in mobile data ... 45
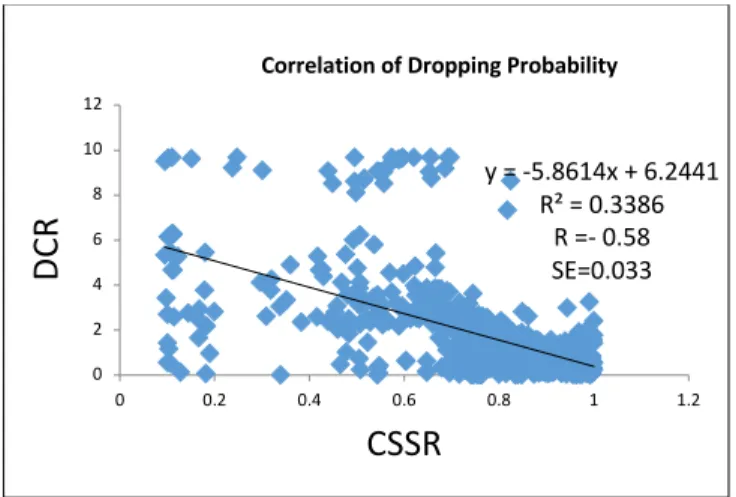
3.6.1 CSSR-DCR Correlation ... 46
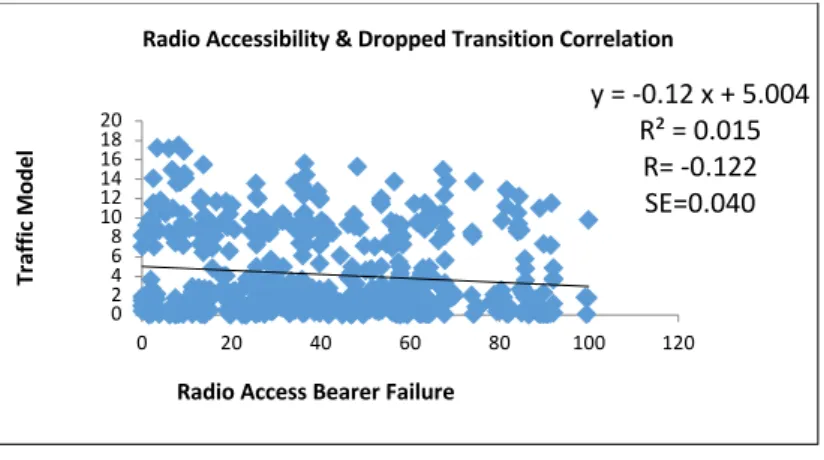
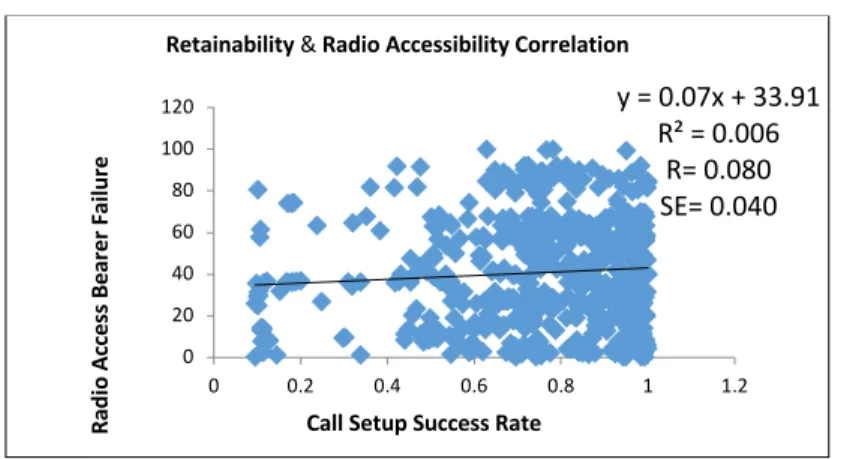
3.6.2. Radio Accessibility & Dropped Transition Correlation RAB_FR - TM ... 49
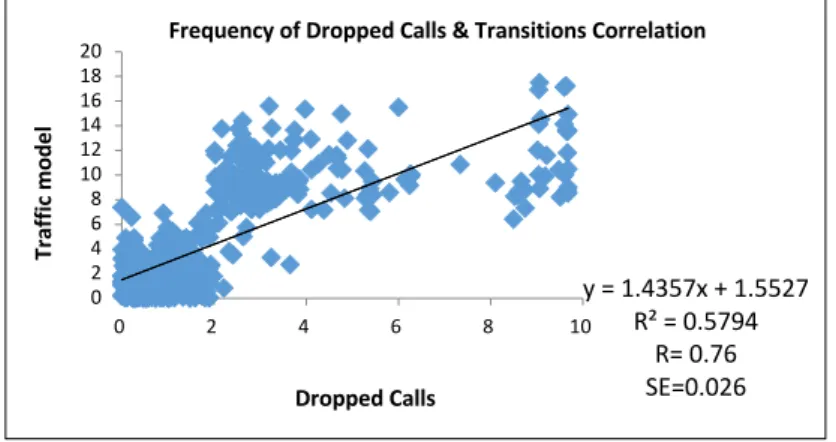
3.6.3 Frequency of Dropped Calls & Transitions Correlation (DCR -TM) ... 50
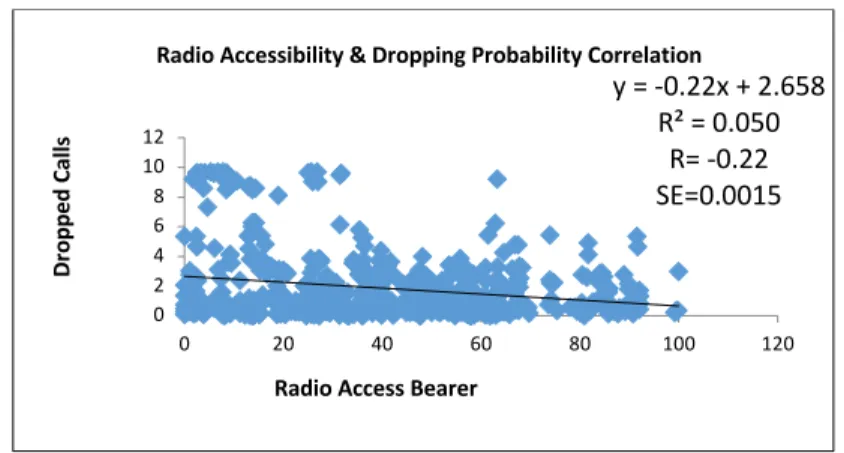
3.6.4 RAB and DCR Correlation ... 52
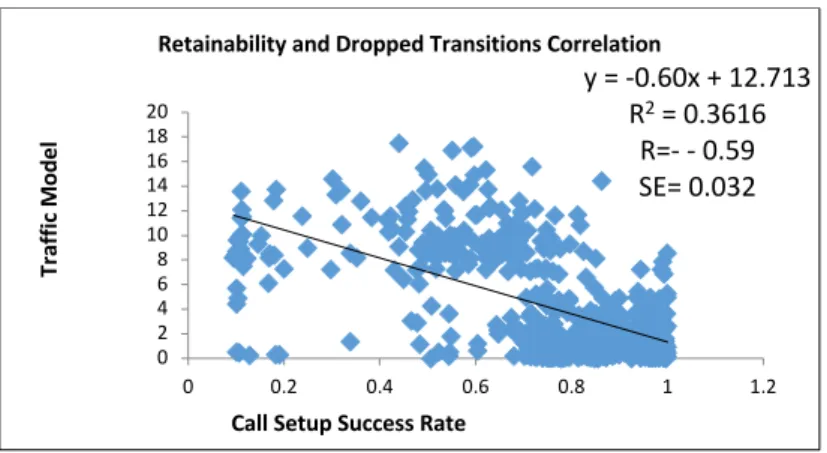
3.6.5 Retainability and Dropped Transitions Correlation (TM & CSSR) ... 54
3.9 Summary ... 60
Chapter 4. Automated Network Troubleshooting Using Data Mining Techniques ... 63
4.1 Background of network troubleshooting system ... 65
4.2 A Proposed troubleshooting management framework ... 67
4.3 Multi-label classification algorithms ... 69
4.4 Decision Tree and Decision Rules Algorithms ... 70
4.4.1 J48 tree ... 71 4.4.2 JRip ... 71 4.4.3 PART ... 72 4.4.4 Bayes Networks ... 72 4.4.5 Naïve Bayes ... 73 4.4.6 K-Mean Clustering ... 73
4.5 Preparation of input data ... 74
Radio Access Indicators ... 75
Traffic Channel Indicators ... 76
Standalone Dedicated Control Channel ... 76
Handover Indicators ... 77
4.5.1 Preparation of target variable ... 77
4.5.2 Network fault classification algorithm ... 80
4.5.3 Rule sets extracted as an output from the classification models: ... 82
4.5.4 Fault diagnosis using clustering techniques ... 88
4.5.5 Fault localisation evaluation based on Bayesian Networks ... 92
4.6 Fault diagnosis results discussion ... 93
4.7 Experimental results using k-means clustering techniques ... 96
4.8 Summary ... 99
PART 2 ... 101
Chapter 5. Network Cost Modelling ... 102
5.1 Cost optimisation ... 105
5.1.1 Cost causation in telecommunication networks ... 106
5.1.2 Cost analysis in multiple classes of KPIs ... 107
5.2 Design cost and performance optimisation algorithm ... 110
5.3 Estimating alarm costs ... 117
5.4 Cost sensitive classification results using Bayes & J48 ... 119
5.5 Artificial Neural Networks for Optimising Decisions ... 124
PART 3 ... 136
Chapter 6. Customer Profile and Revenue Management ... 137
6.1 Customer segmentation and pricing strategy in telecommunication industry ... 138
6.2 Ground truth data for the segmentation model ... 141
6.2.1 Customer Demographic Profiles ... 143
6.2.2 Customer Account Information about Bills and Payments ... 145
6.2.3 Total Invoice Amount Excluding Brought Forward ... 145
6.2.4 Total Number of invoices ... 146
6.2.5 Average Invoice Amount Excluding Brought Forward ... 146
6.2.6 Total Paid Amount of invoices ... 146
6.3 Billing behaviour classification rules ... 147
6.4 Ground truth ... 148
6.5 Classification of customers segments ... 150
6.5.1 User identification based on classification rules ... 151
6.6 Experiment 1: customer segmentation using decision tree classification rules ... 153
6.7. Experiment 2: Bayesian modelling of customer profiles ... 156
6.8 Performance evaluation results ... 159
6.9 Summary ... 161
Chapter 7. Improving end to end Optimisation Decisions ... 163
7.1. A model for end to end network optimisation ... 166
7.1.1 Input variables used for classification ... 167
7.2 Pre-processing Stage. The use of the learning algorithm to set up the priority rules. 168 7.3 Identifying customers’ requirements for prioritization ... 171
7.3.1 Priority scheme based on clustering techniques ... 173
7.4 Priority parameters using neural networks ... 176
7.5. Ensemble learning algorithms as support for end to end optimisation decisions ... 179
7.6. Multi –Label super learners. Methodological approach and design ... 181
7.7 Base Learners Using H20 Libraries ... 183
7.7.1 Gradient Boost Machine (GBM) ... 184
7.7.2 Boruta Algorithm ... 186
7.7.3 Distributed Random Forest (DRF) ... 188
7.7.4 General Linear model ... 189
7.7.5 Deep Learning Model ... 191
7.8 Super Learner Performance ... 195
8.1 Recommendations ... 205 8.2 Future Work ... 207 References ... 212 Appendix 2 - Run information in Weka ... A-1 Appendix 3 ... A-23
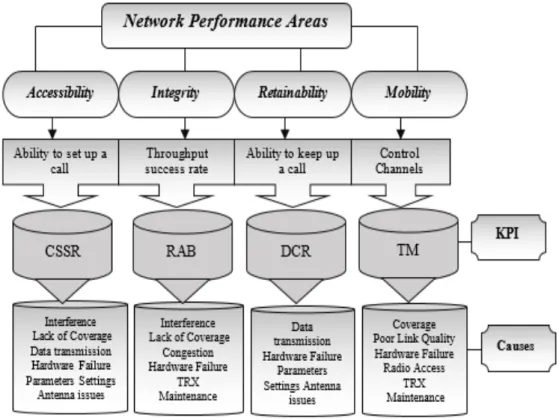
FIGURE 3.1 - DIRECT DEPENDENCIES OF KPIS AND CAUSES (SOURCE: ROZAKI 2016, P. 24) 31
FIGURE 3.2 KPI ALARMS CORRELATION MATRIX 39
FIGURE 3.3- CSSR-DCR CORRELATION GRAPH 46
FIGURE 3.4. RAB - TM CORRELATION 49
FIGURE 3.5. DCR- TM CORRELATION 50
FIGURE 3.6 . RAB & DCR CORRELATION 52
FIGURE 3.7- TM & CSSR CORRELATION GRAPH 54
FIGURE 3.8 - CSSR & RAB_FR CORRELATION GRAPH 55
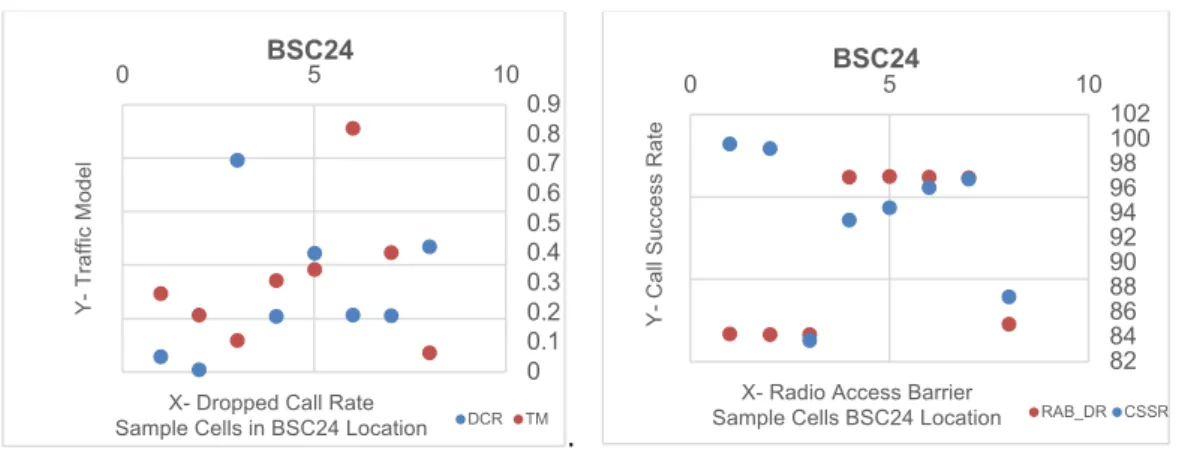
FIGURE 3.9 – KPI ALARMS CORRELATION IN BSC24 LOCATION 57
FIGURE 3.10 – KPI ALARMS IN BSC35 LOCATION 58
FIGURE 3.11 – KPI ALARMS IN BSC62 LOCATION 59
FIGURE 3.12 – KPI ALARMS IN BSC65 LOCATION 60
FIGURE 4.1 TROUBLESHOOTING MANAGEMENT USING DATA MINING 67
FIGURE 4.2 OPTIMISATION DECISION TREE 87
FIGURE 5.1 BAYES & J48 CONFUSION METRICS 124
FIGURE 5.2 MLP OUTPUTS FOR THE FINAL COST OPTIMISATION MODEL 126
FIGURE 5.3 MULTIPLE KPIS OUTPUT WEIGHTS 133
FIGURE 6.1 CUSTOMER SEGMENTATION DECISION RULES 154
FIGURE 6.2 MODELS EVALUATION 160
FIGURE 7.1 END TO END OPTIMISATION FRAMEWORK 163
FIGURE 7.2. DATA MODEL RELATIONS 168
FIGURE 7.3. THRESHOLD OF PRIORITY PARAMETERS 178
TABLE 4.1 NETWORK DATA MODEL 74 TABLE 4.2. INPUT DATA-RAW DATA AND KEY PERFORMANCE INDICATOR ABBREVIATIONS 75
TABLE 4.3 KPI METRICS AND ALARMS CONDITIONS 78
TABLE 4.4 DATA MODEL WITH INPUT TRAINING DATA 80
TABLE 4.5 OUTPUTS OF JRP ALGORITHM 83
TABLE 4.6 OUTPUTS OF PART ALGORITHM 84
TABLE 4.7 FAULT LOCALISATION 92
TABLE 4.8 PERFORMANCE MEASURE RESULTS 94
TABLE 4.9 COMPARISON OF FINAL STATISTICS WEIGHTED AVERAGE 95
TABLE 4.10 EXPERIMENTAL RESULTS OF K-MEANS 98
TABLE 5.1 NETWORK DATA MODEL 111
TABLE 5.2 INPUT TRAINING DATA 112
TABLE 5.3. NETWORK COST MATRIX 118
TABLE 5.4 META COST SENSITIVE CLASSIFIERS NAÏVE BAYES RESULTS 121
TABLE 5.5 ACCURACY BY CLASS 122
TABLE 5.6 META COST SENSITIVE CLASSIFIERS J48 RESULTS 123
TABLE 5.7 MPL CLASSIFIER RESULTS 130
TABLE 5.8 MLP RESULTS OF THE COST MATRIX 131
TABLE 5.9 EXPERIMENTAL RESULTS ON COST-SENSITIVE METHODS 132
TABLE 6.1 ID MOBILE IRELAND CUSTOMERS DATA 142
TABLE 6.2 MOBILE CUSTOMERS AGE GROUPS 143
TABLE 6.3 DAY/TIME OF MOBILE SERVICE SALES 144
TABLE 6.4 SPENDER STATUS 147
TABLE 6.5 NAÏVE BAYESIAN RESULTS 156
TABLE 6.6. ACCURACY BY CLASS 157
TABLE 6.7. CONFUSION MATRIX TABLE 157
TABLE 7.4 .PRIORITY SCHEME USING CLUSTERING TECHNIQUES 174
TABLE 7.5 VARIABLE IMPORTANCE FOR GBM MODEL 185
TABLE 7.6 VARIABLE IMPORTANCE FOR RANDOM FOREST 188
TABLE 7.7 VARIABLE IMPORTANCE FOR GLM MODEL 190
TABLE 7.8 VARIABLE IMPORTANCE FOR DEEP LEARNING MODEL 192
TABLE 7.9 BASE LEARNERS RESULTS 198
TABLE 7.10 STACKED MODELS RESULTS 199
ANNs Artificial Neural Networks
Arff Attribute-Relation File Format
CDR Call Drop Rate
CSSR Call Setup Success Rate
CN Core Network
GSM Global System for Mobile Communications
HOF Handover Failures
HSR Handover Success Rate
HSUPA High Speed Uplink Packet Access
ID3 Iterative Dichotomiser 3
IMT-2000 International Mobile Telecommunications-2000
ITU International Telecommunication Union
KPI Key Performance Indicator
LTE Long Term Evolution
MANETs Mobile ad hoc networks
MAP Mobile Application Part
MOA Massive Online Analysis
MLP Multilayer perceptron
QoS Quality of Service
RAB_FR Radio Access bearer failure radio
RAN Radio Access Network
RBF Radial Basis Function
RF Radio Frequency
RIPPER Produce Error Reduction
ROC Receiver Operating Curve
RRM Radio Resource Management
SDCHAR Standalone Dedicated Control Channel Access Rate
SDCCHCR Standalone Dedicated Control Channel Congestion Rate
SDCCHDropsExcessiveTA Standalone Dedicated Control Channel Drops due to Excessive Timing Advance
SDCCHCRSuddLostCon Standalone Dedicated Control Channel Suddenly lost connection
SIF Signal Information Field
SIM Subscriber Identity Module
SIO Service Information Octets
TCH Traffic Channel
TD-CDMA Time Division CDMA
UMTS Universal Mobile Telecommunications System
UTRAN UMTS Terrestrial Radio Access Network
TR Traffic Rate
TCH Traffic Channel
W-CDMA Wideband CDMA
Weka Waikato Environment for Knowledge Analysis
GLM Generalized Linear Model
DRF Distributed Random Forest
Part 1 of this thesis includes Chapter 1 that gives an overview of the research and Chapter 2 that discuss similar research on the challenge of fault diagnosis in cellular networks associated with cost optinisation and revenue analysis. Chapter 3 provides an overview of common Key Performance Indicators (KPIs) and the direct dependencies between the causes and symptoms of network faults using alarm correlation, which can be considered the first step in the diagnosis of faults and alarms. Chapter 4 describes our proposed approach to automated troubleshooting and network fault diagnosis using data mining classifiers and clustering algorithms.
Chapter 1. Introduction
Big data management technologies and analytics will revolutionize the systems and processes that companies use to obtain value from their data. Moreover, challenges in optimisation processes will continue to arise as more relevant data may be integrated with the use of 5G, IoT as a system that connects smart devices, people or animals, objects and digital machines, cloud computing technologies and other emerging network applications that offer better data collection, storage and delivery mechanisms and drive the network optimisation methods to be more flexible and dynamic. (Gupta et al 2019) The explosion in demand for smartphones, tablets and other Internet-enabled portable devices, and subsequent growth of mobile Internet services is placing increasing pressure on mobile operators and networks. Recent statistics from the OECD (Organisation for Economic Co-operation and Development) broadband portal show that high-speed mobile Internet subscriptions grew by 7.7 million, or 7.6%, in the 12 months leading to June 2017, taking mobile broadband penetration to over 100% in the OECD area for the first time. As of end December 2018, there were 1.484 billion mobile broadband subscriptions out of a total OECD population of 1.352 billion. “Mobile broadband penetration is highest in Japan, Finland, Estonia, the United States and Denmark, with subscriptions per 100 inhabitants at 172%, 157%, 149%, 144% and 136% respectively.
Overall, fixed broadband subscriptions in OECD countries totalled 418 million as of December 2018, up from 406 million a year earlier and averaged 30.9 subscriptions per 100 inhabitants. Switzerland still leads the pack with a penetration rate of 46.8 subscriptions per 100 people, followed by Denmark (43.3%), France (43.3%), The Netherlands (43%) andNorway (41.5%)” (OECD 2018).
One of the most noticeable effects of this growth in network demand is an increase in technical quality of service (QoS) issues. One well-known example is network congestion, which occurs when user demand outstrips the assigned network capacity (Rodrigues et al., 2009). Capacity in networks is assigned by radio resource management (RRM) algorithms and requires sufficient infrastructure to deal with average demand. RRM is designed to be flexible in its performance and applicable to various user cases through the use of Radio Frequency (RF) profiles. However, the operation of RRM algorithms is applied to network usage, monitoring and network configuration data while data analytics algorithms may be able to connect and handle additional data such as network costs and customers’ preferences and willingness to pay. Thus, data analytics techniques can improve the mobile network performance and also maximize the revenue of the telecommunication operators. (He et al. 2016).
There is a limit to the number of radios that can operate for a given infrastructure and with many new portable devices entering the market, exceeding an RF designs capacity is becoming much more common (Cisco 2016). Furthermore, if average demand is significantly exceeded over a short period for some reason (such as daily changes in utilisation patterns or an increase in mobile data usage due to temporary events), QoS can be compromised, leading to service outage or degradation.
Network congestion is highly noticeable to users, particularly users of quality-sensitive applications such as voice or video calls.
Congestion control algorithms, which continuously monitor networks for signs of congestion are commonly used in mobile telecommunications systems, but they do not work perfectly as they can only manage the resources that they have to work with (Rodrigues et al., 2009), (Cisco 2016).
Thus, a major impact of increasing mobile cellular use (including mobile data) is network congestion and its consequences.
The design process for mobile network upgrades and implementation is ordinarily a complex and long operation for engineers with hardware infrastructure and mobile operations. While more efficient technologies may become available (e.g., LTE, 5G, IoT), congestion control mechanisms cannot make up for the deficiencies in network planning and resource optimisation in reducing congestion on mobile networks. There are many issues that delay network planning and resource optimisation deployment such as the need to develop and support a maximum network bandwidth, define the use of new bands, design and produce infrastructure equipment, install new equipment at cell sites, deal with traffic and interference that may arise with neighboring bands. Consequently, making the network design process time-efficient is non-trivial, and there is an opportunity for planning/troubleshooting tools and algorithms to significantly increase network performance, operation and maintenance costs (Katsha & Ramli 2016).
In this thesis, experimental research has been conducted on the role that data analytics can play in network troubleshooting considering costs and revenue optimisation decisions. Integrating the latest advances that employ data mining techniques applied in networks’ data including costs’ considerations and customers’ demographics might be the best way to build robust optimisation frameworks for managing network performance while conducting intelligent customer profiling and segmentation.
1.1 Purpose of the study
The volume of low-level optimisation data produced from cellular network infrastructure, and smartphones/tablets themselves, is growing at an exponential level. The data analytics techniques proposed in this thesis are demonstrated using real data from iD Ireland’s datasets, and contribute to the use of advanced data mining methods to uncover hidden patterns, unknown correlations, financial trends, telecommunication customer profiles and other useful business and technical information from our data sets.
The contribution of iD Mobile Ireland in providing data is very important to support the experimental work in revenue management performed in this thesis. They are a start-up telecommunications provider in the Republic of Ireland, which differentiates itself in the competitive Irish market by separating the mobile tariff from the handset. This allows customers the flexibility to enter or leave a 12, 18 or 24- month contract without penalty, and to purchase a new handset every three months (should they wish to do so) once the previous handset cost is fully paid off.
The company has access to a wide range of data, with prospects to capture even more growing at a rapid rate. The data that the company canaccess are currently not being used to their full potential as a means of understanding the customers that are served, their sale patterns, potential fraud risks, churn patterns and revenue management issues (C.Dullaghan & E.Rozaki 2017).Furthermore, the EU General Data Protection Regulation (GDPR), set to come into force in May 2018, may provide obligatory guidance to reach a fair deal between the interests of mobile providers and mobile users (Wachter, 2018).
The customers’ data used for this thesis are anonymised as personal data are encrypted and mobile customers’ identifiable information was removed from the iD mobile Irelands’ data sets. Hence, GDPR implementation is not required for anonymous data (Štarchoň , Pikulík 2019).
Network optimisation is the process of configuring infrastructure and allocating resources to improve performance, evaluated through technical measures (for example, traffic rates) and financial metrics (for example, the cost of required hardware or software). In this thesis, the problem of fault detection in cellular networks was taken in consideration which aims to utilize KPIs to identify and repair/upgrade anomalous cells while minimizing downtime. As such, the optimisation problem was consider to define rules that, given a stream of network performance KPIs, are capable of identifying faults and malfunctions, leading to improved traffic handling capability.
In contrast with many existing studies, this thesis considers not just the technical concerns of implementing recommendations, but also the costs and revenues that real-world network operators and service providers must face as they compete in a saturated market with rapidly growing bandwidth demands. The findings show that using data mining and business analytics techniques can lead to more effective network optimisation decisions, new revenue opportunities, dynamic customer profiling, improved operational efficiency and churn prediction and prevention.
1.2 Scope and structure of the thesis
The research is arranged into three broad parts, structured as follows. The scope of Part 1 that includes chapters 1, 2, 3 and 4 is limited to technical resource management and implementation of technical optimisation mechanisms, including the relevant aspects of network planning and resource optimisation using data mining techniques. It explores the use of data mining models and algorithms concerning the causes and symptoms of network faults as a means of automating defect management. It concludes with a summary of recommendations based on the network optimisation and resource management outcomes. The goal is also to find and cluster relations between the several sets of key performance indicators (symptoms) and additional variables (attributes) to discover the causes that affect the optimisation procedure.
In Part 2, that contains chapter 5, the scope of the research widens to also consider financial evaluation. This section includes a comprehensive financial analysis of the network optimisation approach as defined above, as well as addressing the issue of costs associated with remedying the network faults presented in Part 1. This section is related to the cost and revenue considerations using meta cost classifiers to raise the accuracy of the results. Part 2 also discuss meta -cost classifiers running with Bayesian and decision trees algorithms, together with the previous work of network fault detection using key performance indicators. Bayesian networks are used to show the cost probability of the distribution of alarms and the cost sensitive meta-learning classification rules using C.5 algorithms and finally neural networks to determine the minimum network cost conditions, bandwidth costs and benefits that are possible with network optimisation.
Finally, in Part 3 that includes chapter 6, 7 and 8 the scope of the research widens still further to integrate an end to end analytics framework for decision making. The aggregation of available information about clients, their demographics, service use and network cost enables the prioritisation of location-based network optimisaiton actions, thus enabling to maintain the required end to end quality of services. Furthermore, the availability of location-based information facilitates data-driven management decisions as well as reactions to client-data in the appropriate time using the right deal, which will be offered to the proper target market. The focus in this part is also on revenue management, and in particular identifying consumers’ preferences.
The concern in this section is not merely the revenue analysis itself, but also comparing the performance of revenue optimisation to cost optimisation using business analytics modelling and making recommendations to providers about network predictive modelling.
The last part of the thesis will combine a library of different algorithms that provides the ability to enhance performance, as well as to create the best combination of algorithms to improve the performance of a network framework and define an efficient end to end optimisation super framework. A stacked learner model utilised which was run using V-fold cross-validation in order to create the optimal weighted combination of predictions from a selected library of algorithms to avoid over-fitting. Finally, the last step was to compare ensemble methods to combine multiple base learners, including general linear models, gradient boost model, random forest, and deep learning.
1.3 Significance and contribution
The aim of this thesis is to demonstrate a working system that will be able to assist engineers in the decision-making process for optimising an existing mobile communications network based on network faults, cost considerations and customers’ needs and willingness to pay. Although the technical work will assume a UMTS (Universal Mobile Telecommunications System) network, it would be straightforward to apply the findings to LTE networks due to significant overlaps and technical complementarities. The question of optimisation is designed to take on a number of different dimensions, including resource availability and allocation, cost management, and revenue management.
This holistic approach will allow companies using the optimisation model generated in this research to select the level of involvement required, as well as clearly demonstrating the importance of interplay between the technical and cost objectives of optimisation.
The main contributions that will allow for the accomplishment of this aim are:
I. Establishing an automated defect management framework using data mining methods, which will enable telecommunication network operators to engage in more accurate and rapid network planning and resource optimisation. This will also include automated network optimisation processes, derived from the KPI alarm classification and localisation processes. The elements generated during completion of this objective will include technical models and specifications based on decision trees, rules, and Bayesian network and Clustering algorithms intended to implement the suggested optimisation solutions.
II. Establishing a cost sensitive neural network classification model intended to define cost optimisation and budgeting, address annual budgeting and planning efforts, provide support for management planning processes, and allow for the production of pricing and valuation information for customers’ profiles. This model will balance costs of service provision and new investments with expected revenues using neural network models.
III. Establishing a cost optimisation model using data mining modelling. These revenue management algorithms define an appropriate technique for valuation of fault detection and budgeting to improve the overall quality of services, especially for customers who are willing to pay more for a higher quality of services.
Generating recommendations for customer segmentation, technical and cost management optimisation for use in existing networks, in order to assist in the optimisation of existing resources for network carriers.
IV. Propose an end to end optimisation super- framework capable of reducing network performance costs while improving the customer experience. The results showed the most efficient data mining methods for each purpose and the optimal combinations of the most important variables of our datasets. Several data mining algorithms tested individually, or as base learners combined with the super leader and cost learner models that gave a superior performance to predict revenue decisions, define customer’s priorities, provide support for revenue management planning processes, and allow for the production of pricing and valuation information for customers. In addition, an important contribution of this part of the thesis is that the multi- class classification models that has been proposed that ads to the existing academic literature, which is limited regarding the relation to the multinomial classifiers based on cost learners and super learners.
Published contributions: Journals:
C. Dullaghan, E. Rozaki, “Integration of Machine Learning Techniques to Evaluate Dynamic Customer Segmentation Analysis for Mobile Customers” International Journal of Data Mining & Knowledge Management Process (IJDKP) Vol. 7 No 1, 2017.
doi: 10.5121/ijdkp.2017.7102
E. Rozaki, "Financial Predictions Using Cost Sensitive Neural Networks for Multi-Class Learning", Advanced Engineering Forum, Vol. 16, pp. 104-116, 2016.
doi:10.4028/www.scientific.net/AEF.16.104
E. Rozaki, "Design and Implementation for Automated Network Troubleshooting Using Data Mining", International Journal of Data Mining & Knowledge Management Process (IJDKP). Volume 5 pp.9-27, 2015. doi:10.5121/ijdkp.2015.5302
E. Rozaki, "Clustering optimisation techniques in mobile networks", International Journal on Recent and Innovation Trends in Computing and Communication (IJRITCC). Volume 4, 2, 22 – 29, 2016.
Conferences:
E. Rozaki, “Network Fault Diagnosis Using Data Mining Classifiers”, Third International Conference on Database and Data Mining, pp 29 40, 2015. doi:10.5121/csit.2015.50703
E. Rozaki, “Automated Network Optimization Using Data Mining Techniques”, ICSPDM International Conference on Signal Processing and Data Mining (ICSPDM) 2017 in Rome.
E. Rozaki, “Data mining modeling and cost sensitive analysis for network faults”, ICSPDM International Conference on Signal Processing and Data Mining (ICSPDM) 2017 in Rome.
E. Rozaki, “Business analytics applications in budget modelling to improve network performance”, 4th International Conference on Big Data Analysis and Data Mining September 07-08, 2017 Paris, France doi: 10.4172/2324-9307-C1-014
Chapter 2. Background
This chapter explores the existing literature on fault diagnosis and network troubleshooting in cellular networks, an area which includes network fault detection, diagnosis of network malfunctions and solving the problems that arise from network troubleshooting. The aim of this chapter is to examine the optimisation costs and end to end quality of services in mobile networks.
The mobile telecommunication industry is changing rapidly driven mainly by revolutionizing network technologies, evolving state of the art solutions and services and increasingly composite consumer demands. Thus, there is a need for generating new business models, requiring the network providers to be continuously updated. Economic pressures mean that operators need to decrease service costs while increasing the value to the consumer in order to remain competitive. At the same time, new technologies, social networking and mobile services are becoming increasingly more important and available to a wide base of customers. Consumers today require access to multimedia applications as their main entertainment is fostered by mobile communications and social media networks (Kryftis Y. et al. 2016). Consequently, the telecommunications industry is heading rapidly towards a model of heterogeneous wireless access to networks, with an increasing number of users who want high value services, but reduced costs, and ever-increasing numbers of applications that have high bandwidth requirements.
Maintaining mobile networks can be a particular challenge, particularly the process of detecting, interpreting and rectifying defects. Malfunctions, hardware and software failures can be exposed through a range of different symptoms, such as dropped calls, access failures, congestion or an excessive number of interference handovers, and can be located in any part of the network. The task of locating the root cause of defects can be very difficult since they can be located in any part of the distributed network . Poorly performing cells might not be immediately obvious from performance metrics. Tracking using support ticket systems can be difficult and time consuming in a situation where time is of the essence. Defects must be corrected before causing significant impact to users, because consumers who are dissatisfied with services might switch to a competitor (Lunn, Lyons 2018). Most defect management is related to finding and correcting difficulties in the radio access network which it resides between mobile devices, and provides connection with its core network (CN) therefore represents the largest part of the cellular system.
Barco, Díez, Wille, and Lázaro (2009) suggested that there are three primary steps to controlling defect management. The first is detection of defective cells that are defective, followed by determining or diagnosing why the malfunction occurred. The third step is to deploy a solution by planning and carrying out an action to correct the defect. Currently, these operations rely on the experience of skilled professionals. Increasing the quality of service by automating the process would decrease operational costs for the carriers and improve the value to end users.
The diagnosis step is the most complex part of defect management. There are currently very few automated approaches to diagnosing of Radio Accessibility Network (RAN) faults in cellular networks (Popoola et al., 2018a), (Popoola et al., 2018b) even though there is a great deal of interest in automating this step. However, similar automated processes have been used for diagnosis in other fields such as spine surgery (Han S.S., et al. 2019) or detecting defects in the core networks in communications networks (Musa 2016).
However, automated methods for detecting and diagnosing network faults are very early in the development process, time consuming, and contribute to increased customer dissatisfaction. (Widanapathirana et al. 2012). The fact that
automated fault detection methods do not exist is an important gap within both the practical and academic literature. The goal of this investigation is to provide an efficient and effective means by which the process of detecting and diagnosing network faults can be automated. Thus, our initial aim in this thesis is to investigate the causes that affect the optimisation procedures and then discover how to automate the process for detecting and diagnosing network faults using intelligent data mining methods.
A monitoring scheme for mobile networks should be based on optimisation issues to investigate the relationship between causes and symptoms. The most critical alarms which are indicators of network issues for mobile network providers may be cells experiencing a high rate of dropped calls that can create negative impact on the QoS offered to the end user. False alarms of high dropped call rate can be grouped such as interference, handover and coverage (Barco et al. 2006).
This approach represents an improvement since it identifies cause and effect in the relationship and assists in determining specific issues which may exist and be located through the process of troubleshooting (Barco, et al. 2006). The selection of traffic data, handovers, dropped calls and utilisation data to be analysed involves several considerations, such as which data are representative of the KPIs (symptoms), data availability (inputs), the attributes of the data, and establishing limits of the network anomaly detection, the generation of alarms and the correction of the network issues (Nor Haizan. et al., 2009), (Shahzad, Asad, & Khan, 2013).
2.1 Automated Defect Management
The core aspect of this research in terms of network planning and resource optimisation is defect management automation. Defects in a mobile network can be understood to be any condition that creates a transmission failure (Rahnema, 2008). However, in some cases, such as conditions of excessive congestion or physical equipment failure, there is a need to identify and correlate defects and reroute transmissions around problematic areas. (Rahnema, 2008).
The process of identifying and reacting to defects or alarms was studied in the early development of mobile networks. Wietgrefe et al. (1997) considered the specific case of a single failure in a GSM network, which they indicated could generate as many as 100 alarms in various parts of the network. They noted that it was not just noticing the alarms that is important, but also correlating these alarms to identify the underlying condition.
There are several issues that can be identified in the use of alarm correlation that will need to be explored in order for it to be used effectively in the current research. One issue is similarity, which can be used to determine the likelihood that multiple alarms correspond to a single event such as link failure. For instance, an alarm generated by a high drop calls rate which may be caused by overloaded traffic or inefficient traffic channels infrastructure, but may be also related with poor hardware equipment such as antennas or software upgrades. Yamashita et al. (2010), tackling the problem of online recommendations, discussed a similarity computational approach based on Pearson’s correlation coefficient and Particle Swarm Optimisation.
Okamoto et al. (2006) suggested a modification to the standard correlation process that approximated the relationship between null hypotheses rather than exactly calculating it, resulting in a substantial improvement in the computational performance of the correlation at the expense of a small amount of accuracy. A second approach also used the Neyman-Pearson framework to add stochastic resonance to differentiation equations (Bayram & Gezici, 2012). The remainder of this chapter is structured as follows: Section 2 outlines the main issues in fault diagnosis, and the significance of mobile network performance and resource optimisation in network troubleshooting. Then section 3 describes the importance of the End-to-End Network Optimisation techniques for providing quality in mobile services following by section 4 that discusses the financial analysis and a cost opimisation approach, and finally section 5 that presents how users revenue can influence network management decisions.
2.2 Fault diagnosis in cellular networks
Cusani, Inzerelli, and Valentini (2007) pointed out that the main problems arising in mobile networks is malfunction of cell elements leading to degradation of service. To identify these, network operators monitor Key Performance Indicators to trigger alarms, including the dropped call rate (DCR), Radio Access bearer failure (RAB_FR), that are channels that layer the data connections according to the type of data and facilitate the transfer data to the users or control network data, Call Set up Success Rate (CSSR), utilization of Handover Success (HS) that refers to the process of transferring an ongoing call or data from one channel to another in the mobile netwrok and finally the traffic model (TM), an indicator that measures the mobile netwrok traffic (Cusani et al., 2007; Seytnazarov, 2010).
Key performance indicators can be used to diagnose the cause of the problem in a cell. When a malfunction occurs, the KPIs in the cell change value, and an automated diagnosis system can analyse these variations to identify which cell or cells malfunctioned, and the cause of the malfunction. Due to the wide range of KPIs that are used by network operators, this thesis cannot provide an exhaustive classification.
The next important issue is the generation of alarms, as well as the relationship between the KPIs and alarms. Before discussing alarms, it is appropriate to briefly explain the difference between an alarm and a fault. An alarm is an indication of a problem or issue in a network. An alarm can be thought of as the outward symptom of a problem.
For instance, an alarm may be triggered by a KPI that shows a very high dropped call rate, such as DCR>=4. The Maximum Permissible Dropped Call Rates based on the Commission for Communications Regulation Ireland (Wireless Telegraphy -Liberalised Use and Preparatory Licences in the 800 MHz, 900 MHz and 1800 MHz bands) Regulations, 2012) .That KPI represents a symptom that could be caused by a high number of handovers due to interference (Barco et al. 2006). Although, the fault is the actual issue that needs to be corrected in order to restore a network to an optimised state of operation (Monacelli, & Francescangeli, 2011). Network operators typically generate alarms when the values of KPIs cross a pre-determined limit or threshold.
2.3 Performance of mobile networks
One of the specific challenges for mobile networks is the need to integrate capacity in existing networks, which provide the bulk of coverage outside high-demand urban areas (Rahnema, 2008). This is an issue that need to be dealt with because of the complexity of networks as well as consumer demands for service quality across a range of heterogeneous types of service, radio interface standards, and other complexities. Maximum capacity planning without compromising, quality of service is the basis for efficient network services, although routing and other issues also need to be considered. Clever spectrum reuse of the base stations location will be cost effective for users as well as for mobile operators. (Jha et al. 2017).
Although network capacity is clearly the core issue in network planning; it is not the only problem, given the structure and heterogeneous utilisation of mobile networks. Another issue that emerges in mobile network planning is cell performance (Beyer & Mao, 2012). Mobile networks can face QoS degradation from network congestion or attenuation or even service interruption, particularly if the network planning does not provide dense enough coverage for demand (Beyer & Mao, 2012). These types of problems are explored in more detail in Part I of the thesis, which addresses the various concerns of network optimisation of existing networks and identifies the network malfunctions that can arise.
There are a variety of approaches that can be used in network troubleshooting that includes fault detection, cause diagnosis and solution deployment. A statistical analysis approach can be used for network diagnosis and network management, which predicts many of the issues such as hardware or software failures caused by network congestion.
Ye and Fallah (2010) explored the application of KPIs to UMTS packet-switched networks in order to highlight the benefits of their statistical approach to capacity planning. They specifically considered UMTS, where packet switching is used to transfer data, including voice, video, music, and other data. The authors identified a service monitoring approach based on the IP network core, which they conceptualize as sitting between the packets being passed on the network between devices and nodes.
They then used statistical techniques including correlation, factor analysis, multidimensional scaling, correspondence analysis, and cluster analysis as a means of identifying issues such as hardware or software failures, technician issues in data flow and determining capacity gaps. One of these techniques, correlation, will be returned to in discussion of alarm correlation. Ye and Fallah (2010) identified a number of KPIs that could be used to track the performance of the network capacity. This is a useful approach that could be further leveraged to account for other resource needs, such as resource optimisation and defect management automation as discussed below.
2.4 Resource optimisation
In the widest sense, equipment in a network environment includes backbone or core network, base stations (which provide transmission and reception to the core network), and handsets or other user devices. By extension, the resources associated with this equipment generate transmission capacity, which can be understood in a number of different ways, such as usage time or transmission quality. In a situation where resources are unlimited, network planning is trivial, since it is possible to simply assume more resources can be made available to provide coverage.
However, there are few situations, if any, where resources can truly be said to be unlimited with no additional cost. Because of this, resource optimisation, or identification of the most efficient way to use individual resources and groups of resources, is required as part of the network planning process.
There are many different resources that could be optimised within the network in order to improve network efficiency. For example, Radio resources are targeted for optimisation in order to maximize QoS (Seytnazarov, 2010). A well-structured network requires less infrastructure and mainly fewer Base Station sites, hence more efficient use of radio resource, offering additional capacities under the same infrastructure. (Abrao 2012). Defect identification and management is also part of the process of resource optimisation. For instance, KPIs can be used to identify uplink performance issues that refers to the signal from mobile station (cellphone) to base station and RF failure. In their discussion of defect identification in mobile networks, Sánchez-González et al. (2008), used threshold levels for KPIs in order to identify potential RF failure conditions in the uplink. This approach can be used to identify issues, but not necessarily to automatically specify how to repair networks. This is one of the areas where the proposed research will build on existing solutions, not just by maximizing defect management, but also by optimising it in order to balance defect management and resource utilisation.
2.5 Financial analysis
Troubleshooting existing networks is not the only way to achieve improved utilisation. Analysis of costs suggests that there could be ways to improve the financial benefits from existing resources, such as determining what upgrades are cost-effective and how existing resources could be used more cost-effectively (Stevens, 2012). The use of cost analysis and cost optimisation is one of the approaches that will be used to understand how the technical optimisation approaches identified in Part 1 can be further supported. Alternative approaches that can be used to evaluate cost-benefit analysis are simulations (Asche et al. 2018) or Cost-Sensitive Analysis with the use of Time Series predictions (Walgampaya & Kantardzic 2016). Cost-sensitive techniques allow for a focus on achieving high accuracy of sample classification into a set of predefined classes while reducing misclassification costs that can arise when predicting the cost of rectifying network errors (Charles et al. 2008). A problem, however, is that many machine learning approaches are binary in nature. Moreover, cost-sensitive aspects and measures defined by classification algorithms have not been widely studied yet as frequently indicate low efficiency and issues with scalability when dealing with large-data sets. (Wang et al. 2012). In order to improve how they function and to allow for efficient cost sensitivity analysis for network fault detection, the algorithms need to be generalized to deal with costly network issues such as hardware replacement that have many solutions (Charnay, Lachiche, & Braud, 2013).
The initial goal for this investigation was to present a monitoring scheme for mobile networks using data mining classifiers to upgrade fault detection and handling. The purpose is to extract optimisation rules that improve anomaly detection and support a monitoring scheme that relies on data mining techniques for the purpose of fault isolation and cost estimation. The reason for this is because network technicians and administrators need to know on regular basis where faults are occurring on a regular basis so that they can determine where network malfunctions are occurring, as well as the cost of optimization actions required in a specific location in a given period of time.
2.6 Cost optimisation
Cost optimisation is part of a holistic approach to network resource allocation and capacity sizing applied at the network planning stages (Santoyo-Gomzalez & Cervello-Pastor 2018). Here, the expression of cost optimization is more general than financial analysis as it also refers to the telecommunication costs reduction such as traffic cost, infrastructure costs, transmission costs and maintenance cost. Different cost optimisation measures are required due to the increasing and conflicting demands of video and data applications, network saturation, and other concerns that mean that networks need to be managed effectively in order to ensure that capital expenditures are focused where they will be most effective (Liu et al. 2014). Chu et al. (2011) note that failures in network planning can result in operational network failures generated from natural disasters, human interference, or technical issues included in infrastructure costs.
However, not all network issues stem from total failure or lack of network survivability; instead, there is the issue of capacity management, or optimisation of system capacity in response to changes of demand and revenue of users that needs to be included in operations and maintenance costs.
As the authors point out, the NP-complete nature of network optimisation makes a complete solution to this problem highly difficult, particularly for complex or integrated networks. Furthermore, “full optimisation” can be risky because, when a network is optimised very tightly to achieve one goal, typically profit, it might be expensive to adapt the network to changing needs. Therefore, instead of trying to find optimal solutions, planning models should allow the user to understand a network’s behaviour and trade-offs better. This suggests that it is not necessarily ideal to simply focus on technical optimisation of the network, since this could make it difficult to address changing strategic priorities for a reliable cost benefit analysis (Liu et al., 2014). It is also likely that the use of strict technical optimisation will generate conditions that make the network financially inviable for the network operator, due to excessive demand for capital investment and operational monitoring (Chu et al., 2011).
Cost optimisation models used in previous network types such as 2G are not appropriate for use in 3G and beyond, since there are substantial differences between these networks, especially data reliability concerns. Chu et al. (2011) make a strong case for including cost optimisation, as well as technical optimisation, in network planning and resource allocation.
Findings of Chu et al.’s (2011) analysis of network planning and cost optimisation in mobile networks show that accounting for survivability concerns, link and node constraints at the network planning stage significantly reduces costs.
They also indicate that network planning is not a one-time activity but needs to be a constant focus as network demand increases to account for changing impacts on cost. This strongly suggests that there is value for network planning in considering cost optimisation as well as technical optimisation, to keep service provisions both ready to meet the demands of consumers and within the bounds of financial resources of the providing firm. (Santoyo-Gonzalez, Cervello -Pastor, 2018).
Methods for achieving network performance have traditionally been used by network administrators and technicians as a means of finding network faults returning networks to conditions of optimisation. Although, network planning was not considered as the datasets used for this thesis do not contain networking hardware data known also as network equipment data, the plan was to follow the same approach in continuous optimisation of existing networks while incorporating cost into optimisation methods that have not been widely used by managers as a means of approaching financial predictions. Thus, the multiclass cost-sensitive classification problem that aim to achieve cost efficient network improvement does require predicting cost optimisation rules with regards to fault detection. Financial performance in the process of broader network fault detection and optimisation is possible (Kim, J., etal. 2012).
Chapter 3. Network Performance Measure
This chapter summarises research techniques for modeling network faults that can be classified based on their cause or their type. However, the most convenient network anomaly classification method is based on location. The reason for this is because network technicians and administrators need to know where faults are occurring so that they can determine where malfunctions are occurring, as well as the number of faults that occur in a specific location in a given period of time (Deljac, Mostak & Stjepanovic, 2010). In this chapter of the thesis the main scope is using statistical methods for selecting, analysing and drawing meaningful interpretations in relation to the network data and key variables of the optimisation plan. The results of this part of the research demonstrated the need to extend to the machine learning techniques in order to make most accurate predictions on network performance management.
3.1 Key Performance Indicators
Network performance measurement is essential for providing efficient quality of mobile services. The KPIs used in this research for QoS of Global System for Mobile Communications (GSM) networks include Call Setup Success Rate (CSSR), Drop Call Rate (DCR), Stand-alone DedicatedChannel (SDCCH) congestion, and Traffic Channel (TCH) congestion. (Popoola et al. 2018) The first set address issues related to retainability and the probability that calls drop.
The call setup success rate (CSSR) which is the fraction of the successful call connections divided by the total number of the attempts to make a call and call drop rate (CDR) are two of the primary KPIs used by operators (Seytnazarov, 2010). The second KPI in this category, CDR, is the rate at which calls are dropped when moving between radio channels that facilitate the call transmission associated with a core network (Barco, Wille, & Diez, 2005).
An additional KPI metric which is important for identifying the network performance is the handover failures (HOF) or assignments that present the ratio of attempts/handovers that have failed divided by the total handovers, (Panda and Padhy, 2009).
The HOF KPI is associated with the mobility of the network that includes channels control and it is also related with the KPI of SDCCHSR (Stand-Alone Dedicated Control Channel Success Rate).The network mobility include also traffic channel drops measurements such as Call Traffic Rate (TR) and transition (TCH congestion Rate) assignments that are both successful and unsuccessful (Seytnazarov, 2010).The second set of KPIs are measures of utilization and accessibility, relating to the extent to which the network optimises cost quality (Cusani et al. 2007). Over-dimensioning increases costs because it reduces utilisation below capacity.
When this happens, the costs to the provider (and ultimately the consumer) increase. In the same fashion, under-dimensioning results in congestion across the network, service delays, increased dropped calls, and other issues. The number of channel groups, or group of frequencies within a specified connection in the core network must be sufficiently large to prevent these issues from occurring (Cusani et al., 2007). Both of these issues affect customer satisfaction and customer retention over a longer term than CSSR and CDR. The Traffic model is used as the base measurement for utilization. This measurement monitors the traffic channels of the network, the lower call transition frequency, the better the utilization (Cusani et al., 2007).
End-user services are categorized into four groups by the 3rd Generation Mobile System (3GPP) according to their traffic characteristics and QoS demands. Four corresponding traffic classes defined for Radio Access Bearers (RABs) that transfer calls and data between the user equipment and the Universal Terrestrial Radio Access Network (UTRAN) that connects mobile handsets to the public telephone network or the Internet.
RABs values given by Flood 1997 are optimised so that the end-user service group corresponding to the RAB class is supported)with the four RAB classes being conversational, streaming, interactive class, and background.
The conversational RAB class relates to the end-to-end user service and is typical of human-to-human interaction. A cell phone is the typical example of this class, in which the appropriate transfer delay relates to the human perception of video and audio conversations. The streaming RAB class relates to a continuous audio/video stream transferred to the end-user. In this case the appropriate transfer delay relates to the capability of the time alignment function in the client where buffers can compensate for minute delays in the delivery of packets. The interactive class is the most common type of end-to-end service and is utilized in the internet. Transfer delay is given by the request response pattern in these client-service type applications. The final class is the background class, in which the end-to-end user service runs in the background. Examples of this type of service include downloading in the background, and messaging. There is no requirement on transfer delay in this type of background communication (Flood, 1997).
3.1.1 Measurement techniques for fault diagnosis using KPI
A diagnosis model and a method of interference constitute an automated system for diagnosis.Selected sets of KPIs are defined to categorize the causes in groups. The relationship that is assumed between the cause of the malfunction and the observed system represents the diagnosis model based on the results of the KPIs. Therefore, the relations and interdependencies of the KPIs are selected, followed by an investigation using statistical techniques for testing the false hypothesis of our samples in the selected datasets.
To implement the diagnosis model, a two pronged hypothesis test of the causes in a mobile network is devised, consisting of the correlation of a certain number of symptoms that can be investigated. Figure 3.1 shows the direct dependencies between the variables, the causes, and the symptoms, and shows how they can be related to the data using the KPIs selected.
3.1.1.1. Accessibility
Call Success Rate
#$$% = '()*+, ./ 0122 $+3(4
'()*+, ./ 0122 133+)435∗ 100
is an important KPI parameter for telecommunication companies to evaluate their performance and optimise QoS (Hammed and Fatimah 2018). CSSR can be defined as the number of successful calls divided by the total number of call attempts. The value that is acceptable for the CSSR indicator that indicate the percentage of calls successfully established (set up) should be greater than 95%.
3.1.1.2. Integrity
Integrity generally refers to a phenomenon in which a service once obtained provides low impairments. Due to the increased need of accessibility and mobility in telecommunication networks, integrity is also an important KPI.
The RAB_FR (radio access bearer failure ratio), which is
%9:_<% = = '>?@ ABA− '>?@DE> '>?@ ABA F
related to radio channel accessibility, which is a function of the number of control attempts required, congestion, and traffic levels (Cusani et al., 2007), and defined as:
where '%9:
GHG is the number RAB setup attempts that failed; and '%9:GHG is the total
number of RAB setup attempts (Cusani et al., 2007).
A Radio Access Bearer determines the QoS allocated to an application. It also defines a set of allowed frame sizes and wasted bandwidth due to padding bits that can be added, if needed, in order to fill the remaining bits of the framework. The main purpose of the RAB indicator is to provide a segment of the network that contains a limited number of base stations.
For a given application it is necessary to adjust the RAB to its requirements (Perez-Costa, et al., 2004). Too small bandwidth might result in bad quality while too large allocation is a waste of resources.
3.1.1.3. Mobility
Location management keeps track of the mobile terminal while travelling from place to place and is an important factor in the overall resource management of the network (Sawson et al, 2007). Location updating and paging are the two important operations of location management and it is necessary to provide a trade-off between them in order to reduce total cost of hardware equipment. Moreover, an important factor to consider in mobility is the standalone dedicated control channel success rate (SDCCHSR) that shows the rate of successful signaling channel assignments divided by the number of call attempts.
In order to understand the effect of how the channels impact the network’s performance, TCH congestion rate.
TCH congestion='()*+, ./ (I1J1K21*2+ (*2.0M+N )G#P ,+Q(+535G.312 I()*+, G#P ,+Q(+535 *100
and
SDCCH congestion rate
='()*+, ./ /1K2+N 0.II+03K.I5 N(+ 3. 155KRI)+I3 /1K2(,+G.312 I()*+, 0122 133+)435 ∗ 100
were discussed in regard to the congestion in the network as it increases to a certain level (Hammed and Fatimah 2018).
Traffic model (TM) refers to the total traffic, which is the summary of the outgoing and the incoming traffic. The outgoing traffic is equal to the number of outgoing calls that a cell receives during a certain number of minutes multiplied by the number of minutes divided by 60 (min). Correspondingly, the incoming traffic is the number of the incoming calls that a cell receiving during a certain number of minutes multiplied by the minutes divided by 60 (min).
3.1.1.4. Retainability:
Retainability is the capability of a service to continue providing service under the given conditions for the requested period of time. It is also defined as the ratio of dropped voice calls over successfully established voice calls (Skianis et al., 2013). There may be multiple causes of low CDR
CDR ='()*+, ./ 5(00+5/(22S 0.)42+3+N 0122 133+)435'()*+, ./ N,.44+N 01225
within a network such as radio interference or hardware faults. Traffic Channel congestion is one of the issues relating to the KPI which should be resolved in order to improve QoS. It is defined as the ratio of blocked calls due to unavailable resources by the total number of call requests (Seytnazarov et al., 2010). Congestion in traffic channels occurs due to an increase in traffic at a specific site or an increase in the number of subscribers (Hammed and Fatimah 2018).
3.2 Proposed approach: Characteristics of optimal solution
The difficulties of network management are increased when devices and equipment from different manufacturers are used. “Cisco reports that 50 billion devices and objects will be connected to the Internet by 2020. Also, the Internet of Things (IoT) will contribute $117 billion to the IoT-based healthcare industry and $1.9 trillion to the global economy according to Gartner and Forbes” As a result the development of IoT technologies will introduce challenges in network performance, mobility and connectivity (Gad & Ahmed 2019). Thus with the use of a variety of devices on a network, the process of anomaly detection problems and issues becomes more difficult because the circuits in the network do not have a single console under which they operate. (Park et al., 2009). In this part of the thesis, an investigation is undertaken of a proposed automated scheme as a solution for network troubleshooting and fault detection based on data mining techniques to provide converged services with functionalities that facilitate its fault-handling and operational management. This section defines the values and limits of false alarm values based on KPI measures suggesting the optimal solution can be proposed.3.3 Correlation of Key Performance Indicators and faults
In this study, evaluation is presented on the basis of four important KPIs used as an input to create a classification algorithm to analyse and identify network faults. Currently, in most cellular networks, components provide alerts when there is a malfunction. However, these alerts are generally very low-level, leading to a large number of alerts for every potential fault. Our approach is that grouping alerts together in a meaningful way could help to identify the potential causes of network issues more clearly. However, even after associating alerts, there is usually not enough information to uniquely identify the cause of malfunction, especially when malfunctions can be caused by something other than equipment defects or failure. Moreover, even after alert association, the resulting number of alerts resulting from a single fault can still be very high. In addition, similar alerts can also be triggered by different causes. In order to reach a conclusive diagnosis, some alarms need to be discarded because they do not provide additional information, and some causes need to be ruled out because they are not applicable to the specific situation being investigated. Due to the nature of investigation required for these operations, the causes and symptoms of the problems within the network are explored.
3.4 Applied Statistics for fault diagnosis
In this chapter the aim is to collect, clean, categorise, and gain insights from large datasets created from 2014- 2017 that contain approximately 26,717 rows that present the users or the cell sites/Base Stations and Base station controllers (BCS) in approximately 86 columns of attributes. The fields of the columns are customers’ data (such as unique ids, age group, gender, day of purchasing the service, type of deals, payments data, base station & location data, service duration) and network performance data (dropped/successful calls, traffic data, traffic channels, Radio Access Barriers, etc). The first dataset tested in this part of the thesis contains network data from different telecommunication companies in Ireland including iD Mobile Ireland. The mobile data also contain an additional 11 columns comprised of formula derived values or alarm classes used to categorise the data in Key Performance Indicators. The primary aim of this effort is to better meet network troubleshooting needs, improve network optimisation, diagnose and identify the correlation of the different causes of network faults and KPI alarms.
The initial step in carrying out this effort was to acquire the relevant data to generate the various KPI reports, using the attributes available, and to find relations between our data and KPIs as a means of confirming the accuracy of the data. This verification step proved to be very important because as several tables of data where combined, additional derived variables occurred.The methods being utilized and applied to collected UMTS packet switched (PS) performance and service parameters (QoS) are discussed and suggested by the work of Ouyang, & Hosein Fallah, (2010).