NBER WORKING PAPER SERIES
LOCAL DIVIDEND CLIENTELES Bo Becker
Zoran Ivkovi Scott Weisbenner Working Paper 15175
http://www.nber.org/papers/w15175
NATIONAL BUREAU OF ECONOMIC RESEARCH 1050 Massachusetts Avenue
Cambridge, MA 02138 July 2009
We thank Heitor Almeida, Vidhan Goyal, Denis Gromb, Christian Leuz, Andrew Metrick, Joshua Pollet, Raghu Rajan, Xuan Tian, Michael Weisbach, Joshua White, seminar participants at City University of Hong Kong, Emory University, Harvard Business School, London Business School, McGill University, Massey University, Nanyang Technological University, Singapore Management University, Temple University, University of Hong Kong, University of Illinois at Urbana-Champaign, University of Toronto, Victoria University of Wellington, Yale University, as well as participants at NBER Corporate Finance Meeting (March 2007), American Finance Association Meetings (January 2008), FIRS Finance Conference (June 2008), and Florida State University Beach Conference (April 2009) for comments and suggestions. The views expressed herein are those of the authors and not necessarily those of the National Bureau of Economic Research. An Internet Appendix containing supporting material is available at http://www.afajof.org/supplements.asp. NBER working papers are circulated for discussion and comment purposes. They have not been peer-reviewed or been subject to the review by the NBER Board of Directors that accompanies official NBER publications.
© 2009 by Bo Becker, Zoran Ivkovi, and Scott Weisbenner. All rights reserved. Short sections of text, not to exceed two paragraphs, may be quoted without explicit permission provided that full credit,
Local Dividend Clienteles
Bo Becker, Zoran Ivkovi , and Scott Weisbenner NBER Working Paper No. 15175
July 2009, Revised January 2010 JEL No. G30,G35
ABSTRACT
We exploit demographic variation to identify the effect of dividend demand on corporate payout policy. Retail investors tend to hold local stocks and older investors prefer dividend-paying stocks. Together, these tendencies generate geographically-varying demand for dividends. Firms headquartered in areas in which seniors constitute a large fraction of the population are more likely to pay dividends, initiate dividends, and have higher dividend yields. We also provide indirect evidence as to why managers may respond to the demand for dividends from local seniors. Overall, these results are consistent with the notion that the investor base affects corporate policy choices.
Bo Becker
Harvard Business School Soldiers Field Road Baker Library 349 Boston, MA 02163 [email protected] Zoran Ivkovi
Department of Finance Michigan State University 315 Eppley Center
East Lansing, MI 48824 [email protected]
Scott Weisbenner
University of Illinois at Urbana-Champaign Department of Finance
340 Wohlers Hall, MC-706 1206 South Sixth Street Champaign, IL 61820 and NBER
This paper examines the role of investor demand in shaping corporate payout policy. Miller and Modigliani (1961) suggest that matching takes place between investor clienteles who demand dividends and those firms that find it less costly to pay them, that is, companies set payout policy and investors sort based on their preferences for dividends. On the other hand, firms may actively respond to the preferences of their current shareholders. The empirical patterns will be the same regardless of the direction of the underlying causal relation—payout policies match investor preferences, but the implications for understanding corporate policy are very different. For example, if companies adjust policy in response to the composition of their current investors, then it clearly matters who the shareholders actually are.
We test whether shareholder demand for dividends influences firm payout policy. The challenge is to quantify dividend demand and, in particular, find a variable that reflects investor demand for dividends, but does not, at the same time, also proxy for dividend supply from firms (firms might be more likely to pay or supply dividends because of a lack of investment opportunities).
We seek to identify the effect of dividend demand on firm policy by exploiting geographical variation in the population of retail investors. Our identification strategy is based upon two notions. First, seniors have a preference for dividend-paying stocks.1 Several reasons have been proposed for this preference. Miller and Modigliani (1961) and Shefrin and Thaler (1988), among others, stress the role of life-cycle considerations—older investors may prefer dividend-paying stocks for consumption purposes. Thaler and Shefrin (1981) further point out that self-control and regret avoidance may motivate a dividend preference (consume from dividends and thus avoid the temptation to liquidate shares), Shefrin and Statman (1984) stress mental accounting (dividends and capital gains are in two separate “mental accounts” and are thus potentially viewed and treated differently), while Scholz (1992) highlights a tax rationale. Because older investors likely have more pronounced needs to “cash out” larger portions of their portfolios for consumption and also likely have lower tax rates on dividends relative to younger investors, all of these motivations suggest greater
demand for dividends from senior investors. In this paper, we do not address the reasons for seniors’ preference for dividends; rather, we build upon the strong empirical evidence, provided in Graham and Kumar (2006), of the existence of an age-based dividend clientele among retail investors. The substantial demographic variation in population age structure across the U.S. (see, e.g., Becker (2007)) thus lays a foundation for an identification strategy.
Second, household stock ownership tends to be local. The tendency of individual investors to hold stocks of local companies in the U.S. has been reported by Huberman (2001) and Ivković and Weisbenner (2005); it has been documented in other countries as well (e.g., Grinblatt and Keloharju (2001), and Massa and Simonov (2006)). Variation in the local-age structure, therefore, induces differential dividend preferences across locations. Companies located in the areas with more seniors will face higher demand for dividends. Thus, we can identify a component of the dividend demand facing individual firms. Our proxy for this demand is the variable Local Seniors, defined henceforth as the fraction of residents who are 65 years old or older in the county in which a company is headquartered. We use Local Seniors to test whether geographically-varying dividend demand is a determinant of payout policy for U.S. corporations, thus building upon the Miller and Modigliani (1961) framework.2
Our dividend demand hypothesis requires that a couple of conditions be satisfied. First, there must be a sorting friction such as geographically-segmented markets. This assumption seems less appropriate for well-known members of the S&P 500 index such as Microsoft or IBM. However, research suggests that location matters for many firms in terms of their access to financing (Becker (2007)), their market valuation (Hong, Kubik, and Stein (2008)), the correlation pattern in their stock returns (Pirinsky and Wang (2006)), their liquidity (Loughran and Shultz (2005)), and the composition of their shareholders (Ivković and Weisbenner (2005)). Second, management must perceive some benefit to responding to the dividend demand from local seniors, or some cost in not doing so. As discussed below, we provide suggestive evidence for this in the paper.
Our identification strategy follows a three-tiered approach. First, we establish a strong correlation between a firm’s dividend policy and the fraction of seniors in the firm’s local community. Second, we provide a wide range of robustness tests which, in their totality, enable us to better ascertain whether companies pay dividends in response to the demand from their shareholders (who are more likely to be local seniors in the areas in which the fraction of seniors is relatively high) or whether the presence of local seniors proxies for the companies’ poor investment opportunities that compel them to pay dividends (the dividend-supply alternative explanation). We also employ specifications that require a substantially higher hurdle to identify this “local seniors effect,” such as examining how dividend policy adapts to a change in the local environment (when the fraction of seniors in the county changes or when the company moves its headquarters). Finally, we provide indirect evidence as to why managers may care about adjusting dividend policy to match the demand generated by local seniors.
In the first tier of our identification strategy (identifying the underlying correlation), we show that companies headquartered in counties with a large fraction of seniors are more likely to pay dividends, more likely to initiate dividends, and pay a higher dividend yield. Increasing the proportion of seniors in a county by one standard deviation (an increase by 3.1 percentage points of the population in the county) increases the probability that a local firm is a dividend payer by approximately 1.8 percentage points, increases the probability that it might initiate dividends over the next year by approximately 1.0 percentage points, and increases the dividend yield by approximately 0.23% of market value. These results are obtained after controlling for firm-specific characteristics, as well as state-year and industry-year fixed effects in payout policy. Accordingly, any variable that varies only by state and year is absorbed in the state-year fixed effects and cannot explain any of our regression findings. The same holds for any variable that varies only by industry and year. Simply put, our results are not obtained by comparing firms, for example, in Florida (the most senior state) with those in Alaska (the least senior state). Rather, they are identified by differences in the proportion of seniors across counties within a state in a given year.
The effect of Local Seniors on dividend initiations is particularly strong given the dividend initiation rate is roughly 2% per year over our sample—a one-standard deviation increase in Local Seniors increases the likelihood of a dividend initiation by 50% of the baseline effect. To put this in perspective, a one-standard deviation increase of the fraction of seniors in a company’s community has the same effect on the likelihood that the company initiates dividends as does a one-standard deviation increase in market capitalization, or ageing from being publicly-listed for 6-10 years to being publicly-listed for 16-20 years. Determinants of the dividend initiation decision are particularly relevant because, given the general “stickiness” of dividends (Lintner (1956) and Brav, Graham, Harvey, and Michaely (2005)), the decision to initiate dividends, practically speaking, really is a decision to commit to a long stream of cash outlays (as opposed to a simple one-year commitment that can be easily reversed).
A natural concern with these results and the associated dividend-demand interpretation is that some omitted variable might be the true driver of dividend policy. If such a variable were correlated with the presence of seniors in communities, our results would be spurious. For example, a dividend supply-based alternative theory suggests that Local Seniors might proxy for areas with low growth prospects, in which case it would characterize the areas in which companies are paying dividends because they are facing limited future economic prospects.
Whereas it is difficult to rule out completely that such an alternative explanation could play some role in explaining our results, in the second tier of our identification strategy we provide evidence that helps differentiate our demand-based explanation from the supply-based alternative theory and thus guides us in interpreting the correlation between dividend policy and Local Seniors. We conduct a number of additional tests and alternative specifications. Some of these additional analyses simply add additional control variables to the baseline model. Others seek to identify subsets of companies for which the correlation between dividend policy and Local Seniors should be stronger (or weaker, or absent) under the dividend-demand hypothesis, whereas the supply-based alternative predicts no variation in the effect of Local Seniors. In addition
to these robustness checks, we also employ different specifications that substantially raise the hurdle of finding any effect of Local Seniors on payout policy by examining how dividend policy adapts to a change in the local environment, either through the fraction of seniors changing in a given community over time or through the change in the presence of local seniors because the company moved its corporate headquarters.
Taken in their totality, the results obtained from this battery of robustness tests and alternative specifications are informative in interpreting the likely mechanism behind the relation between dividend policy and the presence of local seniors. For example, we find no relation between the presence of local seniors and share repurchases, investment, and net income (as would be predicted if the presence of local seniors were related to the presence of mature companies that generate high cash flows, but have limited investment opportunities)—the only relation is with dividend policy. Our results are robust to a wide range of economic and demographic county-level controls and we confirm that the correlation between dividend payout policy and the presence of seniors in the community is not driven by firms in economically stagnating counties.
Implicit behind the dividend-demand explanation is the presence of a market friction such as geographically-segmented markets (for example, companies relying on “locals” as their shareholders/financiers). These frictions and, hence, local shareholders, probably are not equally important for all firms. In particular, we hypothesize that the dividend policy of four subsets of firms should display greater sensitivity to the presence of local seniors: (1) small companies (these companies generally are more reliant on a local shareholder base and lack a “national” following); (2) companies located in the counties in which there is a strong preference for owning local stocks in general (unrelated to local seniors’ demand for dividends); (3) banks (a subset of companies for which local seniors are also likely important customers because they provide a large share of bank deposits, thus providing management a further incentive to appease any preference for dividends); and (4) companies located in communities with few other nearby companies around to satisfy the local investors’ demand for
dividends (akin to the “only-game-in-town” effect of Hong, Kubik, and Stein (2008)). The supply-based alternative has no such predictions along these four dimensions because the supply of dividends (i.e., the companies’ ability to pay dividends) should not depend upon the role of local senior investors. Consistent with the “dividend-demand” hypothesis, we find that the effect of Local Seniors is stronger for all four of the subsample splits identified above.
Finally, in the third tier of our identification strategy, we shed some light on an important piece of the puzzle—why managers may care about responding to this dividend demand. Our first finding is that local senior investors have lower stock turnover. That is, once senior investors buy shares of a local stock, they tend to hold them for a while, more than twice as long as average retail investors do. We also document valuation effects on the ex-dividend day that are consistent with the local-seniors effect.
Overall, the analyses presented in this paper suggest that corporations appear to face varying incentives to pay dividends depending on their location, and that these varying incentives seem to affect dividend policy, particularly the decision to start paying dividends, a decision that has long-lasting consequences for the corporation. We can detect such effects on payout policy in a given cross-section because there is substantial variation in demographics across counties in the U.S.3 While the dividend-demand hypothesis has strong cross-sectional predictions (companies located in the areas with larger fractions of seniors are more likely to pay dividends), it is unlikely to have affected the aggregate time series of dividend payments. Over the period from 1980 to 2000, although the age structure of some counties has changed in a non-trivial way, the average fraction of seniors in the counties in which firms are located has changed little (from 11.1% of county population in 1980 to 11.8% in both 1990 and 2000). As Fama and French (2001) point out, changes in the industry composition of firms over time have led to a strong time-series decline in aggregate dividend payouts—this certainly overwhelms any demographic tendencies over the sample period.
Our result that investor preferences can be an important determinant of corporate decisions complements findings from several recent studies. For example, our work is related to research on the time-series variation in the demand for dividends (Baker and Wurgler (2004a, 2004b)). Similar to Baker and Wurgler, we conclude that dividend demand drives some part of the variation in payout policy (in our case, cross-sectional variation). Our paper is also related to Perez-Gonzales (2003) and Brown, Liang, and Weisbenner (2007), which examine firms’ responses to tax changes based on the presence of large shareholders and CEOs as owners, respectively, examples of the type of research called for in Graham (2003). Similar to these papers, we conclude that owners matter for corporate policies, but, in this case, these are retail investors. Finally, our results suggest that there is important geographical variation in the financial conditions facing firms, consistent with the findings reported in, for example, Jayaratne and Strahan (1996), Guiso, Sapienza, and Zingales (2004), Becker (2007), and Hong, Kubik, and Stein (2008).
The rest of the paper is organized as follows. Section I describes our data sources. Section II presents evidence on the effect of Local Seniors on firm dividend policy with several robustness checks. Section III describes evidence as to why managers may care about this dividend demand, and Section IV concludes.
I.
Data Sources and Main Sample Overview
A. Data SourcesWe compile data from several sources. Stock returns and ex-dividend date information come from the Center for Research in Security Prices (CRSP). Firm-level accounting information, as well as firm location information (the county in which the headquarters are located), come from Compustat. Our use of the location of corporate headquarters follows previous studies in the locality literature (Coval and Moskowitz (1999, 2001) and Ivković and Weisbenner (2005)).
Geographic data on seniors at the county level and other county-level demographic variables come from the 1980, 1990, and 2000 U.S. Censuses. As discussed before, we define the variable Local Seniors as the population of individuals aged 65 or older living in a county divided by the total population of that county. The Local Seniors variable is slow-moving and consecutive cross sections generally are very similar (the correlation between the county-level fraction of seniors in the 1990 and 2000 censuses is 0.94, and the correlation between the 1980 and 2000 censuses is 0.84). We also collect median house prices, median income, and educational composition of the county (the fraction of the population completing grades 1-8, grades 9-11, high school, some college, and finished a bachelor’s degree or higher) for each census year.
Some of our analyses involve the use of a data set of the positions and trades made by tens of thousands of individuals through a large discount broker in the period from 1991 to 1996.4 These data are used for two primary purposes. First, we use them to establish the degree of local bias that prevails in a county. Second, we use detailed trade data to draw inferences regarding the trading propensities of local seniors relative to those exhibited by other individual investors who invested through the discount broker.
In our analyses of dividend policy changes for companies that moved their corporate headquarters, we use Compact Disclosure to ascertain likely movers. The information provided through this data source was cross-checked with other sources to confirm the moves.5
TABLE I ABOUT HERE
B. Main Sample Overview
Table I presents summary statistics for payout policy variables and key county-level variables. The sample consists of pooled cross-sections for 1980, 1990, and 2000. Summary statistics for payout policy variables are presented in Panel A and are expressed in percentage points. Dividend Payer is an indicator variable equal to 0 for non-payers and equal to 100 for dividend payers. Dividend Initiation is an indicator
variable defined for non-payers at the end-of-year t. Its values are 0 for the companies that remain non-payers in year t+1, and 100 for non-payers at the end-of-year t that start to pay a dividend in year t+1. Dividend Yield is the dollar amount of dividends paid out in year t+1 as a percent of the end-of-year t equity market value. Repurchase Yield is defined analogously for share repurchases in year t+1. All of our payout policy variables (our left-hand side variables) are measured the year after our firm-level and county-level controls (the right-hand-side variables). Thus, the payouts in 1981, 1991, and 2001 are related to the firm-level and county-level characteristics in the 1980, 1990, and 2000 cross sections, respectively. The average value of 47.4 for the variable Dividend Payer indicates that 47.4% of companies paid dividends in the following year. Similarly, in our sample 2.0% of companies not paying any dividends in a given year paid dividends the next year (Dividend Initiation). The average dividend yield across all firms (non-payers as well as payers) is 1.9%, and the repurchase yield is 1.1%.
Summary statistics for key geographical variables are presented in Panel B of Table I. The Local Seniors variable (the proportion of county population aged 65 or older) averages 0.116 across all sample observations. The range is wide, from 0.022 to 0.321, and the standard deviation is 0.031. Aside from summary statistics pertaining to the proportion of seniors in counties, the table also lists summary statistics for the inverse of the number of firms in the county (the number of firms from Compustat with their headquarters—“company location”—located in the county). The average is 0.102 (corresponding to 10 companies in the county), and the range is from 0.002 to 1 (corresponding to 500 companies and one company in the county, respectively).
II.
Results
A. Baseline ResultsOur baseline test of the hypothesis that local dividend demand determined by demographics helps explain corporate payout policy is to verify whether there is a positive relation between our three dividend payout policy variables and Local Seniors.
In an ideal econometric framework, we would use the Local Seniors variable as an instrument for dividend demand in payout policy regressions. Because we do not have an explicit measure for dividend demand, we instead estimate payout policy regressions with the Local Seniors variable (that is, we essentially estimate “reduced-form” regressions). We employ a linear-regression (OLS) framework on the sample of pooled observations from the 1980, 1990, and 2000 cross-sections, using three measures of dividends: an indicator variable for paying dividends (Dividend Payer), an indicator variable for paying dividends conditional upon having not paid dividends the previous fiscal year (Dividend Initiation), and the dividend yield variable (Dividend Yield).6 All of these dividend policy variables are expressed in percentage points.
Our payout policy dependent variables, defined in the previous section, are measured one year after our Local Seniors variable and our firm-level controls. In addition to Local Seniors, all the specifications feature a multitude of other firm-specific controls. Net Income, Cash, and Debt (long-term) are all normalized by total assets. Q is defined as the market-to-book ratio, that is, the market value of equity plus the book value of liabilities divided by the book value of assets. Volatility refers to the standard deviation of monthly stock returns over the preceding two years. Two-Year Lagged Return refers to monthly stock returns over the preceding two years. Asset Growth is the logarithm of the growth rate of assets over the prior year. Age-group indicator variables (for corporations publicly listed 1-5, 6-10, 11-15, 16-20, and 21+ years ago), industry-year interaction indicator variables (fixed effects for 2-digit level SIC industries interacted with year), and state-year interaction indicator variables are also included in all three specifications. All independent variables, when appropriate, are winsorized at the 1st and 99th percentile levels.
State-year interaction indicator variables play a particularly important role because they absorb all variation in dividend behavior between states in a given year. This implies that none of our results are identified from, for example, differences across Florida and Utah, but, rather, from county-to-county variation within states. Similarly, industry-year interaction indicator variables ensure that our results are not identified
from, for example, technology companies being located in the areas with many young people, and construction companies being located in the areas with many seniors. Finally, we allow for heteroskedasticity and potential correlation across the observations associated with the same firm when estimating the standard errors. Specifically, we use the Huber and White sandwich estimator to estimate robust standard errors with clustering by firm.
TABLE II ABOUT HERE
The results are presented in Table II. Column (1) reports the results for the Dividend Payer dependent variable. The estimated coefficients pertaining to traditional independent variables line up with expectations and previous studies. For example, firm-level volatility, asset growth, and leverage all reduce the probability of paying dividends, while firm size (market value) and firm age (unreported in the table for brevity) increase the likelihood of paying dividends. The coefficient associated with Local Seniors is 59.3 and is highly statistically significant (p-value < 0.01). The interpretation of the coefficient is that moving from a county with no seniors to a county with only seniors increases the likelihood that the company pays dividends by 59.3 percentage points. Thus, although Local Seniors is a noisy proxy for “dividend demand” from shareholders, we find both statistically and economically significant effects of Local Seniors on corporate dividend policy.
Column (2) examines dividend initiations. The sample is smaller because it includes in each cross-section only the prior calendar year’s non-dividend payers. The coefficient associated with Local Seniors is large and significant, implying that the probability of initiating dividends is much higher for corporations located in counties with a large fraction of seniors. The dependent variable in column (3) is Dividend Yield, that is, total dividend payout divided by market value (expressed in percentage points). Once again, Local Seniors has a positive and significant effect.
In Table IA.II of the Internet Appendix, we provide the economic magnitude of the effects of Local Seniors and various firm-specific controls on company dividend
policy by analyzing the predicted effect on dividends resulting from a one-standard deviation change in a particular variable (using the estimated coefficients from Table II).7 For the simple Dividend Payer variable, the effect of Local Seniors is larger than those of some firm characteristics commonly included in payout policy regressions, but it is smaller than those of stock return volatility, size, Q (proxied for by the market-to-book ratio), and leverage. A one-standard deviation increase in Local Seniors (0.031) boosts the likelihood of paying dividends by 1.8 percentage points, or four percent of the sample average likelihood of paying dividends. An increase in Local Seniors by one standard deviation is associated with an increase in the dividend yield by 0.23%, a 12 percent increase relative to the sample average yield of 1.9%.
Particularly striking is the economic magnitude of the effect of Local Seniors on the dividend initiation decision. An increase of one standard deviation in Local Seniors is associated with a 1.0 percentage-point increase in the probability of dividend initiation for non-payers, an economically substantial effect that is equal to one-half of the average rate of initiation of 2.0% over the sample. To put this effect of Local Seniors on dividend initiations in perspective, it is of the same magnitude as a one-standard deviation increase in firm size (market capitalization) or the firm ageing from being publicly-listed for 6-10 years to being publicly-listed for 16-20 years (which is associated with a 1.1 percentage point increase in the likelihood of the firm starting to pay dividends). The effect of Local Seniors is twice the magnitude of one-standard deviation changes in cash holdings, debt, volatility, and prior two-year returns.
These results provide evidence of an effect of Local Seniors on dividend policy.8 The estimated coefficients suggest an economically important relation between corporate payout behavior and local dividend demand, particularly for dividend initiations. Given the “stickiness” of dividend policy, understanding what causes companies to start paying dividends in the first place is crucial for better understanding why they are paying dividends today.
Whereas these findings are consistent with individual-investor demand driving corporate payout policy decisions, this clearly is not the only plausible interpretation of our results. We next consider potential alternative explanations for these results.
B. Toward Ruling Out a Supply-Based Alternative Hypothesis
Having established the baseline result—the presence of a strong correlation between dividend payout behavior and Local Seniors, we proceed with the second tier of our identification strategy, in an effort to differentiate our demand-based explanation from the supply-based alternative theory. Indeed, it is possible that some omitted variable, correlated with Local Seniors, might be the true driver of dividend policy. For example, Local Seniors might proxy for areas with low growth prospects and, perhaps, high profitability. A supply-based alternative explanation would suggest that the companies located in counties with many seniors might have high profitability, low investment, and high payouts (perhaps both in the forms of dividends and share repurchases). On the other hand, our demand-based hypothesis predicts a positive effect of Local Seniors on dividends, as established in the previous section, and no effect of Local Seniors on company characteristics or policies affected by supply-based alternatives such as share repurchases, profits, and investment.
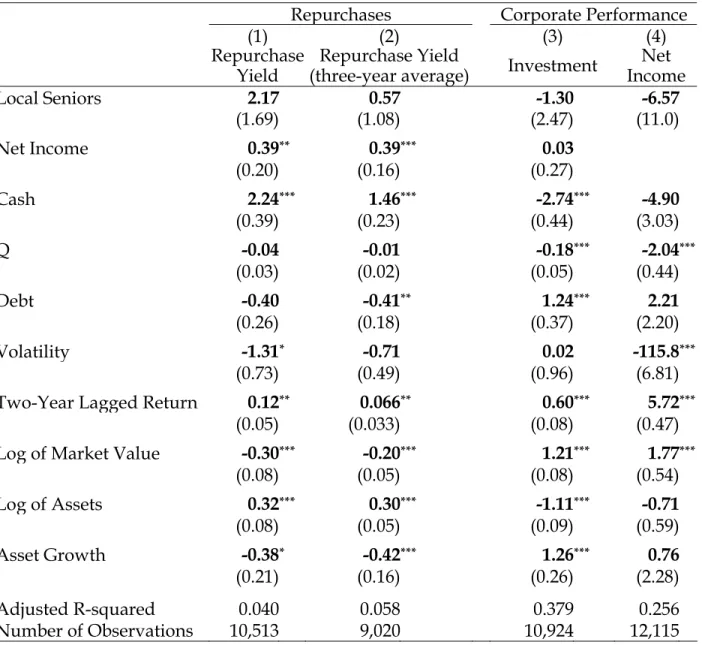
To differentiate between these alternative explanations, we relate share repurchase behavior, investment, and net income to Local Seniors (as well as the same set of independent variables as in the analyses reported in Table II and discussed in the previous section). The dependent variables in these analyses are Repurchase Yield (the dollar amount of stock repurchases made in year t+1 as a percent of the end-of-year t equity market value), Investment (capital expenditure in year t+1 as a percent of the end-of-year t assets), and Net Income (net income in year t+1 as a percent of the end-of-year t assets).
In short, the results, presented in Table III, do not offer any support for the supply-based alternative. Indeed, there is no effect of Local Seniors on the Repurchase Yield (either measured over the next year or averaged across the next three years to
address fluctuations in share repurchases on a year-to-year basis), Investment, or Net Income.
TABLE III ABOUT HERE
C. Economically Growing Areas and Additional County-Level Controls
Another way to differentiate between demand- and supply-based explanations is to consider a local economic environment that, very likely, is growing (or, at least, is not stagnating). Governed by the notion that a decline in the total number of young residents (those younger than 40 years of age) in the county since the last census is a proxy for economic stagnation (for example, rural, declining areas with mature, “old-economy” companies), for the purposes of these analyses we remove the observations associated with such county-year combinations from the sample.9 That is, in a given cross-section, we drop firms located in the counties in which the fraction of seniors may be high because young people left to find better opportunities elsewhere. If the relation between dividends and the presence of local seniors is driven by mature firms in declining areas, the effect of Local Seniors should disappear when estimated over the “growing” subsample. The demand-based explanation, however, still applies in the remaining sample and thus predicts a positive relation between dividends and Local Seniors.
Table IV features the results of regressions by subsample. For ease of comparison, columns (1), (4), and (7) replicate Table II. The columns featuring the regressions analogous to those reported in Table II, but estimated over the growing-county subsample—columns (2), (5), and (8)—report coefficients associated with Local Seniors that are similar in magnitude to those resulting from the estimation based upon the full sample (and are also highly statistically significant).
Returning to the full sample, a further robustness test serves to alleviate the concern that Local Seniors might proxy for some observable demographic and economic variables that capture the local environment in which firms operate. The remaining three columns in Table IV—columns (3), (6), and (9)—feature the results
based upon such a specification, in which the set of independent variables has been augmented by additional demographic controls (logarithm of county population and the educational composition of the county—the fraction of the population having finished college, the fraction having finished high school, and so on) and economic controls (the average of each of the firm-level variables across all companies located in the county, as well as the share of local companies in each industry as classified by the two-digit SIC code, median house prices in the county, and median income in the county). Once again, the regression coefficients are quite similar, both in terms of their magnitude and significance, to those resulting from the baseline specification.
TABLE IV ABOUT HERE D. Differences in Companies’ Responses to Local Dividend Demand
As discussed in the introduction, the relation between corporate policy and the preferences of the local community likely varies across firms. In particular, we hypothesize that the dividend policy of four subsets of firms should display greater sensitivity to the presence of local seniors. The first subset is small corporations, companies generally more reliant on local shareholder bases and characterized by a lack of a “national” following. The second subset is firms located in the counties in which there is a strong preference for owning local stocks in general (unrelated to local seniors’ demand for dividends). The third subset is corporations in the banking industry, a subset of firms for which local seniors likely also are important customers because they provide a large share of bank deposits (thus providing further incentive to appease any preference for dividends).10 Finally, the fourth subset is companies located in counties with few other nearby corporations to satisfy the demand for dividends of local investors (akin to the “only-game-in-town” effect of Hong, Kubik, and Stein (2008)). The supply-based alternative has no such predictions along these four dimensions because the supply of dividends (that is, the companies’ ability to pay dividends) should not depend upon the role of local investors.
Table V features the related results. The first column restates the baseline estimate of the Local Seniors coefficient from Table II. In addition to all the independent variables from the baseline specification, these analyses feature three indicator variables. The first indicator variable, featured in column (2), is Small Firm; it is equal to 1 for firms with below-median market capitalization, and to 0 otherwise. The second indicator variable, featured in column (3) is High Local Bias County; it is equal to 1 if the company is headquartered in a county in which the extent of local bias among the non-senior local retail investors from the brokerage data sample is above the median, and 0 otherwise.11 The third indicator variable, featured in column (4), is Bank; it is equal to 1 for firms in the banking industry (2-digit SIC code equal to 60), and to 0 otherwise.
The results presented in column (2) line up with the predictions very closely— the effect of Local Seniors is concentrated among small companies (there essentially is no effect for large companies, with a point estimate of 7.6; SE = 24.0), with a highly statistically significant point estimate of 99.8 for the total effect of Local Seniors for small firms (the baseline effect of Local Seniors, 7.6, plus the interaction of Local Seniors and Small Firm, 92.2, gives the total effect of Local Seniors for small firms). Column (3), similarly, shows that the effect is concentrated among the companies headquartered in high local-bias counties. The total effect of Local Seniors for firms in high local-bias counties is 144.0, with a high level of statistical significance.
Next, we consider banks. Banks have a particularly relevant feature—local seniors likely are important customers of the firm. As Becker (2007) documents, seniors are important among bank retail customers. Compared with other age groups, seniors tilt their financial portfolios disproportionately toward bank deposits; they are the only age group in which more than 90% of individuals have transaction accounts and in which more than 20% hold certificates of deposits. Moreover, seniors have much higher mean and median shares of their wealth held in checking accounts, saving accounts, and certificates of deposit than any other age group (Becker (2007, Figure 1)). Because of this, and their higher financial wealth, although their population fraction is only 12%,
seniors own 33% of total household money in checking accounts, 27% of the money in savings accounts, and 37% of the money in CDs (even though they receive only about 14% of total income, including pensions), and hold 25% of total household wealth.12
The median distance between a borrower and a bank over the period from 1973 to 1993 period is no more than five miles (Petersen and Rajan (2002)). Assuming the same closeness exists for the bank-depositor relationship, there potentially is a significant cost associated with not considering the demand for dividends by local seniors—the risk of not only making local seniors unhappy as shareholders, but also as depositors, that is, bank customers (with a credible threat that such unsatisfied local seniors might withdraw their deposits and bank elsewhere).
According to column (4) of Table V, as predicted, the effect of Local Seniors is about two and one-half times larger for banks than it is for other companies. The coefficient associated with the total effect of Local Seniors on banks is 134.5 and is highly statistically significant, whereas the effect of Local Seniors on other firms is 52.2 (still significant in its own right); the difference between the two is statistically significant at the 5% level.
We conclude this section with a test of whether local dividend demand matters more for companies in counties with fewer surrounding firms, in the spirit of the “only-game-in-town” effect of Hong, Kubik, and Stein (2008), who find that companies located in areas with fewer other firms around receive higher valuations. We extend their study with an inquiry into whether such an effect is present for dividend policy. If local seniors demand a certain level of dividends (or dividend-paying stocks in their portfolio) and they look to local companies to satisfy it, then their dividend demand should be stronger for a given firm when that firm is surrounded by few other companies in the county. The results, presented in column (5) of Table V, indeed suggest that the effect of Local Seniors is stronger in the counties with a lower density of companies. Specifically, the effect of the interaction between Local Seniors and the inverse of the number of firms in the county is positive, large in magnitude, and highly statistically significant.
TABLE V ABOUT HERE E. County-Level Fixed Effects
We next employ analyses that represent a much higher hurdle to identify the local-seniors effect. The first such analysis is analogous to the baseline analysis (see Section II.A and Table II), with the additional inclusion of fixed effects at the county level. Thus, the identification of the effect of Local Seniors on dividend policy comes from changes in the fraction of seniors in the county (controlling, as before, for all other firm-specific factors that may vary over time). In other words, the coefficient associated with Local Seniors in this specification is identified from the payout policy decisions of companies headquartered in counties in which the age composition is changing over time. We first apply this county-level fixed-effects specification on the full sample, and then obtain the relation between dividend policy and Local Seniors for two subsets of firms where we would expect to find a more pronounced relation.
The coefficient associated with Local Seniors from the Dividend Payer county-level fixed-effects regression is 64.4 (SE = 51.0) for the full sample of firms. The magnitude of the effect is similar to that reported in the cross-sectional regression in Table II but the p-value of the coefficient is 0.21. However, there are marginally significant effects for two subsamples among which, a priori, the dividend-demand motivation should be strong—small companies (coefficient = 114.8, SE = 64.8, p < 0.1), companies in the counties in which the residents have high local-bias tendencies in their portfolios (coefficient = 213.5, SE = 86.5, p < 0.05), and banks (coefficient = 112.4, SE = 67.7, p < 0.10).
F. Corporate Headquarter Moves
As a further source of identification, we consider the subset of firms that moved their corporate headquarters to a different state, a proxy for sufficient distance to assume comfortably that the two local individual investor pools (the “old” one and the “new” one) are not overlapping. We examine a sample of just under 150 such companies, obtained from Compact Disclosure, that moved their corporate
headquarters in the period from 1997 to 2000 and that have sufficient data pre- and post-move to conduct our analyses.13
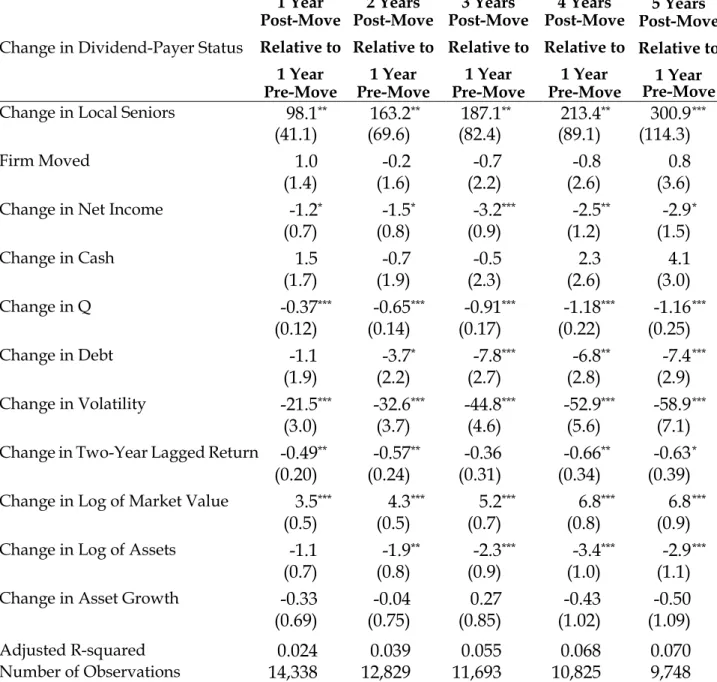
The analyses relate the changes in dividend policy in the aftermath of the move (relative to the dividend policy before the move) to the changes in proportion of seniors across the new and old communities, controlling also for changes in the other firm characteristics over that time period. For the purposes of these analyses, we incorporated the observations in off-Census years that occurred both before and after the move. For such observations, we use linear interpolations of Census figures from the 1990 and 2000 Censuses (and extrapolations for years after 2000). For a company that moved its headquarters, for example, some time between 1999 and 2000 (the company has an address in a different state in 2000 compared to 1999 in Compact Disclosure), we record whether it paid dividends in 1998, one full year before the move (and its characteristics and the fraction of seniors in the “old” community at that time) and whether it paid dividends after moving to its new location (recording firm characteristics and the fraction of local seniors at the “new” community). We measure whether the company paid dividends one to five years after the move—in the 2000 move example, the first full year after the move would be 2001, and the fifth year after the move would be 2005.
Column (1) of Table VI presents the results, provided in five panels that allow for increasingly longer post-move periods, ranging from one to five years, respectively.14 Two key results stand out. First, even for a one-year post-move horizon, there is a strong relation between the change in dividend-payer status and the change in Local Seniors (the point estimate, 111.2, is large and is statistically significant at the 5% level). Second, perhaps not surprisingly, the effect strengthens as the post-move horizon increases; the effect of Local Seniors roughly doubles for the three-year horizon, and increases still further to 343.2 for the five-year horizon (statistically significant at the 1% level). A firm moving to a county in which Local Seniors is one standard deviation higher than it was at its original location (that is, the Local Seniors variable increases by 0.031) is 3.4 percentage points more likely to be a dividend payer one year after the
move, 5.9 percentage points more likely to be a dividend payer three years after the move, and 10.6 percentage points more likely to be a dividend payer five years after the move.
The second column features the complete sample of corporations in existence during the pre- and post-move years of the 1997 to 2000 sample of movers. To be specific, in the first column we relate changes in dividend policy to changes in Local Seniors and firm-level characteristics for the sample of movers only. In column (2), we also include in the regression the changes in dividend policy and firm-level characteristics for all the non-moving companies over the same time period. Aside from testing whether the change in Local Seniors affected the dividend policy of moving companies in column (1), the specifications in column (2) allow us to test further whether the change in dividend policy differed across mover and non-mover companies (also controlling for the effect of changes in the firm-specific characteristics on both the movers and non-movers). These specifications thus include the indicator variable Firm Moved (it is equal to 1 if the company’s headquarters moved in year t, and 0 otherwise). The findings offer additional reassurance—by itself, the fact that the company headquarter locations have changed (controlling for everything else, of course) played little role in the change in dividend policy.15 Moreover, the sizes and significance levels of the coefficients associated with Local Seniors in the two analyses are highly comparable.
Naturally, the small sample size of the set of movers calls for caution in interpreting these results and, thus, extrapolating these results to the general population of firms. Nonetheless, the direction, magnitude, and significance of these results all line up in a manner consistent with the dividend-demand hypothesis and our results presented elsewhere in the paper, thus offering complementary evidence, obtained with an entirely different identification strategy.
III. Potential Benefits of Satisfying Local Dividend Demand
Upon finding effects consistent with the dividend-demand hypothesis, we proceed with the third and final tier of our identification strategy. In this section, we explore why managers might wish to respond to local seniors’ demand for dividends,16 whether there are benefits to such demand-induced payouts, as well as the mechanisms through which individual investor demand may affect corporate policy. We consider two possible channels and offer suggestive evidence. At the outset, we remark that the channels we discuss in this section are not mutually exclusive. Moreover, none of these channels require that managers explicitly be informed about local retail investors’ age, or that they should feel goodwill toward local investors in general, or local seniors in particular.
A. Lower Turnover
Graham and Kumar (2006) report that seniors are more likely to buy dividend-paying stocks in the two weeks leading up to the ex-dividend day, and are more likely to buy stocks after they start to pay dividends. We use the same brokerage data as in Graham and Kumar (2006) and build upon their result that seniors buy stocks after a company initiates dividends (or just before a company is to pay dividends) by studying individuals’ propensity to sell the stock they hold already (i.e., what local seniors do after they buy the stock). The brokerage data are extremely well suited for this purpose—to study the sale decision of a given investor and a given stock holding. That is, the many observations of potential sale behavior across many investors enable us to obtain strong and robust results regarding holding periods. We can thus ascertain, with a lot of precision, what happens once investors purchase stock—given their characteristics (in this case geographic location and age), whether they are more likely, relative to others, to keep on holding the stock.
We test whether, conditional on owning the stock, local seniors have a substantially longer holding period than other types of investors do. This lower turnover may be attractive to company management, and a way to attract such loyal
investors to own the stock in the first place is by paying dividends. To test the “lower turnover” channel, we first conduct a completely non-parametric analysis in which we estimate the cumulative likelihood of sale of a given stock holding for four investor groups (comprising just over 30,000 households): potential sales by all individuals, potential sales by seniors (65 years of age or older), potential sales by local investors (the distance between the household and corporate headquarters is 250 miles or fewer—the local-distance metric used in Ivković and Weisbenner (2005)), and potential sales by local senior investors.
Tallying of the sales made in a given month since purchase relative to the total number of potential sales at the beginning of the month produces non-parametric hazard rates for each month (i.e., probability of selling in that month conditional on not having sold the stock up to that point), and cumulating those monthly hazard rates yields the cumulative probability distribution of sale as a function of time since purchase. The four cumulative probability distributions are presented in Figure 1. Whereas the median holding period for all investors (the first sample) is 15 months, the median holding period for local-senior investors (the fourth sample) is substantially longer, 37 months.
This analysis, though compelling, does not take into consideration other potential motivations for sale, including stock performance since purchase, nor potential selection issues based on preferences for holding different kinds of stocks (each of which, by themselves, could lead to different selling patterns across the individuals). Therefore, we also conduct a more stringent analysis by incorporating several covariates that capture investor sensitivity to past performance (be it for behavioral reasons or because of tax motivations).
Our econometric framework for these analyses follows Ivković, Poterba, and Weisbenner (2005) closely. We use the Cox proportional hazards model, which employs non-parametric estimates of baseline monthly hazards (that is, the probabilities of selling the stock in month t after purchase, conditional on no prior sale). The results of the Cox proportional hazards model, presented in Table IA.V of the Internet Appendix,
confirm the differences in the likelihood of selling stock displayed in Figure 1. According to the estimates from the more rigorous proportional hazard-model analyses, during a month, a local-senior investor is 28 to 32 percent less likely to sell a share of stock than a non-local non-senior investor is. Aggregated over time, this difference results in much longer holding periods and much lower turnover for the group of investors who likely are attracted to purchase the stock of firms that pay dividends. B. Price Channel—Ex-Dividend Day Reaction
Our second line of inquiry considers valuation effects. Our identification strategy studies stock price movements around the ex-dividend day.17 We relate ex-dividend day returns to Local Seniors, a technique used previously to infer marginal tax rates (see, e.g., Elton and Gruber (1970), Perez-Gonzales (2003), and Graham and Kumar (2006)), as well as dividend-demand valuation effects for non-tax reasons (Graham and Kumar (2006)). Elton and Gruber (1970) divide ex-dividend price drops by the amount of the dividend and report that this ratio averages 0.78. Depending upon the subpopulation of corporations they consider, Graham and Kumar (2006) report that this ratio in their study averages from 0.67 to 0.79. The price drop is less than the dividend paid, presumably because, for many investors, dividends face higher taxes than capital gains do. As Elton and Gruber (1970) point out, in a rational market, the price drop when the stock goes ex-dividend reflects the relative value of dividends and capital gains to the marginal stockholders. Thus, a company whose owners face a lower dividend tax rate (or a higher tax rate on capital gains) should experience a bigger drop in the share price when the stock goes ex-dividend.
We apply a similar logic to the firms facing investors with a dividend preference: the ex-dividend day price drop, as a fraction of the dividend amount, should be large when demand for dividends is high. As before, we use Local Seniors to proxy for dividend demand. Alternative explanations for our findings on payout policy (for example, that Local Seniors proxies for local economic conditions that lead to dividend
supply by firms) do not predict such a relation between ex-dividend day price behavior and Local Seniors.
We adjust the ex-dividend methodology of Elton and Gruber (1970) along two dimensions. First, we use price changes from market close on the last cum-dividend day to the opening trade the following, ex-dividend day, and thereby focus more narrowly on the price change related to the loss of the dividend right, thus not confounding the inference with the price changes taking place during the following, ex-dividend day. Second, whereas the original Elton and Gruber (1970) methodology normalizes the price change by the dividend amount, our dependent variable is the relative price drop—the negative of the price change from the close of the last cum-dividend day to the open of the ex-dividend day divided by the closing price on the last cum-dividend day.18 Accordingly, our independent variables are the dividend amount scaled by the closing price, Local Seniors, and the interaction between the two (we also include Median Income, the median income of the county in which the company is headquartered and its interaction with the amount of the dividend).19 We estimate these regressions over the sample of stock returns surrounding ex-dividend days in the period from 1992 to 2007. Local Seniors and Median Income in off-census years have been estimated by linear interpolation (and extrapolation) of the figures from the Census years.
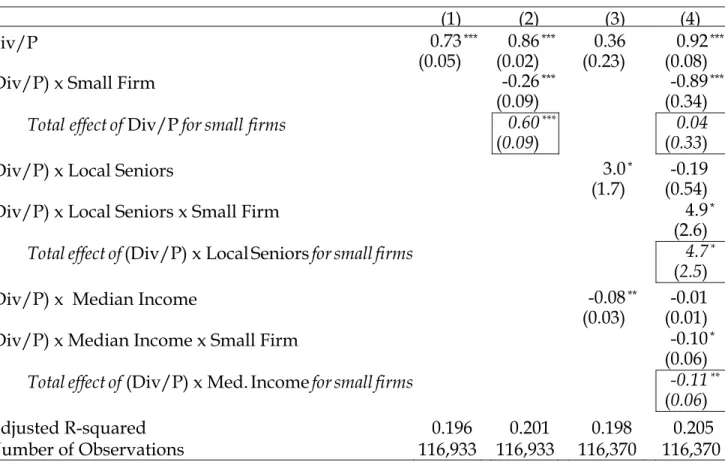
Table VII reports the results. The first column provides a simple gauge; it features only Divi,t/Piclose,t−1 (abbreviated in the table as Div/P for readability). The regression coefficient estimate is 0.73, suggesting that, absent further controls, a one-dollar dividend is associated with a 73-cent price drop on the ex-dividend day, a figure that is very similar to the baseline figures from Elton and Gruber (1970) and Graham and Kumar (2006).
The second column features Divi,t/Piclose,t−1 and its interaction with the indicator variable Small Firm (defined as in Table V), thereby allowing for differential valuations of dividends across the shareholders of small and large corporations. The results match
intuition and extant findings very well. For large companies, the price drop on the ex-dividend day associated with a one-dollar ex-dividend is 86 cents, whereas for smaller companies, more likely to be held by individuals, and thus subject to higher marginal tax rates, the price drop is 60 cents (the difference between the two is 26 cents, and is statistically significant at the 1% level).
In the third column, we present evidence that the ex-dividend day price drop, that is, the valuation of dividends, varies across communities. We add to the specification Local Seniors, an interaction between Div/P and Local Seniors, Median Income, and the interaction between Div/P and Median Income. In light of the primary interest in how characteristics of the community affect the relation between the ex-dividend day price drop and the amount of the ex-dividend (that is, the interactions of Local Seniors and Median Income with Div/P), the coefficients associated with Local Seniors and Median Income themselves are suppressed from the table for readability.20 Median Income, measured at the county level, is a geographically-based measure of income intended to capture tax-related motivations from potential local shareholders. Consistent with seniors’ demand for dividends, the price drop is positively related to Local Seniors (the coefficient estimate is 3.0, statistically significant at the 10% level), that is, the ex-dividend day price drop is larger in the areas with a higher fraction of seniors. The magnitude of this effect is substantial—a one-standard-deviation increase in Local Seniors is associated with an increase in the ex-dividend day price drop as a fraction of the dividend of 0.09, one-eighth of the average price drop from column (1).
The relation between the ex-dividend day price drop and the interaction (Div/P) x Median Income is negative and is statistically significant, consistent with smaller ex-dividend day price drops in regions in which income, and presumably tax rates, are higher. This result is consistent with marginal investors of at least some corporations being local individuals (and, thus, whether a firm is located in a community in which individuals have high income and high tax rates affects the valuation of the firm’s dividends on the ex-dividend day). However, given the unit of measurement of Median Income (in units of $100,000), its economic importance is very modest (a
one-standard-deviation increase in the median income of the county, $15,500 in our sample, is associated with an ex-dividend day price drop as a fraction of the dividend that is only 0.01 smaller).
Finally, in the fourth column, all the variables from the third column are interacted with the indicator variable Small Firm (defined as in Table V) to allow for differential effects across small and large companies.21 Our prediction is that the sensitivity of the valuation of dividends to the presence of Local Seniors should be stronger for small firms than for large firms. This is exactly what we find. As shown in column (4), there is no relation between the ex-dividend day price drop and the presence of Local Seniors in the community (or the median income of the county) for large corporations. Adding the coefficient on Div/P x Local Seniors and the coefficient pertaining to Div/P x Local Seniors x Small Firm provides the total effect of Local Seniors on the ex-dividend day price drop for small stocks and, compared to the estimate across all stocks of 3.0 from column (2), shows a larger effect of 4.7 for small stocks (statistically significant at the 10% level; the associated p-value is 0.06). A one standard-deviation increase in Local Seniors is associated with an increase in the ex-dividend day price drop as a fraction of the ex-dividend of 0.15 for small stocks, one-quarter of the average price drop from column (2). For small companies, more likely to be reliant on local shareholders, the ex-dividend price fall is also related to the median income of the county in which the company is headquartered in the direction predicted, but the economic magnitude of this “local-income” effect again is very small.
TABLE VII ABOUT HERE
In sum, these results extend the findings from Graham and Kumar (2006) that the price fall on the ex-dividend day is positively related to the age of the shareholders of the firm and negatively related to the income of the shareholders of the firm. Our ex-dividend results are consistent with the notion that companies located in counties with higher fractions of seniors face stronger demand for dividends, and that such demand is associated with larger stock-price drops on ex-dividend days, but only for the small
companies, those more likely to be affected by this geographically-varying demand for dividends from the local-senior population. The valuation effects detected on the ex-dividend day and the prior evidence concerning lower turnover, while each suggestive on their own, come together to reinforce the dividend-demand hypothesis. Moreover, neither channel requires that managers explicitly be informed about local retail investors’ age.
IV. Conclusion
Miller and Modigliani (1961) raise the question whether firms set policies and investors sort accordingly, or companies respond to the preferences of their current shareholders. In this paper, we provide evidence consistent with the latter. Specifically, we test for the effect of dividend demand on payout policy. The tendency of older investors to hold dividend-paying stocks in combination with individual investors’ inclination to hold local stocks results in stronger dividend demand for companies located in areas with many seniors. Demographics thus provide an empirical proxy for dividend demand, which we exploit in this paper to examine the broader question whether the preferences of current owners influence corporate actions.
As predicted, we find a significant positive effect of Local Seniors, the fraction of seniors in the county in which a firm is located, on the firm’s propensity to pay dividends, its propensity to initiate dividends, and on its dividend yield. The effect of Local Seniors on the corporate decision to start paying dividends is particularly strong, of the same economic magnitude as other key determinants such as company size and age.
Because demographics are only a rough proxy for demand, our results, in some sense, place a lower bound on the effect of investor preferences on payout policy. If there are other components of demand, the total effect of investor preferences on corporate policies may be larger. Our results are robust to various methodologies and identification strategies, and are not supportive of alternative explanations (for
example, that firms located in the areas with many seniors have low growth opportunities and, therefore, are more likely to pay out cash to shareholders).
The main implication of our findings is that, at least in part, corporations respond to the preferences of their owners when setting payout policy. We confirm that age determines dividend demand, consistent with the hypothesis of Miller and Modigliani (1961) and the evidence presented in Graham and Kumar (2006). We further show that there are dividend clienteles that vary geographically, creating differences in demand for dividends across firms that help explain some of the substantial cross-sectional heterogeneity as to why some companies pay dividends while other do not. Our findings thus suggest that there is important geographical variation in the financial conditions facing firms.
References
Baker, Malcolm, and Jeffrey Wurgler, 2004a, A catering theory of dividends, Journal of Finance 59, 1125-1165.
Baker, Malcolm, and Jeffrey Wurgler, 2004b, Appearing and disappearing dividends: The link to catering incentives, Journal of Financial Economics 73, 271-288.
Barber, Brad, and Terrance Odean, 2000, Trading is hazardous to your wealth: The common stock investment performance of individual investors, Journal of Finance 55, 773-806.
Becker, Bo, 2007, Geographical segmentation of US capital markets, Journal of Financial Economics 85, 151-178.
Brav, Alon, John R. Graham, Campbell R. Harvey, and Roni Michaely, 2005, Payout policy in the 21st century, Journal of Financial Economics 77, 483-527.
Brown, Jeffrey, Nellie Liang, and Scott Weisbenner, 2007, Executive financial incentives and payout policy: Firm responses to the 2003 dividend tax cut, Journal of Finance 62, 1935-1965.
Coval, Joshua D., and Tobias J. Moskowitz, 1999, Home bias at home: Local equity preference in domestic portfolios, Journal of Finance 54, 1–39.
Coval, Joshua D., and Tobias J. Moskowitz, 2001, The geography of investment: Informed trading and asset prices, Journal of Political Economy 109, 811–841.
Elton, Edward J., and Martin J. Gruber, 1970, Marginal stockholder clientele effect, Review of Economics and Statistics 52, 68–74.
Fama, Eugene F., and Kenneth R. French, 2001, Disappearing dividends: Changing firm characteristics or lower propensity to pay?, Journal of Financial Economics 60, 3-43. Graham, John R., 2003, Taxes and corporate finance: A review, Review of Financial
Studies 16, 1074-1128.
Graham, John R., and Alok Kumar, 2006, Do dividend clienteles exist? Evidence on dividend preferences of retail investors, Journal of Finance 59, 1125-1165.
Grinblatt, Mark, and Matti Keloharju, 2001, How distance, language, and culture influence stockholdings and trades, Journal of Finance 56, 1053-1073.
Guiso, Luigi, Paola Sapienza, and Luigi Zingales, 2004, Does local financial development matter?, Quarterly Journal of Economics 119, 929-969.
Hong, Harrison, Jeffrey Kubik, and Jeremy Stein, 2008, The only game in town: Stock-price consequences of local bias, Journal of Financial Economics 90, 20-37.
Huberman, Gur, 2001, Familiarity breeds investment, Review of Financial Studies 14, 659-680.
Ivković, Zoran, James Poterba, and Scott Weisbenner, 2005, Tax-motivated trading by individual investors, American Economic Review 95, 1605-1630.
Ivković, Zoran, and Scott Weisbenner, 2005, Local does as local is: Information content of the geography of individual investors’ common stock investments, Journal of Finance 60, 267-306.
Jayaratne, Jith, and Philip Strahan, 1996, The finance-growth Nexus: Evidence from bank branch deregulation, Quarterly Journal of Economics 111, 639-670.
Lintner, John, 1956, Distribution of incomes of corporations among dividends, retained earnings, and taxes, American Economic Review 46, 97-113.
Loughran, Tim, and Paul Schulz, 2005, Liquidity: Urban versus rural firms, Journal of Financial Economics 78, 341-374.
Massa, Massimo, and Andrei Simonov, 2006, Hedging, familiarity and portfolio choice, Review of Financial Studies 19, 633-685.
Miller, Merton H., and Franco Modigliani, 1961, Dividend policy, growth, and the valuation of shares, Journal of Business 34, 411-433.
Perez-Gonzales, Francisco, 2003, Large shareholders and dividends: Evidence from U.S. tax reforms, Working Paper, Stanford University.
Peterson, Mitchell A., and Raghuram G. Rajan, 2002, Does distance still matter? The information revolution in small business lending, Journal of Finance 57, 2533-2570.
Pirinsky, Christo, and Quinghai Wang, 2006, Does corporate headquarters location matter for stock returns?, Journal of Finance 61, 1991-2015.
Scholz, John K., 1992, A direct examination of the dividend clientele hypothesis, Journal of Public Economics 49, 261–285.
Shefrin, Hersh, and Meir Statman, 1984, Explaining investor preference for cash dividends, Journal of Financial Economics 13, 253-282.
Shefrin, Hersh, and Richard H. Thaler, 1988, The behavioral life-cycle hypothesis, Economic Inquiry 26, 609-643.
Thaler, Richard H., and Hersh M. Shefrin, 1981, An economic theory of self-control, Journal of Political Economy 89, 392–406.
Table I
Summary Statistics for Payout Policy Variables and Key County-Level Variables The sample consists of the pooled cross-section for 1980, 1990, and 2000. Summary statistics for payout policy variables are presented in Panel A. Dividend Payer is an indicator variable equal to 0 for non-payers and equal to 100 for dividend payers. Dividend Initiation is an indicator variable defined for non-payers at the end-of-year t. Its values are 0 for the firms that remain non-payers in year t+1, and 100 for non-payers at the end-of-year t who start to pay a dividend in year t+1. Dividend Yield is the dollar amount of dividends paid out in year t+1 divided by the end-of-year t equity market value. Repurchase Yield is defined analogously for share repurchases in year t+1. Summary statistics for key geographical variables are presented in Panel B. Aside from summary statistics pertaining to Local Seniors (the proportion of residents who are 65 years old or older in the county in which a firm is headquartered, as reported by the U.S. Bureau of Census), the table also lists summary statistics for the number of firms in the county (firms with their headquarters located in the county).
Panel A: Summary Statistics for Payout Policy Variables (in percentage points)
Mean 25
th
Percentile Median 75 th
Percentile Deviation Standard
Dividend Payer 47.4 0 0 100 49.9
Dividend Initiation 2.0 0 0 0 14.2
Dividend Yield 1.9 0 0 3.0 3.7
Repurchase Yield 1.1 0 0 0.4 3.9
Panel B: Summary Statistics for Key County-Level Variables
Mean Min. 25th % Median 75th % Max. Std. Dev.
Local Seniors
(Proportion 65 years +) 0.116 0.022 0.097 0.115 0.132 0.321 0.031 Inverse of Number of
Table II
Dividend Payout and Local Seniors
This table presents OLS regression results for firm dividend payout behavior, estimated over the sample of pooled observations from the 1980, 1990, and 2000 cross-sections. Dependent variables are measured one year after the firm-level and the county-level controls (in 1981, 1991, and 2001, respectively). Dividend Payer is an indicator variable equal to 0 for non-payers and equal to 100 for dividend payers. Dividend Initiation is an indicator variable defined for non-payers at the end-of-year t. Its values are 0 for the firms that remain non-payers in year t+1, and 100 for non-payers at the end-of-year t who start to pay a dividend in year t+1. Dividend Yield is the dollar amount of dividends paid out in year t+1 divided by the end-of-year t equity market value. Our key independent variable is Local Seniors, the fraction of residents who are 65 years old or older in the county in which a firm is headquartered, as reported by the U.S. Bureau of Census. Besides Local Seniors, the regressions include firm-specific controls. Net Income, Cash, and Debt (long-term) are all normalized by total assets. Q is defined as the market-to-book ratio, that is, the market value of equity plus the book value of liabilities (using the book value of liabilities as an approximation for the market value of liabilities) divided by the book value of assets. Volatility refers to the standard deviation of monthly stock returns over the preceding two years. Two-Year Lagged Return refers to monthly stock returns over the preceding two years. Asset Growth is the logarithm of the growth rate of assets over the prior year. Age-group indicator variables (for firms publicly listed 1-5, 6-10, 11-15, 16-20, and 21+ years ago), industry-year interaction indicator variables (fixed effects for 2-digit level SIC industries interacted with year), and state-year interaction indicator variables are included in all three specifications. Standard errors (shown in parentheses) allow for heteroskedasticity and are clustered by firm.