ABSTRACT
MCAREAVY, IAN CRAIG. The Effects of Impervious Surface on Urban Tree Conditions and Pest Abundance, and How Natural Ranges Can Affect Urban Stress. (Under the direction of Dr. Steven Frank).
Urban trees provide numerous benefits for human and environmental health, such as reducing air pollutants, atmosphere cooling, wildlife habits, aesthetic value, and psychological benefits. City trees, however, are often in worse condition than rural trees due to stressful growing conditions and pests, which can reduce these benefits. As the amount of impervious surface around a tree increases, surrounding air temperature rises, soil moisture decreases, pest density increases, and tree quality declines. Often trees in cities are planted outside their natural geographic range, which may further increase stress and pest susceptibility. Understanding the tolerance of different tree species for impervious surfaces could help planting decisions and IPM programs. Furthermore, urban warming effects are similar in magnitude to expected predictions of the next fifty years of climate change. Therefore, the response of trees to urban conditions may help predict the response of forest trees to future climate change.
impervious surface, such as C. florida, to ensure trees survive to provide benefits and reduce replanting costs.
The objective of our second study was to determine how the natural geographic ranges of trees affect their responses to urban stress imposed by impervious surface cover and how tree condition varies between street trees at the fringe of and within their natural geographic range. We studied two common street trees in Raleigh, NC: Quercus rubra, which are at the southern fringe of their range at that location, and Quercus falcata, which are completely within their range. We measured percent impervious surface cover, tree condition, water potential, pest density, and leaf damage of both species across a gradient of impervious surface cover and in forest habitats. GIS-based assessments of proportion impervious surface cover were also conducted and paired with tree conditions from a database maintained by the city of Raleigh. Impervious surface was a significant, although weak, influence on tree condition for both species. Scale density increased, and water potential decreased, with impervious surface cover, consistent with the model that impervious surface leads to tree stress. Water potentials for Q. rubra were
© Copyright 2019 by Ian McAreavy
The Effects of Impervious Surface on Urban Tree Conditions and Pest Abundance, and How
Natural Ranges Can Affect Urban Stress.
by
Ian Craig McAreavy
A thesis submitted to the Graduate Faculty of
North Carolina State University
in partial fulfillment of the
requirements for the degree of
Masters
Entomology
Raleigh, North Carolina
2019
APPROVED BY:
_______________________________
_______________________________
Steven Frank Rick Brandenburg
Committee Chair
ii
BIOGRAPHYIan McAreavy was born and raised in Charlotte, North Carolina and graduated from Weddington High School in Weddington, NC in 2008. For his undergraduate degree, Ian went to North Carolina State University in Zoology and graduated in 2012. Through his undergraduate studies, he learned about both
vertebrate and invertebrate animals. After graduating he returned to Charlotte to work for a science museum and educate others on the wonders of the animal kingdom. In 2015 Ian moved back to Raleigh to work for the Entomology department at NCSU and eventually was taken on by Steve Frank for a master’s
iii
ACKNOWLEDGMENTSAll this work would not have been possible without the support and care from my loving family. I would also like to thank Steve Frank for all the patience and help he’s given me throughout my master’s studies.
I would like to thank my lab mates for their support, guidance on statistical methods, and letting me bounce ideas off them. I would also like to specifically thank both Brian Royals and Terri Billeisen -
iv
TABLE OF CONTENTSLIST OF TABLES..…….……… v
LIST OF FIGURES………..vi
Chapter 1: Relationships between impervious surface cover, scale insect density, and the condition of common street tree species………1
Abstract……… 1
Introduction……….. 2
Methods……… 4
Onsite assessments of tree condition and scale infestation………. 4
GIS analyses of impervious surface cover and tree condition……… 6
Statistical analyses of onsite assessments………... 6
Statistical analyses of GIS assessments………... 6
Results ………. 7
Onsite assessments of tree condition and scale infestation………. 7
GIS analyses of impervious surface cover and tree condition……… 8
Discussion……… 8
References………...11
Tables………..15
Figures……… 16
Chapter 2: Effects of geographic range on urban tree stress and pest infestations………... 21
Abstract………... 21
Introduction……… 22
Methods……….. 25
Study system……….. 25
GIS analyses of impervious surface cover and tree condition………...25
Onsite assessments of tree condition, scale density, water potential, and leaf damage………… 25
Statistical analysis of GIS assessments………. 27
Statistical analysis of onsite assessments……….. 28
Results ………... 28
GIS assessments……… 28
Onsite assessments……… 28
Discussion………...31
References……….. 35
Tables………..39
v
LIST OF TABLESTable 1.1 Number of trees for each species used in on site and GIS analyses that
were in Excellent, Good, Fair, and Poor condition….……… 15 Table 2.1 Conditions of Q. falcata and Q. rubra urban and forest trees used in on
vi
LIST OF FIGURESFigure 1.1 Relationship of scale insect density transformed using log(x+1) and impervious surface estimations using Pace-to-Plant of C. florida,
Q. palustris, Q. phellos, and U. americana…..…...………... 16 Figure 1.2 Impervious surface cover threshold for Q. phellos plantings using
Pace-to-Plant and mean scale density threshold for C. florida plantings………... 17 Figure 1.3 Relationship of tree condition and mean scale density of C. florida,
Q. palustris, Q. phellos, and U. americana analyzed using ordinal
logistic regression……….…...………... 18 Figure 1.4 Relationship of tree condition and impervious surface estimations using
ArcGIS of C. florida, Q. palustris, Q. phellos, and U. americana………...…………... 19 Figure 1.5 Impervious surface cover threshold for Q. palustris, Q. phellos, and
U. americanaplantings using ArcGIS………..…...………... 20
Figure 2.1 Q. falcata range map….………..………40
Figure 2.2 Q. rubra range map………..…...………... 40 Figure 2.3 Examples of types of leaf damage assessed on Q. falcata and Q. rubra…..…………..41 Figure 2.4 Relationship of tree condition and Impervious surface estimations using
ArcGIS of Q. falcata and Q. rubra plots……..…...………... 41 Figure 2.5 Impervious surface cover threshold for Q. falcata, and Q. rubra
plantings using ArcGIS………..…...………... 42 Figure 2.6 Relationship of tree condition and Impervious surface estimations
using Pace-to-Plant of Q. falcata and Q. rubra plots………...….. 43 Figure 2.7 Interaction Plots for log-transformed scale density……....………... 43 Figure 2.8 Scale density versus impervious surface estimations using
Pace-to-Plant method……..………..…...………... 44 Figure 2.9 Relationship of tree condition and mean scale density of
Q. falcata and Q. rubra………..…..…...………... 44 Figure 2.10 Interaction Plots for water potential during both the early
summer and late summer……….………... 45 Figure 2.11 First summer 2018 session of water potential of Q. falcata and
Q. rubra plots versus impervious surface estimations using
vii
Figure 2.12 Second summer 2018 session of water potential ofQ. falcata and Q. rubra plots versus impervious surface
1
CHAPTER 1: Relationships between impervious surface cover, scale insect density, and thecondition of common street tree species Abstract
2
IntroductionUrban trees provide numerous benefits for human and environmental health. Urban trees remove air pollutants, cool the atmosphere, provide wildlife habitat, and create a more aesthetically pleasing and psychologically beneficial environment (Nowak 2000, Beyer et al. 2014, Keniger et al. 2013, Fuller et al. 2007, White 2013). Unfortunately, urban trees are often in worse condition, or overall appearance and health, than rural trees due to low water intake, low soil moisture, and high ambient air temperature and pest density (Clark et al. 1990, Cregg et al. 2001). A key to sustainable urban tree management is to identify planting sites that will minimize biotic and abiotic stressors and reduce maintenance, pesticide, and replanting costs.
City trees are often surrounded by impervious surfaces, such as cement, asphalt, and brick, that comprise roads, parking lots, and buildings. Impervious surfaces reduce the amount of water that can reach the underlying soil, and soil under impervious surfaces is often compacted (Grabosky et al., 2001). These conditions make it difficult for roots to penetrate soil and subject trees to drought-like conditions (Grabosky et al., 2001, Oke et al. 1989; Savi et al. 2014).Impervious surfaces and buildings also increase air temperature by absorbing solar radiation and reradiating it as heat. The temperature change, known as the “urban heat island effect”, results in air temperatures up to 10℃ higher than surrounding rural areas (Kim 1992, Oke 1973, Imhoff et al. 2010). Urban warming increases water demand, exacerbating the drought stress caused by low soil moisture (Clark et al. 1990, Meineke et al. 2018, Way et al. 2010). Heat and drought stress can reduce photosynthesis due to stomatal closure, lower transpiration rates, and damage to photosynthetic machinery (Adams et al. 2013, Leininger 1998, Maherali et al. 2004, Savi et al. 2014). Drought conditions increase xylem tension and the likelihood of cavitation, which prevents xylem transport by the cavitated conduit (Maherali et al. 2004). Higher temperatures and drought stress thus combine to reduce tree growth and condition (Adam et al. 2013, 2015, Allen et al. 2010, Meineke et al. 2018, Meineke et al. 2016 Williams et al. 2013).
3
2015, 2017, Dale et al. 2014b, Meineke et al. 2013, Metcalf 1912, Frank in press). Scale insects feed in vascular or parenchyma tissue, causing damage such as leaf discoloration, canopy thinning, premature leaf drop, slow growth, and branch dieback (Camacho et al. 2015, Frank et al. 2013, Miller et al. 2005). Warmer temperatures can directly increase scale density by increasing developmental rate, survival, and fecundity (Berger et al. 2008, Dale et al. 2014a, 2014b 2017, Meineke et al. 2013, Pressier et al. 2008). Indirectly, warming and drought can increase pest density by increasing nutrition available to pests or reducing plant defenses (McClure 1980, Raupp et al. 2010, White 1974). Water-stressed trees consolidate nutrients into branches, providing a richer food source for scales and other phytophagous insects (White 1974, White 1984). Sap-feeding insects in particular can benefit from “pulsed stress”, or alternating periods of stress and recovery, which is often experienced by urban trees (Huberty et al. 2004, Krizek et al. 1987, Raupp et al. 2010). This can increase the growth, fecundity, and survival of scale insects and related herbivores common on urban trees (Dale et al. 2014a, 2014b, 2017, Huberty et al. 2004, Raupp et al. 2010, Tariq et al. 2012).Appropriate species selection and placement has been proposed as a method of controlling detrimental effects of impervious surfaces on urban tree condition (Dale et al. 2017, Percival et al. 2006) yet the effects of impervious surface cover on the pest density and condition of most urban trees have not been investigated. The positive relationship between temperature, drought stress, pest density, and
impervious surface cover has been well-established for red maples and some other tree species (Dale et al. 2014b, 2017). For red maples, this relationship was consistent enough that the proportion of impervious surface cover within 20m of a tree could be used to predict a tree’s condition based on a common arboricultural rating system of poor, fair, good, and excellent (Dale et al. 2014a, Just et al. 2018). Trees surrounded by up to 32% impervious surface at 20m radius are generally in excellent to good condition while those surrounded by 33-62% impervious surface tend to be in good to fair condition. Above 62% impervious surface, trees are most likely to be in poor condition (Dale et al. 2016, Just et al. 2018).
4
States. Our objective was to determine the relationships among impervious surface cover, scale insect density, and the condition of four common urban tree species (Cornus florida, Quercus palustris, Quercus phellos, Ulmus americana) to inform planting decisions for these species. Impervious surface cover should impose similar levels of temperature and drought stress on all species, but species likely vary in their tolerance to these stressors. Thus, our hypothesis was that with greater proportions of impervious surface cover, trees would have greater scale insect density and be in worse condition, but that the extent of these responses would vary by species. To test this hypothesis we 1) assessed scale density and condition of trees in each species across a gradient of impervious surface cover and 2) assessed impervious surface cover around trees of each species using GIS analyses and compared this data to assessments of tree condition in a city-maintained database in Raleigh, North Carolina. Understanding how impervious surface cover affects the condition of city trees will improve how we select, care for, and preserve these trees.Methods
Onsite assessments of tree condition and scale infestation. We conducted our research in
Raleigh, North Carolina, USA (35.78° N, 78.64° W) a city in the southeastern US with a humid
5
We visited each U. americana, Q. palustris, and Q. phellos between June and September 2017, and each C. florida between January and February 2018. For each tree we measured diameter at breast height (DBH) using a DBH tape (Forestry Supplies Inc., Jackson, MS) and assessed tree condition (Table 1), using an ordinal rating system similar to that of the City of Raleigh and previous research (Dale et al. 2014a, Just et al. 2018). This assessment is based on a scale of four condition ratings: poor, fair, good, and excellent. The assessment considers tree canopy fullness, leaf health, trunk condition, and branch health. We measured the proportion of impervious surface cover within ~ 20 m of each tree using the “Pace to Plant” technique (Dale et al. 2016). To implement this technique the observer takes 25 steps in a transect from the base of the tree at a 45 degree angle to the nearest impervious edge counting how many footfalls land on impervious surfaces. Then the observer returns to the tree, turns 90 degrees to the original transect, and walks a second transect of 25 steps. The observer repeats this process two more times, walking a total of 4 transects. The proportion of impervious cover is estimated as the number of paces which fall on impervious surface divided by the total number of steps (100). This technique produces results highly correlated with those of GIS-based analyses (Dale et al. 2016, Just et al. 2018).We also assessed scale density on each tree for U. americana, Q. palustris, and Q. phellos between June and September 2017, and between January and February 2018 for C. florida. We pruned one twig from each cardinal direction of each tree with a pole pruner. To avoid biased selection, only twigs 3 meters or higher off the ground were selected, as scale insects at this height are not visually discernible. We removed new growth distal to the most recent bud from each twig then trimmed the remaining twig to 30 cm. Twigs were inspected under a dissecting scope. Live scale insects (Coccoidea) were counted and identified to family. We took the mean of all four twigs to obtain the average scale density per 30 cm and then averaged these counts between our sample dates to use for analysis. We repeated scale assessments between January and February 2018 for U. americana, Q. palustris, and Q. phellos, and between July and August 2018 for C. florida.
GIS analyses of impervious surface cover and tree condition. We randomly selected 80 trees of
6
was selected using the “create random points” tool in ArcGIS and were at least 50 m apart. Impervious surface area within a 20m radius buffer around each tree was measured using ArcGIS (Version 10.5.1). Using the Esri Imagery basemap file, each tree was surrounded by a 20m radius buffer (Esri). All impervious surfaces within the buffer were outlined by hand using the straight segment editing tool and then total area of impervious surface was calculated and compared to the total area of the buffer to create the percent impervious surface surrounding the tree. The condition of each tree in the database had been recorded in the previous 5 years by an arborist or trained volunteer (Table 1).Statistical analyses of onsite assessments. For each tree species in the onsite observations, simple
linear regression was used (JMP Pro 11) to determine the relationships between scale insect density and impervious surface cover. After inspecting residual plots, we determined scale counts must be log10(x+1)
transformed to meet assumptions of linear regression.Ordinal logistic regression was used (JMP Pro 11) to determine how scale insect density or impervious surface cover predicted tree condition for each species.
We used the probability formulas generated by the ordinal logistic regression to calculate the probability a tree would fall into each condition (Excellent, Good, Fair, or Poor) given percent impervious surface cover from 0-100%. We established surface cover thresholds by calculating the range of
impervious surface cover percentages at which the most likely condition changed (Dale et al. 2016). We repeated this analysis using log-transformed scale density from 0-6 (representing the range of scale density encountered during field sampling).
Statistical analyses of GIS assessments. Ordinal logistic regression was used (JMP Pro 11) to
0-7
100%. We established surface cover thresholds by calculating the surface cover percentage at which the most likely condition changed.Results
Onsite assessments of tree condition and scale infestation. Overall percent impervious surface
cover ranged from 0% to 92% with a mean of 45.18 (±17.86). Average scale densities per 30 cm of twig ranged from 0 to 1037 with a mean of 25.36 (±100.36). 68% of scales found on U. americana were armored scales (Diaspididae), and the remaining 32% were soft scales (Coccidae). 82% of scales found on C. florida were armored scales (Diaspididae), and the remaining 18% were a type of soft scale (Coccidae). 99% of scales found on Q. palustris were armored scales (Diaspididae), and the other 1% were soft scales (Coccidae). 78% of scales found on Q. phellos were armored scales (Diaspididae), and the remaining 22% were soft scales (Coccidae).Tree condition was negatively related to percent impervious surface cover for Q. phellos (R2=0.1773, P=0.0007, Fig. 1), but not for C. florida (R2=0.007,
P=0.5258, Fig. 1), Q. palustris (R2=0.0228, P=0.2245, Fig.1), and U. americana (R2=0.0166, P=0.3204,
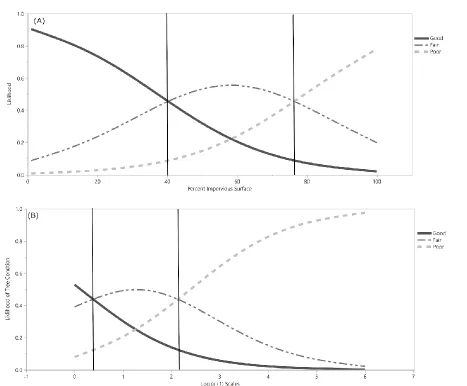
Fig. 1). According to threshold calculations from the probability formulas generated by logistic regression and Pace-to-Plant measurements, Q. phellos trees were most likely to be in good condition at sites with 0% to 40% impervious surface cover. Trees were most likely to be in fair condition between 40% and 77% impervious surface cover (Fig. 2).
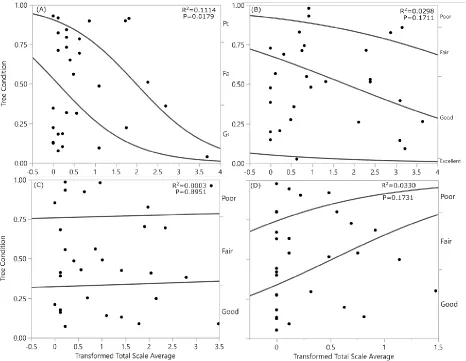
Scale density was significantly related to C. florida condition (R2=0.1114, P=0.0179, Fig. 3) but
scale density was not significantly related to the condition of Q. palustris (R2=0.0298, P=0.1711),
Q.phellos (R2=0.0019, P=0.7224), or U. americana (R2=0.0330, P=0.1731). According to threshold
calculations from the probability formulas generated by logistic regression and Pace-to-Plant
8
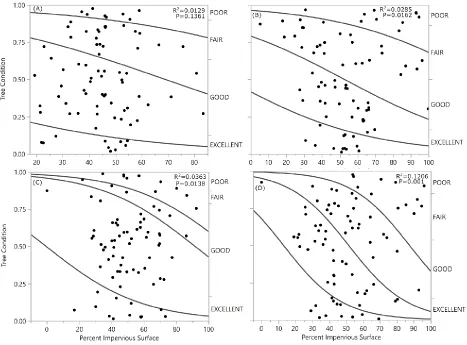
GIS analyses of impervious surface cover and tree condition. Percent impervious surface
measured using GIS was negatively related to condition of U. americana (R2=0.1206, P<0.0001), Q.
palustris (R2=0.0285, P=0.0149), Q. phellos (R2=0.0596, P=0.0006),but not C. florida (R2=0.0129,
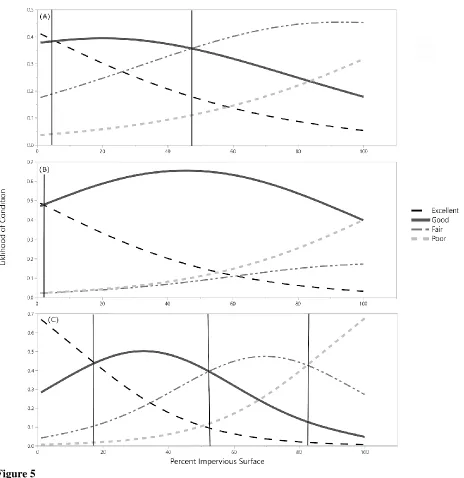
P=0.1361) (Fig. 4). U. americana trees were most likely to be in Excellent condition when surrounded by less than 18% impervious surface, in Good condition between 18 and 52%, in Fair condition between 52 and 83%, and in Poor condition above 83% impervious surface (Fig. 5). Q. palustris trees were most likely to be in Excellent condition when surrounded by less than 48% impervious surface, in Good condition between 48 and 65%, and in Fair condition above 65% impervious surface (Fig. 5). For Q. phellos, trees were most likely to be in Good condition when surrounded by less than 98% impervious surface, and in Poor condition above 98% impervious surface (Fig. 5).
Discussion
Urban trees provide ecosystem services to urban residents, but their condition can worsen and services decline due to warming and drought conditions caused by impervious surface cover (Dale 2014a, Meineke et al. 2018, Savi et al. 2014). Understanding relationships between impervious surface cover and condition of urban tree species will help city planners select species that will thrive in different urban sites and provide maximum benefits. We found that tree condition was negatively related to percent
9
of C. florida is not affected by impervious surface, this species will be more likely to survive in these locations and provide benefits.We hypothesized that with greater proportions of impervious surface cover, trees would have greater scale insect density and be in worse condition, but the extent of these responses would vary by species. None of our on-site observations supported this hypothesis. Previous research that investigated Parthenolecaniumspp. scales on urban Q. phellos treesfound scale density and impervious surface were positively correlated (Meineke et al. 2013, 2018). We found a negative relationship between impervious surface and Q. phellos condition; however, we did not find a significant relationship between impervious surface and scale density. The differences in our findings in regards to scale density could be due to the species of scales recorded or the water stress of study trees. While the previous study focused on Parthenolecanium scales, we recorded all scales and may have recorded the net effect of species with different relationships to impervious surface. Q. phellos naturally inhabit areas that have deep soil and high moisture availability, and thus they are commonly found in lowland floodplains or along streams and rivers (Godfrey 1981, Schlaegel 1990). It is expected that the condition of Q. phellos is negatively
affected by the drought-like conditions created by impervious surface cover, considering their high water demand in their natural environment.For both our onsite and GIS analysis, we observed that percent impervious surface and tree condition were negatively related. Contradictorily, we also observed evidence of impervious surface tolerance in Q. phellos. Very few trees in poor condition were observed during onsite analysis, and GIS analysis indicated Q. phellos was most likely to be in good condition at any proportion of impervious surface. A possible reason for these differences is the proportion of conditions present for our GIS trees, where 50 of the 80 trees were in good condition, compared to the 9 good conditioned trees in our onsite observations. Updating the GIS sampled tree condition by visiting them onsite or increasing the number of onsite samples could contribute to a better understanding of the condition distribution of Q. phellos.
11
REFERENCESAdams, H.D., Germino, M.J., Breshears, D.D/, Barron-Gafford, G.A.,Guardiola-Claramonte, M., Zou, C.B., Huxman, T.E., 2013. Nonstructural leaf carbohydrate dynamics of Pinus edulis during drought-induced tree mortality reveal role for carbon metabolism in mortality mechanism. New Phytologist, 197(4), pp. 1142–1151.
Adams, H.D., Collins, A.D., Briggs, S.P., Vennetier, M., Dickman, L.T., Sevanto, S.A., Garcia‐Forner, N., Powers, H.H. and McDowell, N.G., 2015. Experimental drought and heat can delay
phenological development and reduce foliar and shoot growth in semiarid trees. Global change biology, 21(11), pp.4210-4220.
Allen, C.D., Macalady, A.K., Chenchouni, H., Bachelet, D., McDowell, N., Vennetier, M., Kitzberger, T., Rigling, A., Breshears, D.D., Hogg, E.T. and Gonzalez, P., 2010. A global overview of drought and heat-induced tree mortality reveals emerging climate change risks for forests. Forest ecology and management, 259(4), pp.660-684.
Berger, D., Walters, R. and Gotthard, K., 2008. What limits insect fecundity? Body size‐and temperature‐ dependent egg maturation and oviposition in a butterfly. Functional Ecology, 22(3), pp.523-529. Bey, C.F., 1990. Ulmus americana L. American elm. Silvics of North America, 2, pp.801-807.
Beyer, K.M., Kaltenbach, A., Szabo, A., Bogar, S., Nieto, F.J. and Malecki, K.M., 2014. Exposure to neighborhood green space and mental health: evidence from the survey of the health of Wisconsin. International journal of environmental research and public health, 11(3), pp.3453-3472.
Camacho, E.R. and Chong, J.H., 2015. General biology and current management approaches of soft scale pests (Hemiptera: Coccidae). Journal of integrated pest management, 6(1), p.17.
Camacho, E.R., Chong, J.H., Braman, S.K., Frank, S.D. and Schultz, P.B., 2017. Life history of Parthenolecanium spp.(Hemiptera: Coccidae) in urban landscapes of the southeastern United States. Journal of economic entomology, 110(4), pp.1668-1675.
Clark, J.R. and Kjelgren, R., 1990. Water as a limiting factor in the development of urban trees. J. Arboric, 16(8), pp.203-208.
Cregg, B.M. and Dix, M.E., 2001. Tree moisture stress and insect damage in urban areas in relation to heat island effects. Journal of Arboriculture, 27(1), pp.8-17.
Dale, A.G. and Frank, S.D., 2014a. The effects of urban warming on herbivore abundance and street tree condition. PLoS One, 9(7), p.e102996.
Dale, A.G. and Frank, S.D., 2014b. Urban warming trumps natural enemy regulation of herbivorous pests. Ecological Applications, 24(7), pp.1596-1607.
Dale, AG, Youngsteadt, E and Frank, SD. 2016. Forecasting the effects of heat and pests on urban trees: Impervious surface thresholds and the ‘Pace to Plant’ technique. Arboriculture &
12
Dale, A.G. and Frank, S.D., 2017. Warming and drought combine to increase pest insect fitness on urbantrees. PloS one, 12(3), p.e0173844.
Ehler, L.E., 1995. Biological control of obscure scale (Homoptera: Diaspididae) in California: an experimental approach. Environmental entomology, 24(4), pp.779-795.
Esri. “World Imagery” [basemap]. 1m Scale. “World Imagery” Dec 12, 2009.
http://www.arcgis.com/home/item.html?id=10df2279f9684e4a9f6a7f08febac2a9. (September 23, 2018).
Frank, S.D., Klingeman III, W.E., White, S.A. and Fulcher, A., 2013. Biology, injury, and management of maple tree pests in nurseries and urban landscapes. Journal of Integrated Pest Management, 4(1), pp.B1-B14.
Fuller, R.A., Irvine, K.N., Devine-Wright, P., Warren, P.H. and Gaston, K.J., 2007. Psychological benefits of greenspace increase with biodiversity. Biology letters, 3(4), pp.390-394.
Grabosky, J., Bassuk, N., Irwin, L. and Van Es, H., 2001. Shoot and root growth of three tree species in sidewalks. Journal of Environmental Horticulture, 19(4), pp.206-211.
Godfrey, R.K., 1981. Aquatic and wetland plants of southeastern United States: Dicotyledons (Vol. 2). University of Georgia Press. pp. 48-49
Hinckley, T.M., Dougherty, P.M., Lassoie, J.P., Roberts, J.E. and Teskey, R.O., 1979. A severe drought: impact on tree growth, phenology, net photosynthetic rate and water relations. American Midland Naturalist, pp.307-316.
Huberty, A.F. and Denno, R.F., 2004. Plant water stress and its consequences for herbivorous insects: a new synthesis. Ecology, 85(5), pp.1383-1398.
Imhoff, M.L., Zhang, P., Wolfe, R.E. and Bounoua, L., 2010. Remote sensing of the urban heat island effect across biomes in the continental USA. Remote sensing of environment, 114(3), pp.504-513. Just, M.G., Frank, S.D. and Dale, A.G., 2018. Impervious surface thresholds for urban tree site
selection. Urban Forestry & Urban Greening.
Keniger, L.E., Gaston, K.J., Irvine, K.N. and Fuller, R.A., 2013. What are the benefits of interacting with nature?. International journal of environmental research and public health, 10(3), pp.913-935. Kim, H.H., 1992. Urban heat island. International Journal of Remote Sensing, 13(12), pp. 2319-2336. Krizek DT, Dubik SP. 1987. Influence of water stress and restricted root volume on growth and
development of urban trees. Journal of Arboriculture 13:47–55
13
Maherali, H., Pockman, W. T., & Jackson, R. B., 2004. Adaptive variation in the vulnerability of woodyplants to xylem cavitation. Ecology, 85(8), pp. 2184–2199.
McClure, M.S., 1980. Foliar nitrogen: a basis for host suitability for elongate hemlock scale, Fiorinia externa (Homoptera: Diaspididae). Ecology, 61(1), pp.72-79.
McLemore, B.F., 1990. Cornus florida L. flowering dogwood. Silvics of North America, 2(654), p.278. Meineke, E.K., Dunn, R.R., Sexton, J.O. and Frank, S.D., 2013. Urban warming drives insect pest
abundance on street trees. PloS one, 8(3), p.e59687.
Meineke, E., Youngsteadt, E., Dunn, R.R. and Frank, S.D., 2016. Urban warming reduces aboveground carbon storage. Proc. R. Soc. B, 283(1840), p.20161574.
Meineke, E.K. and Frank, S.D., 2018. Water availability drives urban tree growth responses to herbivory and warming. Journal of Applied Ecology, 55(4), pp.1701-1713.
Metcalf, Z.P., 1912. The gloomy scale, an important enemy of shade trees in North Carolina. Journal of the Elisha Mitchell Scientific Society, 28(2), pp.88-91.
Miller, D.R. and Davidson, J.A., 2005. Armored scale insect pests of trees and shrubs (Hemiptera: Diaspididae). Cornell University Press.
Nowak, D.J. and Dwyer, J.F., 2007. Understanding the benefits and costs of urban forest ecosystems. In Urban and community forestry in the northeast (pp. 25-46). Springer, Dordrecht.
Oke, T.R., 1973. City size and the urban heat island. Atmospheric Environment (1967), 7(8), pp.769-779. Oke, T.R., 1989. The micrometeorology of the urban forest. Phil. Trans. R. Soc. Lond. B, 324(1223),
pp.335-349.
Percival, G.C., Keary, I.P. and Sulaiman, A.H., 2006. An assessment of the drought tolerance of Fraxinus genotypes for urban landscape plantings. Urban Forestry & Urban Greening, 5(1), pp.17-27. Potter, D.A. and Redmond, C.T., 2013. Relative resistance or susceptibility of landscape-suitable elms
(Ulmus spp.) to multiple insect pests. Arboricult. Urban For, 39, pp.236-243.
Pressier, E.L., Elkinton, J.S., Abell, K, 2008. Evolution of increased cold tolerance during range expansion of the elongate hemlock scale Fiorina externa Ferris (Hemiptera: Diaspididae). Ecological Entomology, 33(6), pp. 709-715.
Raupp, M.J., Shrewsbury, P.M. and Herms, D.A., 2010. Ecology of herbivorous arthropods in urban landscapes. Annual review of entomology, 55.
Savi, T., Bertuzzi, S., Branca, S., Tretiach, M. and Nardini, A., 2015. Drought‐induced xylem cavitation and hydraulic deterioration: risk factors for urban trees under climate change?. New Phytologist, 205(3), pp.1106-1116.
14
Stoetzel, M.B. and Davidson, J.A., 1971. Biology of the obscure scale, Melanaspis obscura (Homoptera:Diaspididae), on pin oak in Maryland. Annals of the Entomological Society of America, 64(1), pp.45-50.
Tariq, M., Wright, D.J., Rossiter, J.T. and Staley, J.T., 2012. Aphids in a changing world: testing the plant stress, plant vigour and pulsed stress hypotheses. Agricultural and Forest Entomology, 14(2), pp.177-185.
Way, D.A. and Oren, R., 2010. Differential responses to changes in growth temperature between trees from different functional groups and biomes: a review and synthesis of data. Tree physiology, 30(6), pp.669-688.
White, M.P., Alcock, I., Wheeler, B.W. and Depledge, M.H., 2013. Would you be happier living in a greener urban area? A fixed-effects analysis of panel data. Psychological science, 24(6), pp.920-928.
White, T.C.R., 1974. A hypothesis to explain outbreaks of looper caterpillars, with special reference to populations of Selidosema suavis in a plantation of Pinus radiata in New Zealand. Oecologia, 16(4), pp.279-301.
White, T.T., 1984. The abundance of invertebrate herbivores in relation to the availability of nitrogen in stressed food plants. Oecologia, 63(1), pp.90-105.
15
TablesTable 1: Number of trees for each species used in on site and GIS analyses that were in Excellent, Good, Fair, and Poor condition.
Tree species (Study)
No. of Excellent Condition
No. of Good Condition
No. of Fair Condition
No. of Poor Condition C. florida (On
site)
0 11 12 7
C. florida (GIS) 10 41 21 8
Q. palustris (On site)
1 16 9 4
Q. palustris (GIS) 13 27 29 11
Q. phellos (On site)
0 9 19 2
Q. phellos (GIS) 13 50 7 10
U. americana (On site)
0 13 11 6
U. americana (GIS)
16
FiguresFigure 1
17
Figure 218
Figure 319
Figure 4Relationship of tree condition and impervious surface estimations using ArcGIS of C. florida (A), Q.
palustris (B), Q. phellos (C), and U. americana (D). Relationship was created using ordinal logistic
20
Figure 521
CHAPTER 2: Effects of geographic range on urban tree stress and pest infestationsAbstract
22
IntroductionTemperature, elevation, natural barriers, competition, and interference from other flora and fauna may influence the geographic range of trees (Sexton et al. 2009). Climate affects many aspects of tree physiology and fitness and has an important role in determining range (Loehle 1998). Trees outside their natural range tend to grow slower and exhibit lower survival rates when compared to trees within their natural range (Angert et al. 2005, Sexton et al. 2009). Trees growing in areas colder than their geographic range (i.e., higher latitude areas) can be limited by frost damage, desiccation, sterilization, slower growth rate, or shorter growing season length (Billings 1987, Clausen 1963, Loehle 1998, Normand et al. 2009, Pederson et al. 2004, Pigott et al. 1981). Trees growing in lower latitudes than their geographic range are limited by biotic effects like competition but can also be negatively influenced by abiotic stressors like lower photosynthetic rates, drought stress, or soil composition (Loehle 1998, Maherali et al. 2004, Normand et al. 2009, Sexton et al. 2009, Wertin et al. 2011). For example, lodgepole pines (Pinus contorta), a northern hemisphere species, are limited at their northern edge by snow damage which can break limbs, and frost damage that can rupture plant cells and stunt growth that, in extreme cases, can kill the tree. They are limited at their southern edge by douglas firs (Pseudotsuga menziesii) and other quick growing trees (Loehle 1998, Ying 1991). Climate changes due to elevation, latitude, or other variables can also affect tree performance within the contiguous range of a tree species (Angert et al. 2005, Holzinger et. al 2008). Predicted climate change will increase temperatures throughout the ranges of many tree species which could create stress for trees already growing in warmer parts of their range (Iverson et al. 2001, Wertin et al. 2011) but could boost growth of trees in colder areas if they were previously inhibited by cold intolerance (Iverson et al. 2001, McKenney et al. 2007).
23
have higher CO2 concentrations, and extended drought periods, all of which are predicted in future climatechange models (Lahr et al. 2018). Therefore, the response of trees to urban conditions may help predict the response of forest trees to future climate change. If a tree’s growth at the poleward edge of its range is limited by cold intolerance, warming due to climate change could benefit the tree by creating a longer, warmer growing season (McKinney 2006). On the other hand, if a tree’s growth at the equatorial edge of its range is limited by heat intolerance, warming could increase thermal damage and drought stress (Wertin et al. 2011).
Tree species selection for urban planting is based on aesthetics, drought tolerance, economic cost, and other variables, and many trees are planted outside of their natural geographic range (Almas et al. 2016, Crous et al. 2013, Moll et al. 1992, Sjöman et al. 2015, Ware 1994). In the United States this includes trees from other continents but also species, such as Acer rubrum and Ulmus americana, that are native to the United States but frequently planted outside their natural range (DeCandido et al. 2004, McKinney 2006). Urban trees are exposed to higher temperatures and drought conditions caused by impervious surfaces, which lead to stress (Oke 1973, Kim 1992, Nowak and Dwyer 2007, Clark et al. 1990, Meineke et al. 2018, Way et al. 2010). The compacted ground typically found under impervious surfaces prevents water absorption by soil as well as root growth, thus trees planted near impervious surfaces have both reduced access to water and a lack of roots to absorb it (Grabosky et al., 2001, Oke et al. 1989; Savi et al. 2014). With the addition of heat from urban warming, trees planted in the lower latitudes of their range will experience temperatures higher than those in their natural range, and therefore should suffer more detrimental effects due to heat, drought, and pests than trees planted in the middle of their range.
24
to warming, drought, or both, as stress can increase plant quality by increasing nutrition for herbivores or by reducing plant defenses (Jactel et. al 2012). Herbivorous arthropods such as Lepidoptera, Coleoptera, and Diptera cause leaf damage by chewing and consuming leaf tissue. This type of damage can introduce pathogens and reduce leaf area available for photosynthesis which reduces growth, and in some cases, increases mortality rates (Dreistadt 2016, Hoogesteger 1992, Kulman 1971, Heichel 1894, Hoogesteger 1992, McGraw 1990). Sap-feeding arthropods such as Coccoidea, Aphidoidea, and Cercopidae, consume dissolved nutrients from the xylem and parenchyma tissue; both of these effects can be detrimental to a tree’s health and reduce growth (Barney 2011, Dreistadt 2016, Johnson 2001, Metcalf 1912, Schultz 1982, Zvereva et al. 2010). Scale insects (Coccoidea), which are among the most common and damaging sap-feeding urban tree pests, may increase with climate change (Dale et al. 2014, Frank in press, Meineke et al. 2013, Metcalf 1912, Youngsteadt et al. 2015). Scales stunt growth as they feed by removingnutrients, which trees allocated energy to produce for later use, and damaging vascular tissue with toxic saliva (Dreistadt, 2016, Metcalf 1912). Preventing infestations or reducing pest abundance is thus critical for maintaining urban trees in good condition.
25
MethodsStudy system. Northern red oak (Quercus rubra) and southern red oak (Quercus falcata) are
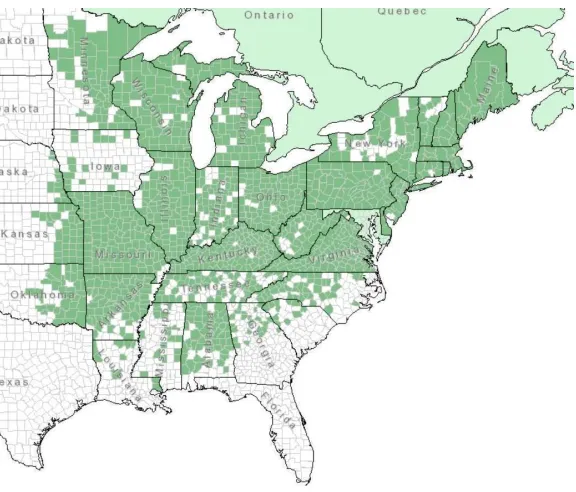
commonly planted as street trees in the southeastern United States. The range of Q. rubra extends from Georgia to Maine in the northeastern United States, with its southeastern border in North Carolina (Fig. 1-2) (USDA 2018). The range of Q. falcata is from Florida to New Jersey in the southeastern United States (Fig. 1) (USDA 2018). The northern edge of the Q. falcata range and the southern edge of the Q. rubra range overlap in North Carolina (Fig. 2) (USDA 2018). The geographic center of Q. rubra is around 47° latitude with average annual temp of 4 °C in the northern extent of the range and 16 °C in the southern extent (Sander 1990). The center of Q. falcata is around 35° latitude with average annual temp of 13 °C in the northern extent of the range and 18 °C in the southern extent (Belanger 1990). Both species host similar pests, such as oak lace bug (Corythucha arcuata), gypsy moth (Lymantria dispar), oak lecanium scales (Parthenolecanium quercifex), obscure scales (Melanaspis obscura), and both are more susceptible to them in urban areas.
GIS analyses of impervious surface cover and tree condition. We selected 80 random urban
trees of each species for GIS impervious surface analysis using the City of Raleigh GIS Tree database. Impervious surface area within a 20m radius buffer around each tree was measured using ArcGIS (Version 10.5.1). Using the Esri Imagery map file, each tree was surrounded by a 20m radius buffer. Impervious surface cover was delineated at a 1 m resolution and included buildings, cement, and asphalt (Esri). The condition of each tree in the database had been recorded in the previous 5 years by an arborist or trained volunteer (Table 1).
Onsite assessments of tree condition, scale density, water potential, and leaf damage. In January
26
the city of Raleigh or North Carolina State University, sampled with permission, and were at least 50 m apart.We measured tree diameter at breast height (DBH) between January and February 2018 using a DBH tape (Forestry Supplies Inc., Jackson, MS). We used an ordinal rating system similar to that of the City of Raleigh and previous research (Dale and Frank, 2014) to assess tree condition. Each tree was rated poor, fair, good, or excellent considering tree canopy fullness, leaf health, trunk condition, and branch health. Tree condition assessments were conducted initially by the City of Raleigh arborists or trained volunteers. We reassessed each tree.
We assessed the proportion of impervious surface cover around each tree using the “Pace to Plant” technique between January and February 2018 (Dale et al., 2016). This technique measures the proportion of impervious cover within ~ 20 m of the tree. The observer takes 25 steps in a transect from the base of the tree at a 45 degree angle to the nearest impervious surface counting how many foot falls land on impervious surfaces. Then the observer returns to the tree, turns 90 degrees to the original transect, and walks a second transect of 25 steps. The observer repeats this process two more times, walking a total of 4 transects. The proportion of impervious cover is estimated as the number of paces which fall on impervious surface divided by the total number of steps (100). This technique produces results highly correlated with those of GIS-based analyses (Dale et al., 2016; Just et al., 2018).
27
We assessed leaf condition twice, between June and July 2018 and between August andSeptember 2018. We cut four branches from each tree in cardinal directions and from the terminal end of each branch we removed every other leaf present for a total of 20 for each branch. If any branch produced less than 20 leaves then we would cut an additional branch and repeat the process until we had a total of 80 leaves for each site. Leaves were stored in a plastic zip-top bag which was placed in a cooler. Leaves were then stored at 4°C and processed within a week. We inspected each leaf and recorded the leaf area covered by 5 types of damage: chewing, gall/distortion, stippling/discoloration, mining, and pathogenic damage (Fig. 3). The percent of damaged area on each leaf was assessed using published guides
(Dreistadt, 2016) and was expressed in units of 10%. When there was visible damage to less than 10% of the leaf area, the damage was rated as “<1%”.
Water potential is a measure of how water is transported through a system. For trees, water potential refers to how easily water is transported through the xylem, and is a measure of drought stress. We used a pressure chamber (PMS Instrument Company, Albany, OR) to determine the xylem water potential of each tree. We measured water potential twice, once between June and July 2018 and again between August and September 2018. Water potential was recorded in Megapascals (MPa) of pressure as a negative number, where the highest potential number is 0 (water). As tree stress increases, water potential becomes more negative. Higher temperatures increase water stress which decreases water potential in trees (Meineke et. al 2018). We sampled during the midday hours between 11am and 3pm and when there was little to no overcast of clouds. At each site, we clipped two 20cm terminal twigs from opposite sun-exposed areas of the tree and placed them one at a time into a pressure chamber with the base of the twig exposed. After both twigs were recorded, we took the mean of the samples.
Statistical analysis of GIS assessments. A Chi-square test (JMP Pro 11) was used to determine if
28
We established surface cover thresholds by calculating the range of impervious surface cover percentages at which the most likely condition changed.Statistical analysis of onsite assessments. Simple linear regression was used (JMP Pro 11) to
determine the relationships between scale insect density, percent impervious surface cover, water potential for each species. After inspecting residual plots, we determined scale counts must be log10(x+1)
transformed to meet assumptions of linear regression. Ordinal logistic regression was used (JMP Pro 11) to determine how scale insect density and impervious surface cover predicted tree condition for each species.
Results
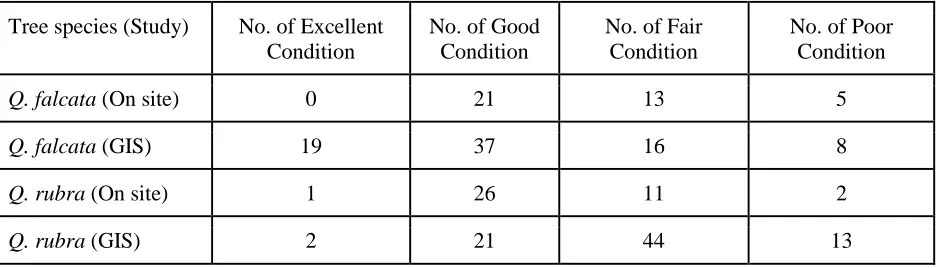
GIS assessments. Urban tree conditions for Q. falcata included 19 excellent, 37 good, 16 fair,
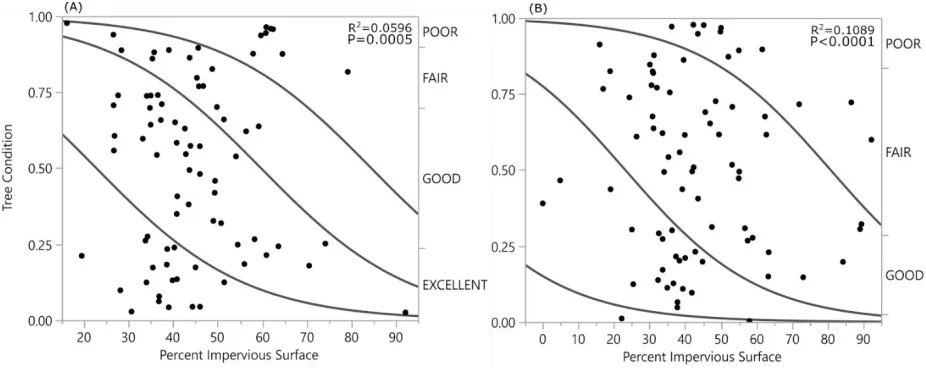
and 8 poor. Q. rubra conditions included 2 excellent, 21 good, 44 fair, and 13 poor conditioned trees. The distributions of tree conditions significantly differed between the two species (P < 0.0001). Impervious surface cover measured using GIS ranged from 16% to 92% and 0% to 92% for Q. falcata and Q. rubra, respectively. Percent impervious surface cover was negatively related to tree condition for both species (Q. falcata N= 80, R2=0.06 P<0.0006; Q. rubra N=80 R2=0.11 P<0.0001) (Fig. 4). According to threshold
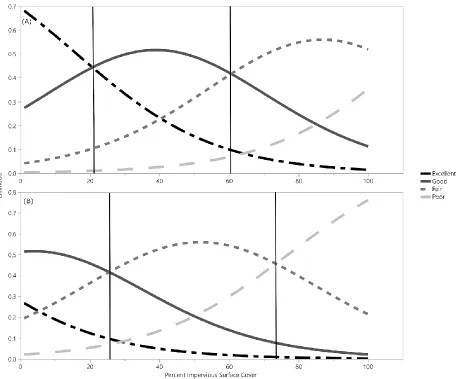
calculations from the probability formulas generated by logistic regression and GIS measurements, Q. falcata trees were most likely to be in Excellent condition below 21% impervious surface cover, Good condition between 21% and 60% impervious surface, and Fair conditions above 60% impervious surface (Fig. 5). Q. rubra trees were unlikely to be in Excellent condition at any percent impervious surface cover. Q. rubra trees were most likely to be in Good condition below 25% impervious surface, in Fair condition between 25% and 73% impervious surface, and Poor condition above 73% impervious surface (Fig. 5).
Onsite assessments. One Q. falcata tree died between sampling sessions leaving 39 trees instead
29
included 10 trees that were in good condition. Q. rubra had 1 excellent, 16 good, 11 fair, and 2 poor conditioned trees, while forested Q. rubra included 10 trees that were in good condition.Impervious surface estimated with Pace-to-Plant ranged from 0% to 90% with a mean of 21.14% (±23.79%). Impervious surface around the Q. falcata sites and Q. rubra sites ranged from 0% to 72% and 0% to 90%, respectively. In both species the likelihood of good or excellent tree condition decreased as percent impervious surface cover increased (Q. falcata N= 39, R2=0.12 P=0.0048, Fig. 6; Q. rubra N=40
R2=0.19 P=0.0019, Fig. 6).
Scale density per twig for Q. falcata trees ranged from 0 to 49 live individuals with a mean of 3.54 (±8.49). 99% of scales found on Q. falcata were obscure scales (Melanaspis obscura), and the other 1% were Oak Lecanium Scales (Parthenolecanium quercifex). 90% of scales found on Q. rubra were Obscure scales (Melanaspis obscura), and the remaining 10% were Oak Lecanium Scales
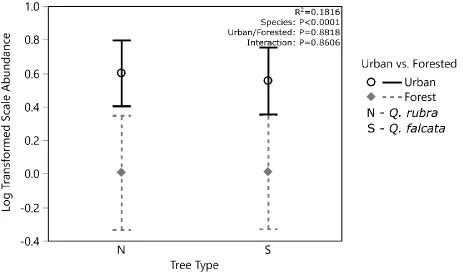
(Parthenolecanium quercifex). Scale density per twig for Q. rubra trees ranged from 0 to 52 live individuals with a mean of 4.35 (±8.73). Scale density was higher in urban than forest trees but did not significantly differ between species (R2=0.1816, species P=0.8818, location P<0.001, interaction
P=0.8606, Fig. 7). There was a significant relationship between scale density and percent impervious surface (R2=0.1489, P=0.0005, Fig. 8), but species did not have a significant effect on scale density
(P=0.9776). Increased scale density decreased the likelihood of good or excellent tree condition for Q. falcata (R2=0.0733, P=0.0231, Fig. 9) but not for Q. rubra (R2=0.0040, P=0.5964, Fig. 9).
Average water potential was -2.41 MPa (±0.33 MPa) and -2.53 MPa (±0.32 MPa) for Q. falcata trees and Q. rubra trees, respectively. Water potential was lower for urban than forest trees in both sampling periods, but the species did not differ in water potential (first summer sampling period: R2=
0.2363, location P=<0.001, species P=0.1383, interaction P=0.4769, Fig. 10; second summer sampling period R2= 0.2293, location P=<0.001, species P=0.2090, interaction P=0.5140, Fig. 10). Percent
impervious surface significantly predicted water potential for urban trees in both sampling sessions (first summer sampling period: R2= 0.3104, impervious surface P<0.0001, species P=0.0238, interaction
30
P=0.0391, interaction P=0.2891, Fig. 12). Water potential was higher for urban Q. falcata than urban Q. rubra for both sampling sessions.Our ANOVA analysis indicated chewing damage was significantly lower in urban than forest trees (Fig. 13, P<0.001). Chewing damage differed between the species (Fig. 13, P=0.0002), however the interaction between species and location was also significant (Fig 13, P=0.0077), indicating that while chewing damage was significantly higher for Q. rubra than Q. falcata in forest areas, there was no difference between the two species in urban areas. Linear regression indicated that chewing damage was higher for urban Q. rubra than urban Q. falcata (Fig. 14, P=0.1765), but impervious surface or the impervious surface and species interaction were not significantly related to chewing damage (Fig. 14, impervious surface P=0.7457, interaction P=0.0935).
ANOVA results indicated stippling damage differed significantly between the species (Fig. 13, P=0.04). While stippling damage did not differ between urban and forest trees in this model (Fig. 13, P=0.1114), the location and species interaction was significant (Fig. 13, P=0.0311). While urban Q. rubra had higher stippling damage than forest Q. rubra, there was no difference in stippling damage between forest and urban Q. falcata. Linear regression indicated stippling damage was higher in urban Q. rubra than urban Q. falcata, but impervious surface or the impervious surface and species interaction had no effect (Fig. 14, impervious surface P=0.8238, interaction P=0.692).
ANOVA results indicated galling damage was significantly higher in urban than forested trees (Fig. 13, P=0.0147), but species and the species and location interaction were not significant (Fig. 13, species P=0.2815, interaction P=0.2878). Linear regression indicated galling damage was higher in urban Q. rubra than urban Q. falcata (Fig. 14, P=0.0389), but impervious surface or the impervious surface and species interaction had no effect (Fig. 14, impervious surface P=0.0591, interaction P=0.5178).
31
decreased with impervious surface cover (Fig. 14, P=0.0316), but species and the impervious surface and species interaction had no effect (Fig. 14, species P=0.1611, interaction P=0.3807).ANOVA results indicated pathogenic damage was significantly lower in urban than forest trees (Fig. 13, P=0.0002) and in Q. rubra than Q. falcata regardless of location(Fig. 13, P<0.0001). However, the location and species interaction was also significant (Fig. 13, P=0.0320), indicating the difference in pathogenic damage between urban and forested Q. rubra was greater than the difference between urban and forested Q. falcata. Linear regression indicated that impervious surface significantly affected
pathogenic damage (Fig. 14, P=0.0078), however, the effect of impervious surface on pathogenic damage depends on species (Fig. 14, interaction P=0.0031). While the effect of species was marginally not significant (Fig. 14, P=0.0509), the analysis demonstrated pathogenic damage increases with impervious surface cover for Q. rubra and decreases with impervious surface cover for Q. falcata.
Discussion
32
We found forested trees of both species had higher water potential than urban trees, andincreasing impervious surface cover around urban trees decreased water potential for both Q. falcata and Q. rubra. Among urban trees, Q. falcata had higher water potentials than Q. rubra which suggests that Q rubra has higher water stress.This is consistent with the model that urban areas, especially those with high impervious surface cover, increase tree stress, which in turn decreases water potential. In urban settings Q. rubra were more water stressed than Q. falcata, but in forested settings there was no significant difference between the species. Consistent with our hypothesis, urbanization is more
detrimental to Q. rubra than Q. falcata, perhaps because Q. rubra is less adapted to the climate created by urban warming and impervious surface cover.
We also observed leaf damage. Less chewing, mining, and pathogenic damage, but more galling damage, was found on urban than forest trees. The increase in chewing, mining, and pathogenic damage in forested plots could be due to greater diversity of trees and in turn, a greater diversity and abundance of herbivorous insects. Insects which cause chewing damage in Raleigh, such as orange striped oakworm (Anisota senatoria) and forest tent caterpillar (Malacosoma disstria), may not adapt to the increased urban temperatures as well as other herbivorous species and die off, resulting in less chewing damage to urban trees (Nuckols et al. 1995). Alternatively, because water stressed trees could have heightened allelochemistry and tougher foliage, folivores may have a more difficult time feeding on these trees (Huberty et. al. 2004). Galling arthropods, like the spindle gall midge (Pinyonia edulicola) or cynipid gall wasps (Cynipidae spp.) are present in high numbers in urban environments (Dreistadt et al. 1990, Frankie et al. 1978). Urban environments can create adverse conditions for natural predators or competitors of gall-forming insects, increasing gall-former populations (Frankie et al. 1987). Stippling was the only damage type for which location was not significant, however the interaction between species and location was significant for stippling. This indicated that while urban Q. rubra had higher stippling damage than forest Q. rubra, there was no difference between urban and forest Q. falcata.
33
surface on pathogenic damage depended on species. Pathogenic damage increased with impervious surface for Q. falcata but decreased with impervious surface for Q. rubra. The species did not differ in chewing or mining damage, but we found higher stippling and galling damage on urban Q. rubra than urban Q. falcata. While stippling can be caused by insects such as oak lace bugs (Corythucha arcuata) and spider mites (Oligonychus spp.), it may also be due to air pollution components such as ozone or sulfur dioxide which are often abundant in cities (Samuelson et. al 1996, Simini et al. 1992, Temple 1972). Sensitivity to these pollutants varies with species and could be exacerbated by the stress already imposed by urban areas on Q. rubra.35
REFERENCESAllen, C.D., Macalady, A.K., Chenchouni, H., Bachelet, D., McDowell, N., Vennetier, M., Kitzberger, T., Rigling, A., Breshears, D.D., Hogg, E.T. and Gonzalez, P., 2010. A global overview of drought and heat-induced tree mortality reveals emerging climate change risks for forests. Forest ecology and management, 259(4), pp.660-684.
Almas, A.D. and Conway, T.M., 2016. The role of native species in urban forest planning and practice: A case study of Carolinian Canada. Urban forestry & urban greening, 17, pp.54-62.
Angert, A.L. and Schemske, D.W., 2005. The evolution of species’ distributions: reciprocal transplants across the elevation ranges of Mimulus cardinalis and M. lewisii. Evolution, 59(8), pp.1671-1684. Barney, R.J., Clark, S.M. and Riley, E.G., 2011. Annotated list of the leaf beetles (Coleoptera:
Chrysomelidae) of Kentucky: Subfamily Cryptocephalinae. Journal of the Kentucky Academy of Science, 72(1), pp.2-23.
Belanger, R.P., 1990. Quercus falcata Michx. var. falcata, southern red oak (typical). Silvics of North America, 2, pp.640-644.
Billings, W.D., 1987. Constraints to plant growth, reproduction, and establishment in arctic environments. Arctic and Alpine Research, 19(4), pp.357-365.
Chen, B. and Wise, D.H., 1999. Bottom‐up limitation of predaceous arthropods in a detritus‐based terrestrial food web. Ecology, 80(3), pp.761-772.
Clausen, J., 1963. Tree lines and germ plasm—a study in evolutionary limitations. Proceedings of the National Academy of Sciences, 50(5), pp.860-868.
Crous, K.Y., Quentin, A.G., Lin, Y.S., Medlyn, B.E., Williams, D.G., Barton, C.V. and Ellsworth, D.S., 2013. Photosynthesis of temperate Eucalyptus globulus trees outside their native range has limited adjustment to elevated CO2 and climate warming. Global Change Biology, 19(12), pp.3790-3807.
Dale, AG, Youngsteadt, E and Frank, SD. 2016. Forecasting the effects of heat and pests on urban trees: Impervious surface thresholds and the ‘Pace to Plant’ technique. Arboriculture & Urban Forestry.
DeCandido, R., Muir, A.A. and Gargiullo, M.B., 2004. A first approximation of the historical and extant vascular flora of New York City: implications for native plant species conservation. Journal of the Torrey Botanical Society, pp.243-251.
Dreistadt, S.H., 2016. Pests of landscape trees and shrubs: an integrated pest management guide (Vol. 3359). UCANR Publications.
Dreistadt, S.H., Dahlsten, D.L. and Frankie, G.W., 1990. Urban forests and insect ecology. BioScience, 40(3), pp.192-198.
36
Frankie, G.W. and Ehler, L.E., 1978. Ecology of insects in urban environments. Annual Review ofEntomology, 23(1), pp.367-387.
Heichel, G.H. and Turner, N.C., 1984. Branch growth and leaf numbers of red maple (Acer rubrum L.) and red oak (Quercus rubra L.): response to defoliation. Oecologia, 62(1), pp.1-6.
Holzinger, B., Hülber, K., Camenisch, M. and Grabherr, G., 2008. Changes in plant species richness over the last century in the eastern Swiss Alps: elevational gradient, bedrock effects and migration rates. Plant Ecology, 195(2), pp.179-196.
Hoogesteger, J. and Karlsson, P.S., 1992. Effects of defoliation on radial stem growth and photosynthesis in the mountain birch (Betula pubescens ssp. tortuosa). Functional Ecology, pp.317-323.
Huberty, A.F. and Denno, R.F., 2004. Plant water stress and its consequences for herbivorous insects: a new synthesis. Ecology, 85(5), pp.1383-1398.
Iverson, L.R. and Prasad, A.M., 2001. Potential changes in tree species richness and forest community types following climate change. Ecosystems, 4(3), pp.186-199.
Jactel, H., Petit, J., Desprez‐Loustau, M.L., Delzon, S., Piou, D., Battisti, A. and Koricheva, J., 2012. Drought effects on damage by forest insects and pathogens: a meta‐analysis. Global Change Biology, 18(1), pp.267-276.
Johnson, M.P. and Freytag, P.H., 2001. Metallic Wood Borers (Coleoptera: Buprestidae) and Spittlebugs (Homoptera: Cercopidae) on Pin Oak in Kentucky. Journal of the Kansas Entomological Society, pp.28-31.
Just, M.G., Frank, S.D. and Dale, A.G., 2018. Impervious surface thresholds for urban tree site selection. Urban Forestry & Urban Greening.
Kim, H.H., 1992. Urban heat island. International Journal of Remote Sensing, 13(12), pp.2319-2336. Kulman, H.M., 1971. Effects of insect defoliation on growth and mortality of trees. Annual review of
entomology, 16(1), pp.289-324.
Lahr, E.C., Dunn, R.R. and Frank, S.D., 2018. Getting ahead of the curve: cities as surrogates for global change. Proc. R. Soc. B, 285(1882), p.20180643.
Loehle, C., 1998. Height growth rate tradeoffs determine northern and southern range limits for trees. Journal of Biogeography, 25(4), pp.735-742.
Maherali, H., Pockman, W.T. and Jackson, R.B., 2004. Adaptive variation in the vulnerability of woody plants to xylem cavitation. Ecology, 85(8), pp.2184-2199.
37
McGraw, J.B., Gottschalk, K.W., Vavrek, M.C. and Chester, A.L., 1990. Interactive effects of resourceavailabilities and defoliation on photosynthesis, growth, and mortality of red oak seedlings. Tree physiology, 7(1-2-3-4), pp.247-254.
McKenney, D.W., Pedlar, J.H., Lawrence, K., Campbell, K. and Hutchinson, M.F., 2007. Potential impacts of climate change on the distribution of North American trees. AIBS Bulletin, 57(11), pp.939-948.
McKinney, M.L., 2006. Urbanization as a major cause of biotic homogenization. Biological conservation, 127(3), pp.247-260.
Meineke, E.K., Holmquist, A.J., Wimp, G.M. and Frank, S.D., 2017. Changes in spider community composition are associated with urban temperature, not herbivore abundance. Journal of Urban Ecology, 3(1).
Meineke, E.K. and Frank, S.D., 2018. Water availability drives urban tree growth responses to herbivory and warming. Journal of Applied Ecology, 55(4), pp.1701-1713.
Metcalf, Z.P., 1912. The gloomy scale, an important enemy of shade trees in North Carolina. Journal of the Elisha Mitchell Scientific Society, 28(2), pp.88-91.
Moll, G. and Young, S., 1992. Growing Greener Cities: A Tree-Planting Handbook. Living Planet Press, 558 Rose Avenue, Venice, CA 90291.
Normand, S., Treier, U.A., Randin, C., Vittoz, P., Guisan, A. and Svenning, J.C., 2009. Importance of abiotic stress as a range‐limit determinant for European plants: insights from species responses to climatic gradients. Global Ecology and Biogeography, 18(4), pp.437-449.
Nowak, D.J. and Dwyer, J.F., 2007. Understanding the benefits and costs of urban forest ecosystems. Urban and community forestry in the northeast (pp. 25-46). Springer, Dordrecht.
Nuckols, M.S. and Connor, E.F., 1995. Do trees in urban or ornamental plantings receive more damage by insects than trees in natural forests?. Ecological Entomology, 20(3), pp.253-260.
Oke, T.R., 1973. City size and the urban heat island. Atmospheric Environment (1967), 7(8), Pp.769-779.
Pederson, N., Cook, E.R., Jacoby, G.C., Peteet, D.M. and Griffin, K.L., 2004. The influence of winter temperatures on the annual radial growth of six northern range margin tree species.
Dendrochronologia, 22(1), pp.7-29.
Pigott, C.D. and Huntley, J.P., 1981. Factors controlling the distribution of Tilia cordata at the northern limits of its geographical range III. Nature and causes of seed sterility. New phytologist, 87(4), pp.817-839.
Raupp, M.J., Shrewsbury, P.M. and Herms, D.A., 2010. Ecology of herbivorous arthropods in urban landscapes. Annual review of entomology, 55.
38
Samuelson, L.J., Kelly, J.M., Mays, P.A. and Edwards, G.S., 1996. Growth and nutrition of Quercusrubra L. seedlings and mature trees after three seasons of ozone exposure. Environmental Pollution, 91(3), pp.317-323.
Schultz, J.C. and Baldwin, I.T., 1982. Oak leaf quality declines in response to defoliation by gypsy moth larvae. Science, 217(4555), pp.149-151.
Sexton, J.P., McIntyre, P.J., Angert, A.L. and Rice, K.J., 2009. Evolution and ecology of species range limits. Annual Review of Ecology, Evolution, and Systematics, 40.
Simini, M., Skelly, J., Davis, D.D., Savage, J.E. and Comrie, A.C., 1992. Sensitivity of four hardwood species to ambient ozone in north central Pennsylvania. Canadian Journal of Forest Research, 22(11), pp.1789-1799.
Sjöman, H., Hirons, A.D. and Bassuk, N.L., 2015. Urban forest resilience through tree selection— Variation in drought tolerance in Acer. Urban Forestry & Urban Greening, 14(4), pp.858-865. Temple, P.J., 1972. Dose-response of urban trees to sulfur dioxide. Journal of the Air Pollution Control
Association, 22(4), pp.271-274.
USDA, NRCS. 2018. The PLANTS Database (http://plants.usda.gov, 26 September 2018). National Plant Data Team, Greensboro, NC 27401-4901 USA.
Ware, G.H., 1994. Ecological bases for selecting urban trees. Journal of Arboriculture, 20, pp.98-98. Way, D.A. and Oren, R., 2010. Differential responses to changes in growth temperature between trees
from different functional groups and biomes: a review and synthesis of data. Tree physiology, 30(6), pp.669-688.
Wertin, T.M., McGuire, M.A. and Teskey, R.O., 2011. Higher growth temperatures decreased net carbon assimilation and biomass accumulation of northern red oak seedlings near the southern limit of the species range. Tree Physiology, 31(12), pp.1277-1288.
Ying, C.C., 1991. Performance of Lodgepole Pine Provenances at Sites in Southwestern. Silvae Genetica, 40(5/6).
39
Tables:Table 1:Conditions of Q. falcata and Q. rubra urban and forest trees used in on site and GIS analyses.
Tree species (Study) No. of Excellent Condition
No. of Good Condition
No. of Fair Condition
No. of Poor Condition
Q. falcata (On site) 0 21 13 5
Q. falcata (GIS) 19 37 16 8
Q. rubra (On site) 1 26 11 2
40
Figures:
Figure 1.Q. falcata range map (USDA 2018)
41
Figure 3.Examples of types of leaf damage assessed on Q. falcata and Q. rubra. (McAreavy, 2018)Figure 4
42
Figure 5Impervious surface cover threshold for Q. falcata (A), and Q. rubra (B) plantings using ArcGIS. These plots show estimations of impervious cover at which the condition of a tree would transition from Excellent to Good, Good to Fair, and Fair to Poor. Using ordinal logistic regression tree condition
43
Figure 6Relationship of tree condition and Impervious surface estimations using Pace-to-Plant of Q. falcata (A) and Q. rubra (B) plots. Relationship was created using an ordinal logistic regression.
Figure 7
44
Figure 8Scale density versus impervious surface estimations using Pace-to-Plant method. Urban data were fit with multiple linear regression with species and impervious surface as predictors.
Figure 9
45
Figure 1046
Figure 11First summer 2018 session of water potential (MPa) of Q. falcata and Q. rubra plots versus
47
Figure 1248
Figure 13Relationship between species, tree location (urban/forested), and leaf damage (Chewing (A),