Copyright1999 by the Genetics Society of America
Large Number of Replacement Polymorphisms in Rapidly Evolving Genes of
Drosophila: Implications for Genome-Wide Surveys of DNA Polymorphism
Karl J. Schmid,*
,‡Loredana Nigro,
†Charles F. Aquadro
‡and Diethard Tautz*
,1*Zoologisches Institut, Universita¨t Mu¨nchen, 80333 Mu¨nchen, Germany,†Dipartimento di Biologia, University of Padua, 35122 Padua, Italy and‡Department of Molecular Biology and Genetics, Cornell University, Ithaca, New York 14853
Manuscript received May 13, 1999 Accepted for publication August 3, 1999
ABSTRACT
We present a survey of nucleotide polymorphism of three novel, rapidly evolving genes in populations of Drosophila melanogaster and D. simulans. Levels of silent polymorphism are comparable to other loci, but the number of replacement polymorphisms is higher than that in most other genes surveyed in D.
melanogaster and D. simulans. Tests of neutrality fail to reject neutral evolution with one exception. This
concerns a gene located in a region of high recombination rate in D. simulans and in a region of low recombination rate in D. melanogaster, due to an inversion. In the latter case it shows a very low number of polymorphisms, presumably due to selective sweeps in the region. Patterns of nucleotide polymorphism suggest that most substitutions are neutral or nearly neutral and that weak (positive and purifying) selection plays a significant role in the evolution of these genes. At all three loci, purifying selection of slightly deleterious replacement mutations appears to be more efficient in D. simulans than in D. melanogaster, presumably due to different effective population sizes. Our analysis suggests that current knowledge about genome-wide patterns of nucleotide polymorphism is far from complete with respect to the types and range of nucleotide substitutions and that further analysis of differences between local populations will be required to understand the forces more completely. We note that rapidly diverging and nearly neutrally evolving genes cannot be expected only in the genome of Drosophila, but are likely to occur in large numbers also in other organisms and that their function and evolution are little understood so far.
T
HE question of which evolutionary forces are re- relative role of drift and positive selection under weak selection because both nearly neutral and episodic selec-sponsible for the evolution of genes and proteinshas been a contentious issue among molecular evolu- tion models are able to produce the identical patterns of polymorphism with certain parameter assumptions tionists. Many sequence comparisons of homologous
proteins seem to confirm that the sequence evolution (Gillespie1994).
Rapidly evolving proteins are particularly interesting of proteins results mainly from the random fixation of
neutral sequence variants, because the overwhelming for this discussion. Three scenarios may explain why proteins evolve rapidly. The first may be a lack of strong majority of proteins exhibits fewer replacements than
silent substitutions. According to the neutral theory of functional or structural constraints. In this case, a large number of amino acid residues can be mutated without molecular evolution, functional and structural
con-straints determine what proportions of new variants are impairing the function of the protein and it evolves in a neutral fashion. The second may be positive selection deleterious, thereby causing rate differences between
different proteins. The rapidly growing database of DNA for sequence divergence. Some classes of proteins ap-pear to be affected predominantly by positive selection. sequences provides evidence for both neutral and
adap-tive patterns in sequence data, but posiadap-tive selection Such proteins are involved in pathogen-host interaction and the immune system (Hugheset al. 1990;Fitchet may be more frequent than thought previously (
Kreit-man and Akashi 1995). Most molecular evolutionists al. 1991;Smithet al. 1995;Hughes1997), sex determi-nation (Whitfieldet al. 1993;SuttonandWilkinson now agree that most new mutations in proteins are
dele-terious; there is still disagreement about what propor- 1997), and reproduction (Lee et al. 1995; Metz and tions of nondeleterious mutant alleles are neutral, Palumbi1996;TsaurandWu1997). A final explana-nearly neutral, or advantageous (Kreitman1996;Ohta tion may be a mixture of the first two explanations: 1996; Li 1997). There is also some debate about the neutral evolution of some residues and positive selection
at others.
A major limitation in understanding the factors
gov-Corresponding author: Karl Schmid, Section of Genetics and Develop- erning protein evolution is a lack of knowledge about
ment, 403 Biotechnology Bldg., Cornell University, Ithaca, NY
14853-the distribution of evolutionary rates among 14853-the vast
2703. E-mail: [email protected]
majority of genes in a genome. Most proteins whose
1Present address: Institut fu¨ r Genetik, Universita¨t zu Ko¨ln, Weyertal
121, 50931 Ko¨ln, Germany. evolution has been studied so far are functionally and
onymous to synonymous substitutions (Ka/Ks) ratio between structurally well characterized and evolutionarily
con-D. melanogaster and con-D. yakuba is,1, indicating purifying
selec-served. They constitute a nonrandom sample of all
tion; (2) all insertion/deletion mutations between the two
genes in a genome and may give a biased picture of the species are in frame; (3) the open reading frame (ORF) and relative roles of mutation, selection, and drift. This is expression patterns (K. J. SchmidandD. Tautz,unpublished
data) are conserved between species. Figure 1 shows a
sche-contrasted by the output from genome sequencing
proj-matic structure of the genes and the regions that were surveyed
ects, where thousands of novel proteins are being
identi-in this study.
fied whose structure, function, and molecular evolution
Clone anon1A3 encodes a protein of 489 amino acids and
remain largely unknown. As long as there are no com- is characterized by a highly negative net charge. The gene has plete genome sequences from closely related species no similarity to other sequences in database searches and
there are no close homologs in the Drosophila genome, as
available, it is necessary to use a random sample of genes
evaluated by Southern blotting. The gene is expressed in
dif-for evaluating the range of evolutionary rates and the
ferent tissues during embryogenesis: until gastrulation, the
factors affecting sequence evolution in a genome.
transcript is homogeneously distributed in the embryo and
Previously, we performed such a genome-wide survey then becomes restricted to the developing mesoderm and and examined the sequence conservation ofz100 dif- central nervous system.
The protein encoded by clone anon1E9 has a length of 588
ferent, randomly isolated nonidentical clones from an
amino acids and contains six C2H2 zinc-finger motifs. Four embryonic cDNA library of Drosophila melanogaster to
zinc-finger motifs are arrayed as a tandem in the center of
estimate the range and distribution of evolutionary
di-the protein and di-the odi-ther two at di-the C terminus (Figure 1).
vergence in the Drosophila genome by genomic filter Database searches reveal no close similarity to other zinc-finger hybridization (SchmidandTautz1997). In this screen, proteins, and only those residues necessary for maintaining
the structure of the fold are identical between anon1E9 and the
about one-third of these clones was classified as fast
best matches. This gene is only maternally expressed during
evolving, because they did not hybridize against
geno-embryogenesis, and the transcript is homogeneously
distrib-mic DNA from Drosophila virilis (40 million year
evolu-uted in the early embryo. The transcript can be detected until
tionary distance). More detailed sequence comparisons the cellular blastoderm stage.
of 10 fast evolving cDNA clones between D. melanogaster Clone anon1G5 is the fastest evolving among the three and the closely related species D. yakuba (12 millon genes. The putative protein has a length of 337 amino acids, does not exhibit sequence similarity to other genes, and is a
year evolutionary distance) revealed that the numbers
single copy gene. The central region is very divergent between
of amino acid replacement substitutions are among the
D. melanogaster and D. yakuba and also contains several inser-highest of currently known Drosophila genes. tions and deletions. This gene is expressed throughout em-Here we describe a survey of nucleotide polymor- bryogenesis and shows no developmental regulation at the phism in populations of D. melanogaster and D. simulans transcriptional level.
Lines: Isofemale lines from the following locations were
at three fast evolving loci that were isolated in our
previ-used. The survey of anon1A3 in D. melanogaster includes four
ous screen. The goal of this study is to test whether the
lines from Australia, five from North America, five from Asia
amino acid sequences of the proteins are also variable (Iraq, Japan, and China), nine from Europe (Cyprus, France, within species and to use the polymorphism data for Italy, Spain, and the former Soviet Union), and three from tests of neutral evolution. The work described here ex- East Africa (Kenya and Zimbabwe). The D. simulans sample of anon1A3 includes two lines from the United States, three
tends the initial population survey ofSchmidandTautz
from Mexico, one from Uruguay, and six from Zimbabwe.
(1997) because two additional loci and larger numbers
Gene anon1E9 was surveyed in three lines of D. melanogaster
of lines were analyzed. Results are compared to other from Australia, four from North America, one from Asia genes that were surveyed in populations of both species (Iraq), four from Europe, and three from East Africa. The D. to identify differences between fast evolving and con- simulans sample of anon1E9 consists of three lines from North
America, two from Mexico, one from Uruguay, and two from
served genes. Furthermore, we compare levels of
poly-Zimbabwe. The D. melanogaster sample of gene anon1G5
com-morphism and divergence among loci and between
prises three lines from Australia, five from North America,
lineages to differentiate between locus-specific and lin- one from South America (Peru), two from Asia (Iraq and eage-specific effects. Japan), three from Europe, and two from East Africa. In the D. simulans sample are three lines from North America, four
from Mexico, one from South America, and six from Zim-babwe.
MATERIALS AND METHODS
The lines were collected by various researchers and given to us by M. Kidwell (D. melanogaster) and M. Turelli (D. sim-Surveyed genes: Three genes that were classified as fast
evolving in our screen were chosen for this analysis. They ulans) or maintained at the University of Padua. The number
of lines vary between genes, mainly because polymerase chain constitute novel, putative protein coding genes and are
charac-terized by large numbers of nonsynonymous substitutions in reaction (PCR) did not work well in all lines or high quality sequences could not be obtained. If only those lines are used comparisons between D. melanogaster and D. yakuba (Schmid
and Tautz1997). Note that their names are derived from for analysis for which we have sequences from all three genes, essentially the same results are observed; we therefore include their location in microtiter plates and do not reflect their
cytological location in the genome of D. melanogaster. Although all sequences from the different lines in the following analysis. DNA preparation, PCR, and sequencing:DNA was prepared the genetic and biochemical functions of these genes are not
known, there is strong evidence that all three of them are from single flies by phenol-chloroform extraction and ethanol precipitation (Sambrooket al. 1989). The loci were amplified
nonsyn-with PCR by using the following primers and cycling condi-tions in 50-ml reactions. Reaction conditions were as suggested by the manufacturer of the AmpliTaq DNA polymerase (Per-kin-Elmer, Foster City, CA). Cycling conditions were: 2 min 958, then 35 cycles of 1 min 948, 1 min 488, 2 min 728, and final extension of 10 min 728. The following primers were used for amplification: anon1A3-1, 59-GGAGGAGGCGAG GAAGATGT-39; anon1A3-2, 59-GTTGGCAACATCAGACCA ACT-39; anon1E9-PR3, 59 -AATATATGCTAGCGCACCATG-39anon1E9-PR2, 59-ATTTCAACGTTTGCATTTGG-39; anon1G5-PR3, 59-AAGTATCTAGCCGACGAGGAC-39; anon1G5-PR4,
TACCCAGCT CTCATTCATCTC. The PCR products were gel purified with the Jetsorb kit (Genomed, Germany) and directly used for sequencing. Sequencing was carried out on an ABI 377 sequencer with DyeTerminator and AmpliTaq FS
chemis-Figure 1.—Sequenced regions of the three loci surveyed try (Perkin-Elmer). Internal primers were used to sequence
in this study. A schematic representation of the cDNA clones every base from both directions. Sequences were edited and
and additional introns that were discovered after sequencing aligned with ABI Factura, AutoAssembler, and Sequence
Navi-of genomic PCR fragments are depicted (the clones are ori-gator programs. GenBank accession numbers are AA433202–
ented from 59to 39). Gray boxes show the coding regions and AA433290 and AF161723–AF161796. Aligned sequences and
white boxes show noncoding regions of the cDNA. The black figures of variable sites are available at
http://www.mbg.cor-boxes in anon1E9 show the zinc-finger domains. Sequenced nell.edu/aquadro/sequences.html.
regions are outlined by the bars above each gene (lengths are Chromosomalin situhybridization:Chromosomes were
pre-given for the aligned D. melanogaster and D. simulans se-pared from Oregon-R lines from D. melanogaster and Soda
quences). Lake populations from D. simulans according to the protocol
ofLim(1993). cDNA inserts (1mg; cloned into pBluescript) were biotinylated with the BioNick nick translation kit (Gibco
BRL, Gaithersburg, MD). Signal detection was achieved with The spatial distribution of substitutions along the coding Vectastain (Vector Laboratories, Burlingame, CA) and Detek sequence was tested with the test of Tang and Lewontin Hrp (ENZO, Farmingdale, NY) kits. Photographs were taken (1999), which is based on the empirical cumulative distribu-on a Zeiss microscope with a Pixera digital camera and pro- tion function (ECDF) statistics. This test compares the differ-cessed with the GNU image manipulator 1.0 program. ence between the observed cumulative distribution of dis-Analysis:The analysis of polymorphism and divergence was tances between substitutions and a theoretical, homogeneous carried out using the program DnaSP 3.0 (RozasandRozas distribution. Critical values of the test statistic for significance
1999). Numbers of substitutions per site were computed with tests are obtained by Monte Carlo simulations of the null the program Kestim (Comeron1995).u, an estimate of the model (seeTangandLewontin1999 for details). We applied mutation parameter 4Nem (Watterson 1975), and p, the the test to analyze the clustering of silent and replacement average number of pairwise differences (Nei1987), were esti- polymorphisms and fixed substitutions to identify differences mated as measures of nucleotide diversity. Several tests for between silent and replacement substitutions and between neutral evolution were applied. Tajima’s D statistic compares lineages.
the two different estimates of nucleotide diversity,uandp,
We compared the frequency distributions of silent and re-which should be identical under a neutral model (D is
ex-placement polymorphisms in the population samples to detect pected to be zero) (Tajima 1989). D is then tested for a
effects of weak selection (Akashi 1997, 1999; Akashi and significant difference from zero. A related test is Fu and Li’s
Schaeffer1997). First, we determined whether silent
substitu-D (FuandLi1993), which counts the number of singletons
tions change a codon from a preferred to an unpreferred in a population sample and tests whether this number is
sig-one, or vice versa. Codons were classified into preferred and nificantly different from the expected number under a neutral
unpreferred codons according toAkashi (1995) under the model. The HKA test (Hudson et al. 1987) tests whether
assumption that the same codons are preferred in D. melanogas-observed levels of polymorphism and sequence divergence
ter and D. simulans (Akashiand Schaeffer1997). Second, are consistent with a neutral equilibrium model. Regional
the frequency distributions of preferred, unpreferred, and differences in the ratio of polymorphic sites to fixed
differ-replacement substitutions were determined essentially as de-ences of the sequence data were tested with the program
scribed byAkashi(1997) and compared by Mann-Whitney U DNA Slider that employs various statistical procedures (see
tests. We used two different variants of the tests: the fdMWU
McDonald1998). The McDonald-Kreitman test was used to
test (Akashi and Schaeffer 1997), where only polymor-compare ratios of silent and replacement substitutions within
phisms are included in calculating the frequency distribution and between species (McDonaldandKreitman1991).
of the different mutational classes, and the fddMWU test Lineage-specific fixed differences and polymorphisms were
(Akashi1997), which also includes fixed differences. assigned to either D. melanogaster or D. simulans lines by
com-parison to the D. yakuba outgroup sequence. The following GenBank accessions of D. yakuba homologs were used:
AF005844 (anon1A3), AF005848 (anon1E9), and AF005852 RESULTS
(anon1G5). Essentially the same parsimony criteria as
de-A schematic representation of the sequenced regions
scribed byAkashi(1997) were applied to infer the ancestral
state. The relative-rate test ofTajima (1993) was calculated is shown in Figure 1. Sequence alignments showing
poly-to test whether the number of fixed substitutions differs be- morphic sites and fixed differences can be found in an tween the two lineages. The relative-rate test of Muse and
appendix provided at our web site (seemethods). Gaut (1994) was calculated with single, randomly chosen
Locus anon1A3: This locus was sequenced from 26
alleles from the D. melanogaster and D. simulans samples and
bp were obtained from the ORF (63% of 1467 bp). The only intron within the surveyed region has a length of 58 bp and is located close to the 39 end of the ORF. Sixteen polymorphisms were detected in D. melanogaster (p 50.0023), of which 5 are synonymous and 11 onymous; 18 polymorphisms (5 synonymous, 11 nonsyn-onymous, and 2 noncoding) occur in the D. simulans sample (p 5 0.0045; Table 1). In D. melanogaster, a deletion polymorphism affecting a single amino acid (Val) was found in the Iraq line. There are also two independent, fixed indel mutations; a comparison with the sequence of D. yakuba shows that they are caused by an insertion of Glu and Thr, respectively, in D. melano-gaster. In D. melanogaster and D. simulans, the gene is located in 71A, on the left arm of chromosome 3.
Locus anon1E9: At this locus, little nucleotide
poly-morphism is observed in 15 lines from D. melanogaster (p 5 0.0007), but a much higher level is observed among the 8 lines of D. simulans (p 5 0.0158). In D. melanogaster, 3 of the segregating variants are synony-mous, and 4 are nonsynonymous; in D. simulans, the numbers are 31 for synonymous and 33 for nonsynony-mous variants. In both species, anon1E9 harbors a small variable trinucleotide microsatellite with 5–9 repeat units of the GAG codon (coding for glutamate). Two alleles with 6 and 7 repeats were observed in D. melano-gaster and four alleles with 5, 6, 7, and 9 repeat units in D. simulans. A second 6-bp deletion polymorphism (deleting Cys and Asn) is found in one strain of D. simulans. There are two fixed deletions, a 3-bp deletion in D. melanogaster (loss of a Ser) and a 6-bp deletion in D. simulans (loss of Ala and Val). In both species, nucleotide polymorphism at noncoding positions is not significantly different from silent positions in the coding region (Table 1). The physical location in D. melanogaster is 85B/C, on the right arm of chromosome 3. This region is inverted in D. simulans (see below).
Locusanon1G5:This locus was sequenced in 16 lines
from D. melanogaster (p 5 0.0042) and 14 lines from
D. simulans (p 5 0.0125). There are 6 silent and 4
replacement polymorphic sites among the 16 lines of D. melanogaster; there are 17 silent and 20 replacement polymorphic sites in the 14 lines of D. simulans (Table 1). Nucleotide diversity is lower in the intron (Table 1), but the difference from silent polymorphism is not significant in either D. melanogaster or D. simulans. Total polymorphism is threefold higher in D. simulans than in D. melanogaster. Three indel mutations are fixed between the two species. One deletion (2 bp) is found in the intron; the other two occur in the coding sequences of D. melanogaster (insertion of three residues: Ser-Phe-Arg) and D. simulans (deletion of two residues: Ser-Val). In D. simulans, an indel polymorphism affecting two residues (Ala-Arg) segregates with a frequency of z50%. The gene maps to 95D/E on the right arm of chromosome 3 in D. melanogaster and D. simulans.
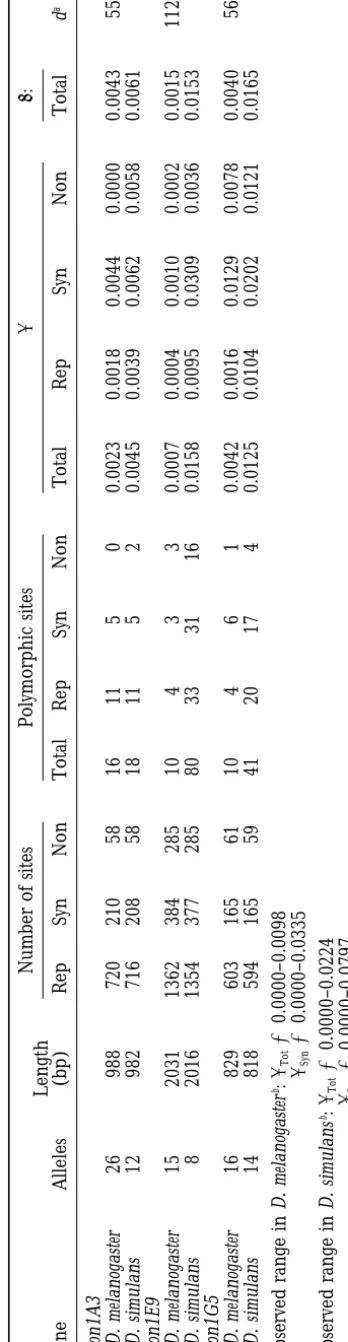
TA BL E 1 Nucleotide diversity in D. melanogaster and D. simulans Number of sites Polymorphic sites pu : Length Gene Alleles (bp) Rep Syn Non Total Rep Syn Non Total Rep Syn Non Total d a anon1A3 D. melanogaster 26 988 720 210 58 16 11 5 0 0.0023 0.0018 0.0044 0.0000 0.0043 55 D. simulans 12 982 716 208 58 18 11 5 2 0.0045 0.0039 0.0062 0.0058 0.0061 anon1E9 D. melanogaster 15 2031 1362 384 285 10 4 3 3 0.0007 0.0004 0.0010 0.0002 0.0015 112 D. simulans 8 2016 1354 377 285 80 33 31 16 0.0158 0.0095 0.0309 0.0036 0.0153 anon1G5 D. melanogaster 16 829 603 165 61 10 4 6 1 0.0042 0.0016 0.0129 0.0078 0.0040 56 D. simulans 14 818 594 165 59 41 20 17 4 0.0125 0.0104 0.0202 0.0121 0.0165 Observed range in D. melanogaster b: pTot 5 0.0000–0.0098 pSyn 5 0.0000–0.0335 Observed range in D. simulans b: pTot 5 0.0000–0.0224 pSyn 5 0.0000–0.0797 Rep, replacement; Syn, synonymous; Non, noncoding sites. aNumber of total differences between two randomly chosen alleles, one from D. melanogaster and one from D. simulans (interspecific difference). bData are from Moriyama and Powell (1996).
simulans:The data in Table 1 show that nucleotide diver-sity differs among genes and also between D. melanogaster and D. simulans. Still, the polymorphism estimates are well within the range observed for other genes from both species (see Table 1). Note, however, that the level of nucleotide polymorphism between the species varies among the three loci: at anon1A3 total nucleotide poly-morphism (p) is about two times higher in D. simulans than in D. melanogaster, at anon1G5 three times higher, and at anon1E9 23 times higher (Table 1). In the coding regions within each species, nucleotide diversity at silent sites is on average only threefold higher than at replace-ment sites. Total nucleotide diversity in D. simulans is about five times higher than in D. melanogaster ; this difference has been noted before (e.g.,Aquadro1992; MoriyamaandPowell1996). In Drosophila, nucleo-tide polymorphism is correlated with recombination rate (BegunandAquadro1992;Aquadroet al. 1994). In regions of low recombination, hitchhiking combined with selective sweeps (Maynard Smith and Haigh 1974;Kaplanet al. 1989;Stephanet al. 1992) or back-ground selection (Charlesworthet al. 1993) is hypoth-esized to remove nucleotide variation at linked loci. The chromosomal location of all three genes was deter-mined by in situ hybridization; a measure of recombina-tion rate in D. melanogaster (adjusted coefficient of ex-change, ACE) was obtained from Kindahl (1994; anon1A3, 1.569; anon1E9, 0.727; anon1G5, 1.739). The observed levels of nucleotide polymorphism at the three loci show a positive correlation with recombination rate in D. melanogaster.
Particularly strong evidence for the effect of recombi-nation rate on the level of intraspecific nucleotide poly-morphism is observed at locus anon1E9. At this locus,
Figure 2.—Chromosomal in situ hybridization of gene
nucleotide diversity (p) is 23 times higher in D. simulans
anon1E9 in D. melanogaster and D. simulans. (A) Location of than in D. melanogaster, which is much more than the anon1E9 on the third chromosome of the D. melanogaster Ore-average difference between both species (Moriyama gon R strain. Major polytene band divisions are marked ac-cording to the maps inSorsa(1988). (B) Location of anon1E9
andPowell 1996). This difference is consistent with
on the third chromosome of a D. simulans strain captured at
variation in the recombination rate between the two
Soda Lake, California. One of the two inversions breakpoints
species at this locus (Sturtevant 1929;Ohnishiand
is marked by an arrow. Voelker 1979). In D. melanogaster, anon1E9 maps to
85B/C in the centromeric region of chromosome 3
(Figure 2A). Two reports described a large inversion of Li (1993), and HKA (Hudson et al. 1987) tests. The only significant deviation from neutrality is observed at this region between D. melanogaster and D. simulans. The
studies disagree about the exact breakpoints: 84B3 to locus anon1E9 in D. melanogaster. Variation at this locus shows a significant difference from neutrality in the 92C inOhnishiandVoelker(1979), and 84F1 to
93F6-7 inLemeunieret al. (1986). Figure 2B shows that this Tajima (D5 22.156, P,0.01), Fu and Li (D5 22.504, P,0.05), and HKA tests. In the latter test, a comparison inversion translocated the anon1E9 locus away from the
centromer into a region of a higher recombination rate. with the 59Adh region ofKreitmanandHudson(1991) that is often used as a supposedly neutral control region This might explain the much higher nucleotide
poly-morphism at this locus in D. simulans. rejects neutral evolution due to a lack of polymorphic sites (Table 2). We also applied the tests ofMcDonald
Tests of neutral evolution:Results of tests of neutral
evolution are summarized in Tables 2 and 3. The ob- (1998) to detect deviation from neutrality in subregions of the three genes. Across a wide range of recombina-served levels of sequence variation at loci anon1A3 and
anon1G5 in D. melanogaster and D. simulans and at locus tion rates used in these tests, we have not uncovered a
significant deviation from neutrality in any of the three anon1E9 in D. simulans do not reject a neutral model
TABLE 2
Tests of neutral evolution using estimates of total nucleotide diversity
Fu and Li’s D HKA testa
Gene Tajima’s D (with outgroup) (x2)
anon1A3
D. melanogaster 21.648 21.557 1.165
D. simulans 21.135 21.513 2.643
anon1E9
D. melanogaster 22.156** 22.504* 6.372*
D. simulans 0.107 0.150 2.540
anon1G5
D. melanogaster 0.220 0.007 2.165
D. simulans 21.061 21.541 0.232
* P,0.05, ** P,0.01.
aThe HKA test was carried out with the total number of sites. Adh 59data ofKreitmanandHudson(1991) are used as reference sequence in D. melanogaster and Gld (Hamblinand Aquadro1996) in D. simulans. Mutual comparisons of the three loci were not significant.
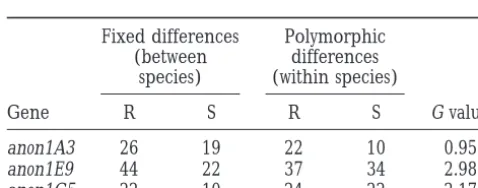
Neutral theory predicts that the ratio of silent to re- rate test of Muse andGaut (1994) using a randomly selected allele from the D. melanogaster and D. simulans placement substitutions should be identical for
poly-morphisms within species and for fixed differences samples and the D. yakuba sequence as outgroup (Table 4).
between species. This prediction is tested in the
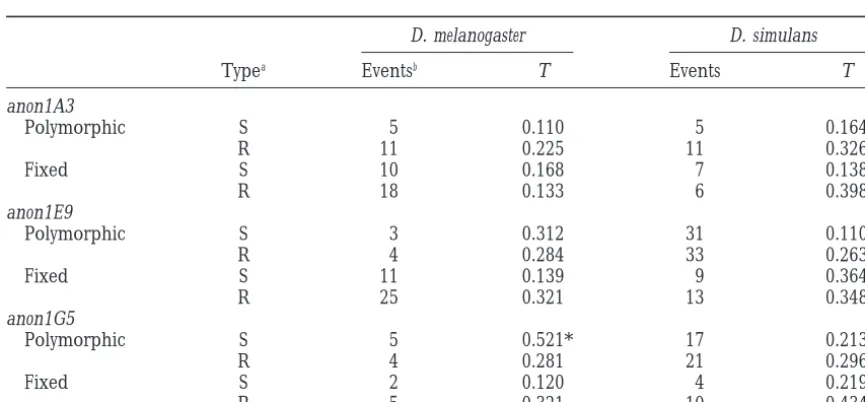
McDon-ald-Kreitman (MK) test (McDonald and Kreitman The test by Tang and Lewontin (1999) detected 1991). Table 3 shows that the MK test does not reject differences in the spatial distribution of substitutions the null hypothesis of neutral evolution in any of the along the coding region in the D. melanogaster and D. three loci. The test at locus anon1E9 is close to signifi- simulans lineages (Table 5). At loci anon1E9 and an-cance (G52.98, P50.08), because the ratio of replace- on1G5, both replacement polymorphisms and fixed dif-ment to silent substitutions is higher for fixed differ- ferences are significantly clustered in the D. simulans, ences than for polymorphisms. The MK test can be but not in the D. melanogaster lineage. At anon1E9, the modified with respect to length of regions analyzed. replacement substitutions are clustered in the linker Such tests were carried out with subregions of loci regions between the zinc-finger domains and at
an-anon1E9 and anon1G5, because in these genes replace- on1G5 in the central domain of the protein. No
differ-ment substitutions cluster in certain regions (see be- ence between the two lineages was seen at anon1A3. low). The coding sequence of gene anon1E9 was parti- The test shows a homogeneous distribution of silent tioned in four subregions: the N-terminal domain, the polymorphisms and silent fixed differences in five out first zinc-finger cluster, the linker between the two zinc- of six comparisons. The only significant clustering of finger clusters, and the second zinc-finger cluster (Fig- synonymous substitutions is seen at locus anon1G5 in ure 1). None of the subregion MK tests were significant. D. melanogaster. There, silent polymorphisms are absent The same result was obtained with anon1G5, which is in the region that shows a large number of replacement characterized by two conserved N- and C-terminal re- polymorphisms.
gions and a very rapidly evolving central domain (analy-ses not shown).
Lineage effects: We used D. yakuba as outgroup to TABLE 3
assign fixed substitutions to either the D. melanogaster
McDonald-Kreitman test of neutral evolution or D. simulans lineages. The number of these
substitu-tions was then compared between lineages using the Fixed differences Polymorphic relative-rate test described byTajima(1993). Under the (between differences null hypothesis of neutral evolution, there should be species) (within species)
no significant differences in the number of substitutions
Gene R S R S G value
between D. melanogaster and D. simulans lineages. Table
anon1A3 26 19 22 10 0.95
4 shows that significant rate differences were observed
anon1E9 44 22 37 34 2.98
only for locus anon1A3. There are more than three times
anon1G5 22 10 24 22 2.17
more replacement substitutions in the D. melanogaster than in the D. simulans lineage (18:6, x2 5 6.0, P ,
R, replacement; S, silent substitutions. None of the G values is significant (P.0.05).
relative-TABLE 4 The comparison of the frequency spectra of replace-ment, unpreferred, and preferred silent substitutions Relative-rate tests
in different lines provides further evidence for the na-ture and direction of weak selection within populations.
A. Relative-rate test afterTajima(1993)a
Since the three different types of mutation are
inter-Replacement Silent
spersed along the sequence, identical frequency distri-butions of polymorphisms in each class are expected
Gene MEL SIM x2 MEL SIM x2
under a neutral model. This prediction forms the basis anon1A3 18 6 6.00* 10 7 0.53
of tests for neutrality developed by Akashi, which are anon1E9 25 13 3.79 11 9 0.20
powerful for detecting weak selection if the assumptions
anon1G5 5 10 1.67 2 4 0.67
of the test are met (Akashi 1997, 1999; Akashi and
B. Relative-rate test ofMuseandGaut(1994)b
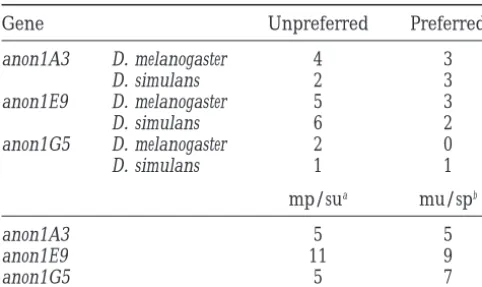
Schaeffer1997). Preferred and unpreferred polymor-phisms do not to appear to have different fitness effects x2
at all three loci, and there is little evidence for the strong
Gene LRS LRN LRB
major codon usage observed in many other Drosophila anon1A3 0.23 5.65* 5.88 genes (Akashi 1995). The numbers of preferred and anon1E9 0.02 1.75 1.77 unpreferred silent substitutions are relatively similar to anon1G5 3.54 0.15 3.71 each other in D. melanogaster and D. simulans (Table
6). In most other Drosophila genes studied so far, the
* P,0.05.
number of unpreferred silent substitutions exceeds
pre-aFixed silent and replacement substitutions were
parti-tioned between D. melanogaster and D. simulans lineages using ferred substitutions in the D. melanogaster line. This is
D. yakuba as outgroup. Sites with gaps or multiple substitutions supported by comparisons of frequency distributions of
were excluded. The significance of thex2statistic was
calcu-preferred and uncalcu-preferred silent substitutions in the
lated from ax2distribution with 1 d.f.
fdMWU and fddMWU tests. Frequency distributions are
bOne random allele was chosen from the D. melanogaster
somewhat biased toward low frequencies and are not
and D. simulans populations for this analysis. D. yakuba was
used as an outgroup. The test statistic is the likelihood ratio significantly different from each other at all three loci of different models. Its distribution is not significantly differ- in both species. Similarly, no significant differences ent from a theoreticalx2distribution. LRS compares the
synon-between frequency distributions of replacement and
ymous rates in the two lineages (1 d.f.), LRN the
nonsynony-preferred or unnonsynony-preferred silent polymorphisms are
ob-mous rates (1 d.f.), and LRB both rates simultaneously (2
served, although frequencies of replacement
poly-d.f.).
morphisms tend to be lower (results not shown).
TABLE 5
Test for heterogeneity in the location of lineage-specific substitutions along the coding sequence (Tang and Lewontin 1999)
D. melanogaster D. simulans
Typea Eventsb T Events T
anon1A3
Polymorphic S 5 0.110 5 0.164
R 11 0.225 11 0.326
Fixed S 10 0.168 7 0.138
R 18 0.133 6 0.398
anon1E9
Polymorphic S 3 0.312 31 0.110
R 4 0.284 33 0.263*
Fixed S 11 0.139 9 0.364
R 25 0.321 13 0.348*
anon1G5
Polymorphic S 5 0.521* 17 0.213
R 4 0.281 21 0.296*
Fixed S 2 0.120 4 0.219
R 5 0.321 10 0.434*
Lineage-specific fixed differences were determined by aligning the D. melanogaster and D. simulans sequences with D. yakuba (see main text).
* P,0.05.
aR, replacement substitution; S, silent substitution.
TABLE 6 both species. Three different hypotheses could explain this: a high mutation rate, a lack of constraints (high Changes in codon preference at fixed silent substitutions
rate of neutral evolution), or positive selection. These factors will be discussed in turn.
Gene Unpreferred Preferred
No evidence for a higher mutation rate:It has been
anon1A3 D. melanogaster 4 3 suggested that mutation rates may be variable in the
D. simulans 2 3
genome of Drosophila. Interspecific DNA-DNA hybrid-anon1E9 D. melanogaster 5 3
ization revealed a substantial fraction of single-copy
D. simulans 6 2
DNA in the Drosophila genome that evolves rapidly anon1G5 D. melanogaster 2 0
D. simulans 1 1 (Wermanet al. 1990). Sequencing of a boundary of fast and slowly evolving genomic regions led to the notion
mp/sua mu/spb
that the differences are not due to selection but to anon1A3 5 5 different mutation rates (Martin and Meyerowitz
anon1E9 11 9 1986). However, a high mutation rate is not supported
anon1G5 5 7 as a plausible explanation for the rapid sequence
diver-gence at the loci surveyed in this study. A high mutation
Fixed changes at silent sites were classified as preferred
to unpreferred and unpreferred to preferred according to rate should also affect silent sites of a locus and, conse-Akashi(1995). quently, a high silent substitution rate (in the absence
aSilent substitutions encoding preferred codons in D.
mela-of codon usage bias, which is the case at all three loci) nogaster (mp) and unpreferred codons in D. simulans (su).
would be expected. Compared to the silent divergence
Two randomly chosen alleles from each species were
com-between D. melanogaster and D. simulans in the genes
pared (seeAkashi1995).
bmu, unpreferred in D. melanogaster ; sp, preferred in D.
surveyed byMoriyamaandPowell(1996), no larger simulans. numbers of silent substitutions per site are observed in
interspecific comparisons of the three loci in this study (Table 7). Additionally, in our earlier screen (Schmid DISCUSSION
and Tautz 1997), 18 pairs of homologous sequences (including the three loci of this study) were compared The present survey in D. melanogaster and D. simulans
demonstrates that the proteins encoded by loci between D. melanogaster and D. yakuba. Among all genes, the numbers of synonymous substitutions per site varied anon1A3, anon1E9, and anon1G5 exhibit a large degree
of amino acid sequence variation not only between only 4-fold, while the numbers for replacement tions varied 30-fold. Since the number of silent substitu-(SchmidandTautz1997) but also within species. The
common characteristic of all three loci is that, in their tions per site is similar among all genes and is not corre-lated with the number of nonsynonymous substitutions, coding regions, more replacement than silent
substitu-tions are segregating within populasubstitu-tions and are fixed it is unlikely that the rapid evolution of these genes is driven by a high locus-specific mutation rate.
between closely related species. At most loci that were
studied in Drosophila, the opposite pattern was ob- No evidence for strong positive selection:The other two hypotheses, namely neutral evolution and positive served, namely an excess of silent over replacement
substitutions within populations and between species. selection, were analyzed with various tests for neutral evolution.KreitmanandAkashi(1995) reviewed evi-For example, in a survey of nucleotide polymorphism
in Drosophila (22 loci from D. melanogaster, 12 loci from dence that patterns of polymorphism and divergence seen at many loci under study in Drosophila are not in
D. simulans;MoriyamaandPowell1996), and in more
recent studies of Gld (Hamblin and Aquadro 1997), accord with the hypothesis that the variation seen is strictly neutral or unaffected by linked sites. Positive
white (KirbyandStephan1995, 1996), Tpi (Hassonet
al. 1998), and hunchback (TautzandNigro1998), more selection, purifying selection, and differences in
recom-bination must be taken into account to explain the data. silent than replacement polymorphisms in the coding
region are segregating in populations of D. melanogaster In fact, in the survey ofMoriyamaandPowell(1996), about half of the loci from D. melanogaster and D. sim-and D. simulans. In the study ofMoriyamaandPowell
(1996), 26.4% of all polymorphisms in D. melanogaster ulans failed one of the tests for neutrality. Other studies also uncovered certain deviations from neutrality in a and 11.6% in D. simulans were replacement
polymor-phisms. Only at loci encoding the sperm-gland accessory number of loci (Gld,HamblinandAquadro1997;
con-certina,WayneandKreitman1996; hunchback,Tautz
protein Acp26Aa (Aguade´ et al. 1992; Tsaur and Wu
1997; Aguade´ 1998; Tsaur et al. 1998) and the viral andNigro1998; white,KirbyandStephan1995; ref(2)p, Wayneet al. 1996). At the three loci surveyed in this resistance protein ref(2)p (Wayneet al. 1996) were more
replacement than silent polymorphisms observed, and study, despite the high level of amino acid polymor-phism and divergence, neutrality was not rejected by they evolve under positive selection. Therefore, it is
TABLE 7
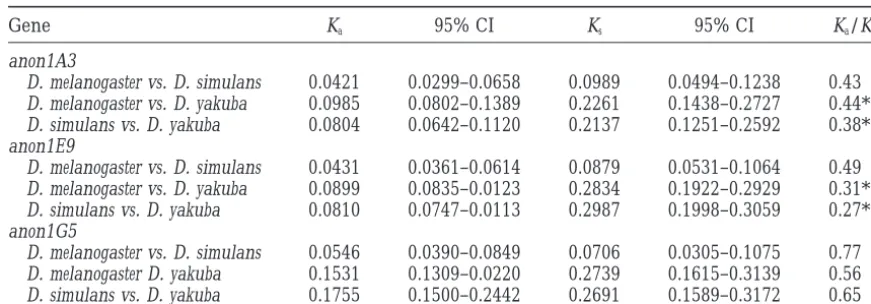
Number of nonsynonymous and synonymous substitutions per site between
D. melanogaster,D. simulans, andD. yakuba
Gene Ka 95% CI Ks 95% CI Ka/Ks
anon1A3
D. melanogaster vs. D. simulans 0.0421 0.0299–0.0658 0.0989 0.0494–0.1238 0.43
D. melanogaster vs. D. yakuba 0.0985 0.0802–0.1389 0.2261 0.1438–0.2727 0.44*
D. simulans vs. D. yakuba 0.0804 0.0642–0.1120 0.2137 0.1251–0.2592 0.38*
anon1E9
D. melanogaster vs. D. simulans 0.0431 0.0361–0.0614 0.0879 0.0531–0.1064 0.49
D. melanogaster vs. D. yakuba 0.0899 0.0835–0.0123 0.2834 0.1922–0.2929 0.31**
D. simulans vs. D. yakuba 0.0810 0.0747–0.0113 0.2987 0.1998–0.3059 0.27**
anon1G5
D. melanogaster vs. D. simulans 0.0546 0.0390–0.0849 0.0706 0.0305–0.1075 0.77
D. melanogaster D. yakuba 0.1531 0.1309–0.0220 0.2739 0.1615–0.3139 0.56
D. simulans vs. D. yakuba 0.1755 0.1500–0.2442 0.2691 0.1589–0.3172 0.65
Numbers and confidence intervals (CI) were determined with the program Kestim (Comeron1995). Ka/Ks ratios were tested for significant difference from 1 based on the confidence intervals.
* P,0.05, ** P,0.01.
acid sequences is not driven by strong selection for Nearly neutral polymorphisms: The fixation rate of completely neutral mutations is determined only by the sequence divergence, which, for example, was
impli-cated in the rapid evolution of the accessory gland pro- mutation rate (Kimura 1983), while the fixation of nearly neutral mutations is also dependent on the effec-tein, Acp26Aa (Tsaur and Wu 1997; Aguade´ 1998;
Tsaur et al. 1998). All nucleotide polymorphisms at tive population size. In small populations, nearly neutral mutations behave effectively neutral if Nes,1, and their locus anon1E9 in Drosophila melanogaster are singletons
and cause negative Tajima’s D and Fu and Li’s D values, fate is determined mainly by random drift (Ohta1973, 1992). Different average heterozygosities of D. melano-which suggest that the excess of rare polymorphisms is
due to a recent selective sweep at this locus. However, gaster and D. simulans genes suggest that the effective total population size of D. melanogaster is three to six anon1E9 may not have been the target of this selective
sweep. First of all, the MK test at this locus is not signifi- times smaller than that of D. simulans (Aquadroet al. 1988; Aquadro1992; Moriyama andPowell 1996). cant, so there is no evidence for selection in the protein.
Further, this gene resides in a region of very low recom- Under a neutral model, slightly deleterious mutations are expected to be more efficiently removed from D. bination, and the lack of polymorphic sites may result
from hitchhiking with a recent selective sweep at an- simulans than D. melanogaster populations, and slightly advantageous mutations should be more frequently other linked locus (Maynard SmithandHaigh1974;
Berryet al. 1991). As recent theoretical studies on selec- fixed in D. simulans. Both the relative-rate test and the test byTangandLewontin(1999) detect lineage-spe-tion incorporating the effects of recombinalineage-spe-tion suggest,
background selection may also be strong enough to cific differences at the three loci, supporting the hypoth-esis that a substantial number of segregating replace-decrease the level of polymorphism in centromeric
re-gions as seen at locus anon1E9 (Hudson andKaplan ment polymorphisms are not neutral but slightly deleterious. The relative-rate test reveals a significantly 1995;Nordborget al. 1996). But Tajima’s D is highly
(and significantly) negative, which is not predicted by larger number of replacement substitutions at locus anon1A3 in the D. melanogaster lineage. The Tang and background selection (Charlesworthet al. 1995). The
most compelling evidence against selection-driven di- Lewontin test shows that nonsynonymous substitutions are clustered at anon1E9 and anon1G5 in D. simulans, vergence at locus anon1E9 comes from the fact that the
region harboring this gene is inverted in D. simulans but not in D. melanogaster (Table 5). A similar pattern was also found in the G6pd gene, where a larger number relative to D. melanogaster. Because of this chromosomal
inversion, anon1E9 is located in the middle of chromo- of replacement substitutions could be observed in the
D. simulans lineage (Eaneset al. 1996). The MK test was
somal arm 3R in D. simulans where recombination rates
are higher than in the centromeric region. The ob- highly significant in this case due to an excess of fixed replacement substitutions, indicating the occurrence of served level of polymorphism in D. simulans is 10-fold
higher, and in this species, the tests for neutrality do positive selection in the D. simulans lineage. At anon1G5, the number of replacement substitutions is also larger not give any evidence for the hypothesis that the rapid
test, and the MK test gives no evidence for an excess of study was to determine whether the large variation of amino acids we observed between species also exists replacement substitutions. Replacement substitutions
are also clustered at anon1E9 in the D. simulans sample, within populations of Drosophila. This is achieved most easily by comparing individuals sampled from across the but the number of replacement substitutions in the D.
simulans lineage is smaller than in the D. melanogaster whole geographic distribution of a species. Therefore,
we sequenced alleles from worldwide collections of D. lineage. The lineage effects at anon1A3 and anon1E9
loci are probably due to the smaller effective population melanogaster and D. simulans lines and only small num-bers of alleles from the same local populations. Such size in D. melanogaster. A certain proportion of the
substi-tutions appears to be slightly deleterious with selection a sample, however, does not allow an analysis of the geographic population structure of species or an identi-coefficients too small to be “seen” by selection (Nes ,
1), but large enough to be removed from D. simulans fication of different patterns of selection in local popula-tions. For example, population-specific sweeps for cer-populations, particularly if they occur in constrained
regions of the protein. This conclusion is supported by tain loci were detected in a study of microsatellite variation in separate populations across the world a comparison of the frequency distributions of
replace-ment and silent (preferred and unpreferred) substitu- (Schlo¨ ttereret al. 1997). Also, more detailed analyses of populations of D. melanogaster and D. simulans have tions. In comparison to silent polymorphisms, the
distri-bution of replacement polymorphisms tends to be revealed that both species indeed exhibit a considerable amount of population structure (BegunandAquadro skewed toward low frequencies, suggesting that most of
them are slightly deleterious. 1993; Hamblin and Veuille 1999). Nucleotide poly-morphism of surveyed loci can vary significantly between
Nucleotide polymorphism and interspecific
diver-gence:Sequences that evolve under a neutral model are different populations and affect tests of neutrality if they
assume a mutation-drift equilibrium. For example, at expected to show a correlation between interspecific
divergence and intraspecific polymorphism (Kimura the Gld locus in D. melanogaster (HamblinandAquadro 1997), the ratio of replacement to silent substitutions 1983). This prediction was not met in several studies
of polymorphism and divergence in Drosophila, where is significantly elevated (in a MK test) in the Chinese population sample, but not in two samples from Africa polymorphism was lower (particularly in regions of low
recombination) than expected from the interspecific or a third sample from North America. In our sample, singletons may not necessarily be rare alleles (although divergence (BegunandAquadro1991, 1992;Berryet
al. 1991;Langleyet al. 1993). For example, a survey of they are treated like that in Tajima’s test, therefore
rendering D negative), but could segregate at high fre-the cubitus interruptusDlocus on the fourth chromosome
did not uncover a single polymorphism in D. melanogas- quency in their local populations. A more comprehen-sive survey might reveal significant population
differen-ter and only one in D. simulans (Berryet al. 1991). Yet,
the level of sequence divergence between both species tiation at the three genes.
An additional problem is that current tests of neutral isz5%. This lack of correlation was explained by genetic
hitchhiking with selective sweeps or background selec- evolution are useful for detecting strong positive selec-tion, but do not reject the null hypothesis of neutral tion that removed most or all polymorphism within
re-gions linked to the affected one. evolution if selection coefficients are small. Power analy-ses have shown that Tajima’s D and Fu and Li’s D fail The results of this survey are consistent with the
find-ings of the earlier studies. Levels of nucleotide polymor- to detect a selective sweep when it occurred in the dis-tant past or very recently and that their power is low phism among the three loci are different and correlate
with the recombination rate. Under a neutral model, with small sample sizes (Simonsenet al. 1995). Similar results were obtained in an analysis of the HKA test (M. divergence between species should correspond to the
observed level of nucleotide polymorphism. This is not Ford and C. F. Aquadro, unpublished results). This situation becomes even more complicated because weak observed; rather, the synonymous (Ks) and
nonsynony-mous divergences (Ka) are very similar among the three and episodic selection models produce patterns of nu-cleotide polymorphism under realistic parameters that loci between D. melanogaster and D. simulans (Table 7).
This is particularly evident at locus anon1E9, where D. are indistinguishable from neutral evolution in a test like Tajima’s D (Gillespie1994). The existence of weak melanogaster exhibits much less polymorphism (e.g.,
si-lent sites: p 50.0001) than D. simulans (p 50.0032), selection and the problems associated with detecting it are now widely acknowledged (Akashi1996;Kreitman yet the numbers of substitutions per site of D.
melanogas-ter and D. simulans are similar when compared to D. 1996; Ohta1996; OhtaandGillespie 1996; Wayne
andSimonsen1998).
yakuba (D. melanogaster vs. D. yakuba, Ks 5 0.2834; D.
simulans vs. D. yakuba, Ks50.2987). Although strong positive selection does not seem to
drive the rapid evolution of the three loci, we do not
Limitations of neutrality tests:Although tests for
neu-tral evolution suggest that most sequence evolution in entirely exclude (for reasons discussed above) the possi-bility that at least a certain proportion of the large num-these genes is neutral or nearly neutral, our results need
weak positive or balancing selection. For example, in genome. In these cases, additional studies such as a genetic analysis or a determination of the protein struc-the complete absence of positive selection, one would
expect a higher nonsynonymous rate in the D. melanogas- ture will be necessary for identifying the function of these proteins. It will also be important to study whether ter lineage, because of its smaller effective population
size; not only completely neutral but also slightly delete- these genes contribute to the phenotypic differences between species (TautzandSchmid1997).
rious substitutions should get fixed in this lineage.
In-deed, at loci anon1A3 and anon1E9, more replacement This article is dedicated to the memory of our collaborator Lore-substitutions occur in the D. melanogaster lineage. In the dana Nigro who sadly died in October 1998. We thank M. Hamblin for advice about in situ hybridization and the members of the Aquadro
most rapidly evolving gene anon1G5, however, more
lab for discussion. This work was supported by a postdoctoral
fellow-replacement substitutions occur in the D. simulans
lin-ship of the Deutsche Forschungsgemeinschaft (DFG) to K.J.S., an
eage (Table 4). Although the relative-rate test and the European Molecular Biology Organization short-term fellowship to other tests for neutral evolution do not reject neutral L.N., a National Institutes of Health grant to C.F.A., and various DFG evolution, the existence of some positive selection can- grants to D.T.
not be entirely excluded.
Implications for genome-wide surveys of nucleotide
polymorphism:The three loci we surveyed for this study LITERATURE CITED
constitute a random sample of protein coding genes Aguade´, M.,1998 Different forces drive the evolution of the Acp26Aa
and Acp26Ab accessory gland genes in the Drosophila melanogaster
from the genome of Drosophila with regard to
pheno-species complex. Genetics 150: 1079–1089.
typic effects. Although their biochemical functions are
Aguade´, M., N. MiyashitaandC. H. Langley,1992 Polymorphism
probably very different, their common characteristic is and divergence in the Mst26A male accessory gland gene region
in Drosophila. Genetics 132: 755–770.
the fast evolution of their amino acid sequence as shown
Akashi, H.,1995 Inferring weak selection from patterns of
polymor-in our previous screen (SchmidandTautz1997) and
phism and divergence at “silent” sites in Drosophila DNA.
Genet-in this study. Because of the random isolation of these ics 139: 1067–1076.
Akashi, H.,1996 Molecular evolution between Drosophila
melanogas-clones, it is possible to estimate the fraction of genes
ter and D. simulans: reduced codon bias, faster rates of amino
in the Drosophila genome that are expected to show
acid substitution, and larger proteins in D. melanogaster. Genetics
similar rates of evolution. In the original screen, about 144:1297–1307.
Akashi, H.,1997 Codon bias in Drosophila: population genetics of
one-third of z100 clones was scored as fast evolving
mutation-selection drift. Gene 205: 269–278.
by genomic cross-hybridization experiments. Sequence
Akashi, H.,1999 Inferring the fitness effects of DNA mutations
comparisons of 10 clones with their D. yakuba homologs from polymorphism and divergence data: statistical power to
detect directional selection under stationarity and free
recombi-lead to the estimate thatz20% of the Drosophila genes
nation. Genetics 151: 221–238.
are fast evolving and exhibit a large number of
replace-Akashi, H.,andS. W. Schaeffer,1997 Natural selection and the
ment polymorphisms. Since the Drosophila genome frequency distribution of “silent” DNA polymorphism in
Dro-sophila. Genetics 146: 295–307.
probably has a similar number of genes as Caenorhabditis
Aquadro, C. F.,1992 Why is the genome variable? Insights from
elegans (z19,000;C. elegansSequencing Consortium
Drosophila. Trends Genet. 8: 355–362.
1998), several thousand Drosophila genes can be ex- Aquadro, C. F., K. M. LadoandW. A. Noon,1988 The rosy region
of Drosophila melanogaster and Drosophila simulans. I. Contrasting
pected to evolve with few evolutionary constraints.
levels of naturally occurring DNA restriction map variation an
We propose that a similar proportion of rapidly
evolv-divergence. Genetics 119: 875–888.
ing genes can be expected in the genomes of other Aquadro, C. F., D. J. BegunandE. C. Kindahl,1994 Selection,
recombination and DNA polymorphism in Drosophila, pp. 46–56
eukaryotes. All three genes of this study have no or only
in Non-neutral Evolution: Theories and Molecular Data, edited by
low sequence similarity to genes from other species and
B. Golding.Chapman & Hall, New York.
therefore are “orphans.” Since orphans are also com- Begun, D. J.,andC. F. Aquadro,1991 Molecular population
genet-ics of the distal portion of the X chromosome in Drosophila:
mon in other eukaryotes whose genome has been
par-evidence for genetic hitchhiking of the yellow-achaete region.
Ge-tially or completely sequenced (Goffeau et al. 1996;
netics 129: 1147–1158.
Bevanet al. 1998;C. elegansSequencing Consortium Begun, D. J.,andC. F. Aquadro,1992 Levels of naturally occurring
DNA polymorphism correlate with recombination rates in D.
1998), it is probable that these fast evolving genes are
melanogaster. Nature 356: 519–520.
ubiquitous components of eukaryotic genomes. It will
Begun, D.,andC. F. Aquadro,1993 African and North American
be interesting to explore the long-term evolution of populations of Drosophila melanogaster are very different at the
DNA level. Nature 365: 548–550.
these rapidly evolving genes and their utility for
phyloge-Berry, A. J., J. W. AjiokaandM. Kreitman,1991 Lack of
polymor-netic analyses of closely related taxa. It will also be of
phism on the Drosophila fourth chromosome resulting from
critical importance to understand the relationship be- selection. Genetics 129: 1111–1117.
Bevan, M., I. Bancroft, E. Bent, K. Love, H. Goodmanet al., 1998
tween the rapid sequence evolution and the structure
Analysis of 1.9 Mb of contiguous sequence from chromosome 4
and function of the proteins encoded by these genes.
of Arabidopsis thaliana. Nature 391: 485–488.
If there is only little conservation on sequence level, it C. elegansSequencing Consortium,1998 Genome sequence of
the nematode C. elegans: a platform for investigating biology.
may not be possible to identify homologs in other phyla
Science 282: 2012–2018.
(if they exist there at all). For example, we were not
Charlesworth, B., M. T. MorganandD. Charlesworth,1993
able to detect significant sequence similarity between The effect of deleterious mutations on neutral molecular
varia-tion. Genetics 134: 1289–1303.
Charlesworth, D., B. CharlesworthandM. T. Morgan,1995 general phenomenon in the evolution of abalone sperm lysin. Mol. Biol. Evol. 12: 231–238.
The pattern of neutral molecular variation under the background
Lemeunier, F., J. R. DavidandL. Tsacas,1986 The melanogaster selection model. Genetics 141: 1619–1632.
species group, pp. 147–256 in The Genetics and Biology of Drosophila, Comeron, J. M.,1995 A method for estimating the numbers of
Vol. 3e, edited byM. AshburnerandE. Novitsiki.Academic synonymous and nonsynonymous substitutions per site. J. Mol.
Press, London. Evol. 41: 1152–1159.
Li, W.-H.,1997 Molecular Evolution. Sinauer Associates, Sunderland,
Eanes, W. F., M. Kirchner, J. Yoon, C. H. Biermann, M. A.
McCart-MA. neyet al., 1996 Historical selection, amino acid polymorphism
Lim, J. K.,1993 In situ hybridization with biotinylated DNA. Dros.
and lineage-specific divergence at the G6pd locus in Drosophila
Inf. Serv. 72: 73–76.
melanogaster and D. simulans. Genetics 144: 1027–1041.
Martin, C. H.,andE. M. Meyerowitz,1986 Characterization of the Fitch, W. M., J. M. E. Leiter, X. LiandP. Palese,1991 Positive
boundaries between adjacent rapidly and slowly evolving genomic Darwinian evolution in human influenza A viruses. Proc. Natl.
regions in Drosophila. Proc. Natl. Acad. Sci. USA 83: 8654–8658. Acad. Sci. USA 88: 4270–4274.
Maynard Smith, J.,andJ. Haigh,1974 The hitch-hiking effect of Fu, Y.-Y.,andW.-H. Li,1993 Statistical tests of neutrality of
muta-a fmuta-avourmuta-able gene. Genet. Res. 23: 23–35. tions. Genetics 133: 693–709.
McDonald, H.,andM. Kreitman,1991 Adaptive evolution at the Gillespie, J. H.,1994 Alternatives to the neutral theory, pp. 1–17
Adh locus in Drosophila. Nature 351: 652–654.
in Non-neutral Evolution, edited byB. Golding.Chapman & Hall,
McDonald, J. H.,1998 Improved tests for heterogeneity across a New York.
region of DNA sequence in the ratio of polymorphism to diver-Goffeau, A., B. G. Barrell, H. Bussey, R. W. Davis, B. Dujonet
gence. Mol. Biol. Evol. 15: 377–384.
al., 1996 Life with 6000 genes. Science 274: 563–567.
Metz, E. C.,andS. R. Palumbi,1996 Positive selection and sequence Hamblin, M. T., and C. F. Aquadro, 1996 High nucleotide
se-rearrangements generate extensive polymorphism in the gamete quence variation in a region of low recombination in Drosophila
recognition protein bindin. Mol. Biol. Evol. 13: 397–406.
simulans is consistent with the background selection model. Mol.
Moriyama, E. N.,andJ. R. Powell,1996 Intraspecific nuclear DNA Biol. Evol. 13: 1133–1140.
variation in Drosophila. Mol. Biol. Evol. 13: 261–277. Hamblin, M. T.,andC. F. Aquadro,1997 Contrasting patterns of
Muse, S.,andB. S. Gaut,1994 A likelihood approach for comparing non-neutral nucleotide sequence variation at the Glucose
dehydroge-synonymous and nondehydroge-synonymous nucleotide substitution rates,
nase locus in different populations of Drosophila melanogaster.
Ge-with application to the chloroplast genome. Mol. Biol. Evol. 11: netics 145: 1053–1062.
715–724. Hamblin, M. T.,andM. Veuille,1999 Population structure among
Nei, M.,1987 Molecular Evolutionary Genetics. Columbia University
African and derived populations of Drosophila simulans: evidence
Press, New York. for ancient subdivision and recent admixture. Genetics 153: 305–
Nordborg, M., D. Charlesworth andB. Charlesworth, 1996 317.
The effect of recombination on background selection. Genet. Hasson, E., I.-N. Wang, L.-W. Zeng, M. KreitmanandW. F. Eanes,
Res. 63: 159–174. 1998 Nucleotide variation in the Triosephosphate isomerase
Ohnishi, S.,andR. A. Voelker,1979 Comparative studies of allo-(Tpi) locus of Drosophila melanogaster and Drosophila simulans. Mol.
zyme loci in Drosophila melanogaster and Drosophila simulans. II. Biol. Evol. 15: 756–769.
Gene arrangements on the third chromosome. Jpn. J. Genet. 54: Hudson, R. R., andN. L. Kaplan, 1995 Deleterious background
203–209. selection with recombination. Genetics 141: 1605–1617.
Ohta, T.,1973 Slightly deleterious substitutions in evolution. Na-Hudson, R. R., M. Kreitmann andM. Aguade´, 1987 A test of
ture 246: 96–98. neutral molecular evolution based on nucleotide data. Genetics
Ohta, T.,1992 The nearly neutral theory of molecular evolution.
116:153–159.
Ann. Rev. Ecol. Syst. 23: 263–286. Hughes, A. L.,1997 Rapid evolution of immunoglobulin
superfam-Ohta, T.,1996 The current significance and standing of neutral ily C2 domains expressed in immune system cells. Mol. Biol. Evol.
and nearly neutral theories. BioEssays 18: 673–677.
14:1–5.
Ohta, T.,andJ. H. Gillespie,1996 The development of neutral Hughes, A. L., T. OtaandM. Nei,1990 Positive Darwinian selection
and nearly neutral theories. Theor. Pop. Biol. 49: 128–142. promotes charge profile diversity in the antigen-binding cleft of
Rozas, J.,andR. Rozas,1999 DnaSP version 3: an integrated
pro-class I Major-Histocompatibility-Complex molecules. Mol. Biol.
gram for molecular population genetics and molecular evolution
Evol. 7: 515–524. analysis. Bioinformatics 15: 174–175.
Kaplan, N., R. R. HudsonandC. H. Langley,1989 The “hitchhik- Sambrook, J., E. F. FritschandT. Maniatis,1989 Molecular Clon-ing effect” revisited. Genetics 116: 153–159.
ing: A Laboratory Manual. Cold Spring Harbor Laboratory Press,
Kimura, M.,1983 The Neutral Theory of Molecular Evolution. Cam- Cold Spring Harbor, NY.
bridge University Press, Cambridge. Schlo
¨ tterer, C., C. VoglandD. Tautz,1997 Polymorphism and Kindahl, E. C.,1994 Recombination and DNA polymorphism on locus-specific effects on polymorphism at microsatellite loci in the third chromosome of Drosophila melanogaster. Ph.D. Thesis, natural Drosophila melanogaster populations. Genetics 146: 309–
Cornell University. 320.
Kirby, D. A.,andW. Stephan,1995 Haplotype test reveals departure Schmid, K.,andD. Tautz,1997 A screen for fast evolving genes from neutrality in a segment of the white gene of Drosophila melano- from Drosophila. Proc. Natl. Acad. Sci. USA 94: 9746–9750.
gaster. Genetics 141: 1483–1490. Simonsen, K. L., G. A. ChurchillandC. F. Aquadro,1995
Proper-Kirby, D. A.,andW. Stephan,1996 Multi-locus selection and the ties of statistical tests of neutrality for DNA polymorphism data. structure of variation at the white gene of Drosophila melanogaster. Genetics 141: 413–429.
Genetics 144: 636–645. Smith, N. H., J. Maynard SmithandB. G. Spratt,1995 Sequence
Kreitman, M.,1996 The neutral theory is dead. Long live the neutral evolution if the porB gene of Neisseria gonorrhoeae and Neisseria theory. BioEssays 18: 678–683. meningitidis: evidence of positive Darwinian selection. Mol. Biol. Kreitman, M.,andH. Akashi,1995 Molecular evidence for natural Evol. 12: 363–370.
selection. Ann. Rev. Ecol. Syst. 26: 403–422. Sorsa, V.,1988 Chromosome Maps of Drosophila, Vol. II. CRC Press, Kreitman, M.,andR. R. Hudson,1991 Inferring the evolutionary Boca Raton, FL.
histories of the Adh and Adh-dup loci in Drosophila melanogaster Stephan, W., T. H. E. WieheandM. W. Lenz,1992 The effect of from patterns of polymorphism and divergence. Genetics 127: strongly selected substitutions on neutral polymorphism:
analyti-565–582. cal results based on diffusion theory. Theor. Popul. Biol. 41:
Langley, C. H., J. McDonald, N. MiyashitaandM. Aguade´,1993 237–254.
Lack of correlation between interspecific divergence and intra- Sturtevant, A. H.,1929 The genetics of Drosophila simulans. Carne-specific polymorphism at the suppressor of forked region in Dro- gie Inst. Wash. Publ. No. 339: 1–62.
sophila melanogaster and Drosophila simulans. Proc. Natl. Acad. Sci. Sutton, K. A.,andM. F. Wilkinson,1997 Rapid evolution of a
USA 90: 1800–1803. homeodomain: evidence for positive selection. J. Mol. Evol. 45:
Tajima, F.,1989 Statistical method for testing the neutral mutation Watterson, G. A., 1975 On the number of segregating sites in genetical models without recombination. Theor. Popul. Biol. 7: hypothesis by DNA polymorphism. Genetics 123: 585–595.
Tajima, F.,1993 Simple methods for testing the molecular evolution- 256–276.
Wayne, M.,andM. Kreitman,1996 Reduced variation at concertina, ary clock hypothesis. Genetics 135: 599–607.
Tang, H.,andR. C. Lewontin,1999 Locating regions of differential a heterochromatic locus in Drosophila. Genet. Res. Cambr. 68: 101–108.
variability in DNA and protein sequences. Genetics 153: 485–495.
Tautz, D.,andL. Nigro,1998 Microevolutionary divergence pat- Wayne, M. L.,andK. L. Simonsen,1998 Statistical tests of neutrality in the age of weak selection. Trends Ecol. Evol. 13: 236–240. tern of the segmentation gene hunchback in Drosophila. Mol. Biol.
Evol. 15: 1403–1411. Wayne, M. L., D. ContamineandM. Kreitman,1996 Molecular
Tautz, D.,and K. J. Schmid, 1997 From genes to individuals— population genetics of ref(2)p, a locus which confers viral resis-developmental genes and the generation of the phenotype. Proc. tance in Drosophila. Mol. Biol. Evol. 13: 191–199.
Roy. Soc. Ser. B 353: 231–240. Werman, S., E. H. DavidsonandR. J. Britten,1990 Rapid
evolu-Tsaur, S.-C.,andC.-I. Wu,1997 Positive selection and molecular tion in a fraction of the Drosophila nuclear genome. J. Mol. Evol. evolution of a gene of male reproduction, Acp26Aa of Drosophila. 30:281–289.
Mol. Biol. Evol. 14: 544–549. Whitfield, L. S., R. Lovell-BadgeandP. N. Goodfellow,1993
Tsaur, S.-C., C.-T. TingandC.-I. Wu,1998 Positive selection driving Rapid sequence evolution of the mammalian sex-determining the evolution of a gene of male reproduction, Acp26Aa, of Dro- gene SRY. Nature 364: 713–715.
sophila. II. Divergence versus polymorphisms. Mol. Biol. Evol.