__________________________________________________________________
Using Neuro-Cognitive Modelling to Link Attention
Deficits to Structural and Functional Brain Changes
Dissertation der
Graduate School of Systemic Neurosciences der
Ludwig-Maximilians-Universität München
Julia Neitzel
__________________________________________________________________
Using Neuro-Cognitive Modelling to Link Attention
Deficits to Structural and Functional Brain Changes
Dissertation at the
Graduate School of Systemic Neurosciences at the
Ludwig-Maximilians-Universität München
Submitted by
Julia Neitzel
Munich, 28 February 2017
Date of Defense: 26 June 2017
First Supervisor and Reviewer: PD Dr. Kathrin Finke
Second Supervisor and Reviewer: Dr. Christian Sorg
Third Supervisor: Prof Dr. Hermann Müller
i ABSTRACT
‘Visual attention’ is an emerging property of interconnected neural networks, in which the interconnections are biased to promote targets over distracting stimuli. It has been shown that efficiency of the attention system is lost after many kinds of brain damage, with each presumably effecting different aspects of basic visual attention functions. Yet, our understanding of these processes is limited by the methodological shortcomings of classical neuropsychological assessment. The overarching goal of the current thesis was to overcome these constrains and thereby extend the link between attention deficits and underlying brain changes. The here used approach incorporates parametric measurement of visual attention derived from the computational Theory of Visual Attention (TVA, Bundesen, 1990) and modern magnetic resonance imaging techniques.
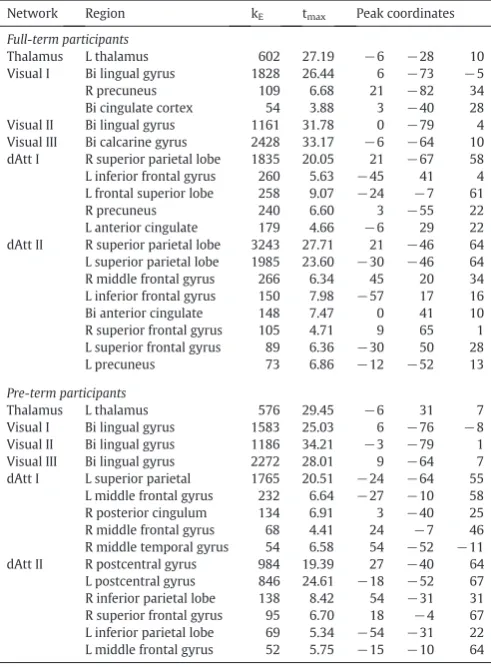
Project 1 of the current thesis applied a combined TVA–neuroimaging analysis in a neurodevelopmental model (preterm birth) to relate attention deficits with changes in functional connectivity networks. We found that pre- versus full-term born adults show a selective reduction of visual short-term memory capacity. The remarkable changes we observed in attention-related large-scale brain networks of the occipital and posterior parietal cortices were most pronounced in those preterm born individuals with the most preserved attention functions. This finding was interpreted as evidence for a compensatory reorganization of functional connectivity in order to ameliorate the advert consequences of preterm birth on visual short-term memory.
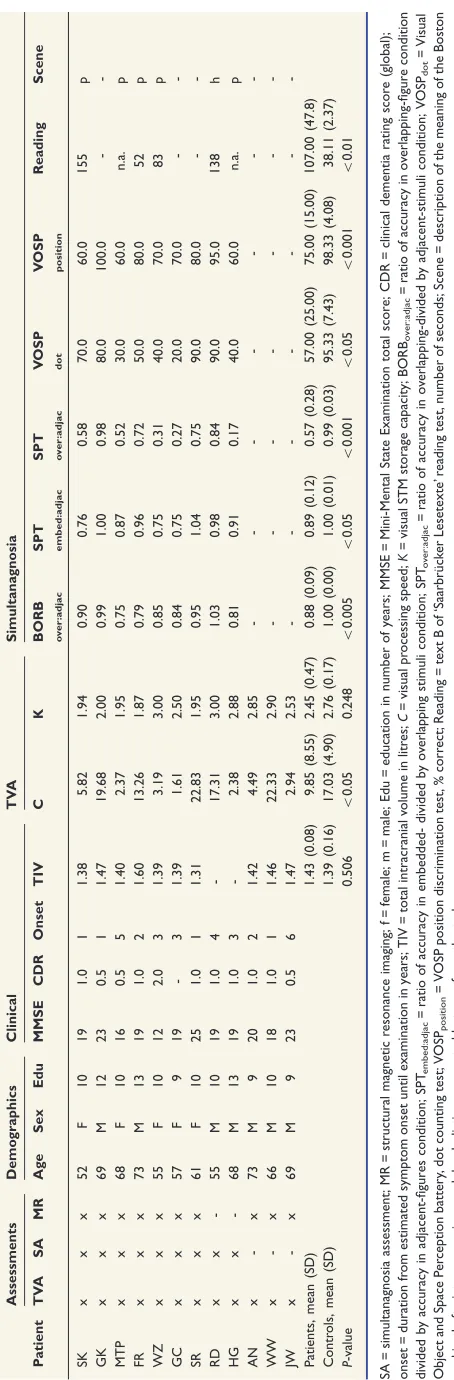
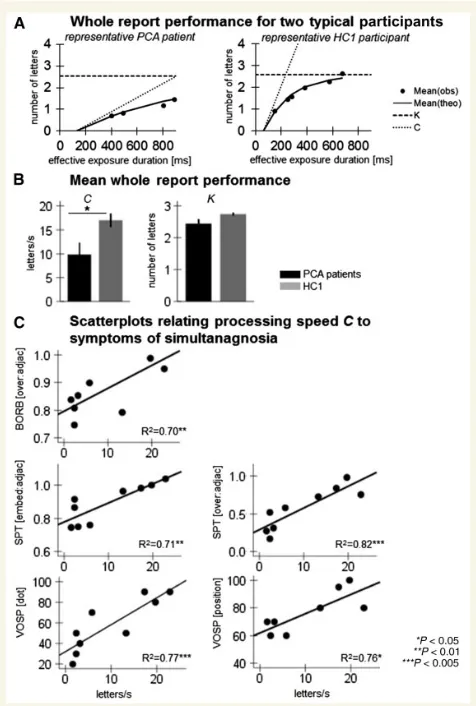
Project 2 of this thesis applied a combined TVA-neuroimaging analysis in a neurodegenerative model (posterior cortical atrophy) to relate attention deficits with structural changes in grey and white matter morphometry. Compared to healthy control participants, patients with posterior cortical atrophy suffered from a selective disturbance of visual processing speed. The individual rate of processing speed slowing was a valid predictor for the severity of simultanagnosia, the core symptom in this clinical condition. We further found wide-spread atrophy in occipital as well as parietal and to a smaller degree in temporal brain areas. White matter degeneration in the superior parietal lobe, rather than atrophy of any grey
ii
speed. Based on these results we propose that disruption of white matter pathways especially within the superior parietal lobe leads to reduced processing speed which then results in the overt clinical symptoms of simultanagnosia.
iii TABLE OF CONTENTS
ABSTRACT ... i
TABLE OF CONTENTS ... iii
1.General Introduction: Visual Attention, Deficits and the Brain ... 1
1.1. Theoretical Framework: Theory of Visual Attention ... 2
1.1.1. Biased Competition ... 2
1.1.2. Core Principles and Equations of TVA ... 3
1.1.3. Anatomy of the Visual Attention System ... 4
1.2. Methodological Basis: Assessment of Visual Attention Deficits ... 5
1.2.1. Conventional Measurements... 5
1.2.2. Parametric Measurements ... 6
1.2.3. Integrating Parametric Measurements with Neuroimaging ... 8
1.3. Clinical Examples of Visual Attention Deficits ... 9
1.3.1. Example 1: Early Developmental Disturbances ... 9
1.3.2. Example 2: Late Neurodegenerative Disturbances ... 13
1.4. Aims of This Thesis ... 16
2. Project 1: Visual Attention in Preterm Born Adults: Specifically Impaired Attentional Sub-mechanisms that Link with Altered Intrinsic Brain Networks in a Compensation-like Mode ... 19
3. Project 2: Neuro-cognitive Mechanisms of Simultanagnosia in Patients with Posterior Cortical Atrophy ... 33
4. General Discussion: Linking Attention Deficits to Structural and Functional Brain Changes ... 49
4.1. Main Findings of Each Project ... 49
4.1.1. Linking Attention Deficits to Functional Network Connectivity ... 50
4.1.2. Linking Attention Deficits to Grey and White Matter Volume ... 52
iv
4.2.1. Selective Attention Deficits ... 54
4.2.2. Specific Behavior-Brain Relationships ... 55
4.2.3. Precise Targets for Diagnosis and Therapy ... 56
4.2.4. Validating the Principles of TVA and Their Neuronal Interpretation ... 57
4.3. Methodological Considerations ... 59
4.3.1. Practicability of TVA-based Assessment ... 59
4.3.2. Underestimated Severity of Attention Deficits ... 60
4.3.3. Necessary but not Sufficient Brain Changes ... 61
4.4. Future Directions ... 62
4.4.1. Other Neuroimaging Measures ... 62
4.4.2. Different Clinical Groups ... 63
4.4.3. Cognitive Training Programs ... 65
4.5. Conclusion ... 66
REFERENCES ... 67
ACKNOWLEDGEMENTS ... 83
LIST OF PUBLICATIONS ... 85
CURRICULUM VITAE ... 87
EIDESSTATTLICHE VERSICHERUNG/AFFIDAVIT ... 89
1
1.
General Introduction: Visual
Attention, Deficits and the Brain
In complex visual scenes, attention is required to select what is relevant and disregard irrelevant information. The need for selectivity arises from the human
brain’s severe capacity limits: we can only process and use a small portion of stimuli
available on our retina at any given moment (Lennie, 2003). Hence, all objects in the visual environment compete for limited resources, whereby attention biases this competition in favor of the most relevant object (core reviews are Beck & Kastner, 2009; Desimone & Duncan, 1995; Reynolds & Chelazzi, 2004). Most modern research conforms to the view that visual attention is the working of a few specific mechanisms to resolve biased competition (Bundesen, 1990). Clearly, visual attention is critical for almost every daily life activity, and influences more general capabilities as well, for example maths skills, reading or academic achievements (McClelland et al., 2013). Visual attention is realized by organized activity across a wide-spread network of thalamo-cortical and cortico-cortical feedback loops which are mainly situated within the posterior brain (for a review see Hopf et al.,
General Introduction: Visual Attention, Deficits and the Brain
2
parametric, model-based assessment tool reveals independent and “process-pure”
measures of basic attentional functions. The projects furthermore used modern structural and functional magnetic resonance imaging techniques to identify large-scale brain changes that underlie the observed attention deficits. The General Introduction is divided into four parts. The first part describes normal visual
attention on the basis of TVA’s core principles and their neuronal interpretation. The second part focuses on disturbances of visual attention, thereby focusing on the limitations of conventional neuropsychological tests and how they can be resolved by TVA-based measurement of visual attention. The third part introduces the two clinical example groups and reviews related work on visual attention deficits and potentially associated brain changes. Finally, the fourth part summaries the aim and specific research questions of this thesis.
1.1. Theoretical Framework: Theory of Visual Attention
The Theory of Visual Attention (TVA; Bundesen, 1990) reduces the vast number of attentional phenomena to a few principle computations that can be expressed in a small set of mathematical equations and importantly estimated from performance in two simple letter recognition experiments. In order to present the theoretical framework of this thesis, the current section describes: a) the biased competition hypothesis; b) the central assumptions; and c) the neuronal interpretation of TVA.
1.1.1.Biased Competition
TVA strongly builds on the mechanistic principles of biased competition, but as we will see later, rephrased them to fit an explicative computational model. Biased competition is one of the most prevalent theories of visual attention. Its assumptions are fundamentally based on electrophysiological studies and the critical observation that smaller receptive fields of sensory neurons at lower hierarchical levels compete to drive larger higher level receptive fields (Desimone & Duncan, 1995). Clearly, larger receptive fields cover a greater angle of a visual scene, but can only represent, i.e. respond to, one object at a time. When multiple objects fall within a cell’s
1.1 Theoretical Framework: Theory of Visual Attention
3 primary visual cortex, where receptive fields are smaller and unlikely represent multiple competing objects (e.g. Luck et al., 1997; Reynolds, Chelazzi & Desimone, 1999). In the human brain, evidence for neuronal competition have been found using functional magnetic resonance imaging (fMRI) (e.g. Beck & Kastner, 2005; Kastner et al., 1998; Kastner et al., 2001). The probability by which an object is represented depends on two distinct kinds of bias signals. Bottom-up biases result from the properties of an object, e.g. its perceptual saliency or novelty, while top-down biases reflect requirements of the task, e.g. to attend to a certain spatial location. Taken together, biased completion theories hold the assumption that attention is an emerging property of competition between all objects in the visual field which is biased by characteristics of the objects and task requirements, or in other words by bottom-up and top-down influences.
1.1.2.Core Principles and Equations of TVA
The core idea of TVA holds that attentional selection means to make a perceptual
categorization following the form ‘element x belongs to category i’. An object is
said to be selected or categorized as soon as the categorization enters the visual short-term memory (STM) store. In this sense selection and categorization are no longer thought to occur after each other (cf Deutsch & Deutsch, 1963; Treisman & Gelade, 1980), but happen simultaneously. The visual STM store has limited capacity such that only a very few objects can be maintained at a time. The way in which multiple objects strive towards the visual STM store is described as a parallel race which is governed by the mechanisms of biased competition. According to TVA, each object in the visual field is assigned with an attentional weight reflecting the importance of that element according to either reflexive bottom-up bias signals that separate figure from background or goal-driven top down bias signals. The following weight equation determines the computation of the weight values:
𝑤𝑥= ∑ 𝜂(𝑥, 𝑗)𝜋𝑗 𝑗∈𝑅
where the weight of an object is given by the sensory evidence η that element x
belongs to category i of response set R, and the pertinence value π of category i. The rate equation below gives full account of the moment-to-moment probability
General Introduction: Visual Attention, Deficits and the Brain
4
ν(x, i) = 𝜂(𝑥, 𝑖)𝛽𝑖 𝑤𝑥 ∑𝑧∈𝑆𝑤𝑧
where the rate of categorizing 𝜈(x,i) is a function of the sensory evidence η that element x belongs to category i, the perceptual decision bias β associated with this category i and the weight wx of one object relative to the summed weights wz of all
the other objects in the stimulus set S. Provided with a sensory system that informs about the strength of sensory evidence and given completed computation of pertinence values and attentional weights, the attention system performs visual selection according to the rate equation. Visual attention is assumed to be determined by five latent parameters which reflect aspects of the system’s general capacity (visual threshold, visual STM storage capacity, processing speed) and specific (task-related and spatial) attentional weighting. The TVA framework provides simple assessment and model-fitting procedures on which basis these four parameters can be mathematically estimated (Duncan et al., 1999). This is an essential advantage to which will be returned in later sections. Importantly, TVA’s
principles seem to not only work in theory, but represent a valid description of how humans select visual information. Bundesen (1990) used TVA’s quantitative
precision to model a large proportion of empirical findings on human performance in classical visual recognition and attention tasks.
1.1.3.Anatomy of the Visual Attention System
1.2 Methodological Basis: Assessment of Visual Attention Deficits
5 object strive towards the visual STM store, while their speed (ν value) depends on the product of η and β values. The visual STM map of spatial locations is probably situated in the thalamic reticular nucleus. From there, information about the winners of the race is back projected to the LGN and thereby sustains neuronal activity related to the winners by positive feedback.
In summary, TVA provides a computational framework of normal visual attention, thereby integrating the problem of visual recognition and attentional selection into a unified theory. Its central assumptions are formulated in basic algebra given by the weight and rate equation. Recently, TVA’s principles had been interpreted at the level of thalamo-cortical and cortico-cortical circuits of the posterior brain. Given the dependence on intact functions of a large network, visual attention is frequently targeted by various clinical conditions.
1.2. Methodological Basis: Assessment of Visual Attention Deficits
Disturbances of visual attention are observed after many different kinds of brain damage and neuropathology, covering neurodevelopmental disorders, acquired brain injury or neurodegenerative diseases. As a consequence, research on visual attention deficits is a broad and inconsistent field. To overcome this heterogeneity and progress in the understanding, diagnosis and treatment of attention deficits, it is crucial to elucidate how certain types of brain damage affect visual attention functions. Yet, a major drawback towards this goal are the methodological issues of many clinical studies, particularly related to the week and unspecific conceptualization and measurement of attention deficits. This section outlines a) the limitations of conventional assessment tools; b) how they can be overcome by based measurement; and c) the here applied approach of combining TVA-neuroimaging analysis.
1.2.1.Conventional Measurements
General Introduction: Visual Attention, Deficits and the Brain
6
For instance, reaction time tasks or other types of speeded responses are conventionally used to determine processing speed deficits. A prominent example is the digit symbol substitution test (Wechsler, 1997), where digits and symbols are paired and patients should write down as fast as possible under each newly given digit the corresponding symbol. The number of correct symbols within the allowed time is measured. Besides the pure processing of visual information, this tasks incorporate complex motor components (e.g. the patient has to manually write symbols) that very likely contribute to response latency scores. More fundamentally, test performance cannot be easily related to a basic component of visual attention. Instead, test scores are bound to the complex task used for the assessment. Visual STM deficits are traditionally measured by immediate memory span tasks. For example, in the Corsi block-tapping test (Corsi, 1973) patients are asked to observe a sequence of blocks being tapped by the examiner, and then repeat the sequence. The number of blocks increasingly grows, whereby the sequence length which can be correctly reproduced is assessed. A serious constrain of the Corsi and many other attention span tasks is that the serial and relatively long presentation of stimuli allows verbal recoding. The use of rehearsal strategies critically impedes the pure measurement of the visual (non-strategic) attention span. To state it more generally, conventional measurements of visual attention are influenced by quite complex motor and cognitive abilities preventing a clear interpretation of the test scores. These main limitations, poor specificity and validity, can be primarily traced back to conventional tests’ foundation in the clinical routine. The designs of such tests are often determined by practicability rather than conceptual considerations. Lacking a theoretical background is also one reason why classical tests fall short on other important quality characteristics such as sensitivity and reliability.
1.2.2.Parametric Measurements
1.2 Methodological Basis: Assessment of Visual Attention Deficits
7 report as many objects as possible. Presentation times are set in a way that they
cover the whole range from an individual’s perception threshold up to near-ceiling performance. This design allows to quantify three general capacity factors of visual attention: 1) t0, visual threshold, 2) K, visual STM storage capacity and 3) C, visual processing speed. In the partial report, participants are required to identify and verbally report only a subset of stimuli specified by an a priori given criterion (usually color). This design reveals values for two selective factors of visual attention: 4) α, efficiency of top-down control and 5) wλ, spatial distribution of visual attention. A more detailed description of the test and model fitting procedures can be found elsewhere (Duncan et al., 1999).
The main advantage of TVA-based measurement is the method’s high specificity. Due to the mathematically independent fitting procedures, attentional parameters can be quantified separately from each other and with high precision. They are furthermore not confounded by motor slowing, since non-speeded verbal responses are used. Unlike many other neuropsychological tests, the method rests upon a theoretical framework that explains a wide range of the empirical effects in the literature on normal visual attention (Bundesen, 1990). Consequently, the estimated attention parameters can be interpreted as basic elements of visual attention that have been identified in the general theory. Other main strengths of the TVA method are its high sensitivity to detect attention deficits which went unnoticed by using other neuropsychological tests (e.g. Habekost & Rostrup, 2006) and its reliability which has been approved in healthy participants and patients (Finke et al., 2005; Habekost, Petersen & Vangkilde, 2014; Habekost & Rostrup, 2006).
From a practical viewpoint, it is convenient that all parameters are derived in one integrated test set-up including simple instructions and minor response requirements. Using the same set of stimuli and response formats results in highly consistent measures of lateralized and non-lateralized aspects of visual attention. The fact that the experiments can be tailored to different research interests and clinical groups (e.g. by changing layout and the stimuli of the display) as well as to the individual performance level (by adopting the exposure duration) ensures maximal flexibility for many types of studies. Another important quality is that
General Introduction: Visual Attention, Deficits and the Brain
8
and recent neuroimaging studies expand our knowledge of their neuroanatomical correlates within the healthy brain (e.g. Gillebert et al., 2012).
Owing to its many advantages compared to conventional neuropsychological tests, about 30 investigations have used TVA-based assessment today to study visual attention deficits in patients with neglect (Duncan et al., 1999; Duncan et al., 2003), parietal versus frontal stroke (Bublak et al., 2005; Peers et al., 2005), Alzheimer’s
disease (Bublak et al., 2011; Redel et al., 2012), Huntington’s disease (Finke et al., 2006; Finke et al., 2007), pure alexia (Starrfelt, Habekost & Leff, 2009; Habekost
et al., 2014), and attention deficit/hyperactivity disorder (ADHD) (Finke et al.,
2011; McAvinue et al., 2012).
1.2.3.Integrating Parametric Measurements with Neuroimaging
The cognitive specificity and neuronal description of TVA offers a comprehensive basement to more precisely identify the effect of brain damage on specific attention functions. Yet large portions of the TVA literature does not incorporate brain imaging (e.g. Bogon et al., 2014; Bublak et al., 2011; Redel et al., 2012; Starrfelt, Habekost & Leff, 2009) or use a rather subjective and non-automated evaluation of lesion anatomy (e.g. Duncan et al., 1999; Habekost & Rostrup, 2007, 2006; Peers
1.3 Clinical Examples of Visual Attention Deficits
9 together with appropriate evaluation criteria, and for c) the validation of the principles of TVA and their neuronal interpretation. We will return to these points in the General Discussion section.
Taken together, disturbances of visual attention follow from various kinds of brain damage. Our understanding of these processes is, however, largely constrained by the nonspecific measurement of visual attention based on conventional neuropsychological assessment. In contrast, whole and partial report experiments combined with TVA model-fitting procedures allow to estimate basic attentional functions in “process-pure” and mathematically independent measures. Combined TVA-neuroimaging approaches may offer a promising tool to elucidate the neuronal correlates of attention deficits, an idea which we tested in two clinical examples.
1.3. Clinical Examples of Visual Attention Deficits
Two clinical groups were chosen in which attention deficits exist, but which had never been investigated with TVA-based assessment. Preterm birth as well as PCA represent clinical conditions with diffusely distributed pathology affecting large-scale brain networks relevant for attention. The current section introduces the two study groups by reviewing the related literature on a) attention deficits as well as b) brain changes and c) proposes how they may be linked with each other.
1.3.1.Example 1: Early Developmental Disturbances
Current progress in neonatal intensive care results in sharply increased survival rates of very immature infants. In 2010, estimates of preterm birth rates showed that 14.9 million infants had been born preterm which are 11.1 percent of all livebirths worldwide (Blencowe et al., 2012). Hence, long-term consequences of preterm birth become a major concern with clear socioeconomic relevance (Moster, Lie & Markestad, 2008).
Attention Deficits
General Introduction: Visual Attention, Deficits and the Brain
10
Jongmans, 2008). Numerous investigations on premature infants and pre-schoolers found less efficient performance across all attention domains compared to term controls: they are less efficient to orient their attention to objects or events in their environment, they shift their attention more slowly and have problems to maintain anticipatory attention (van de Weijer-Bergsma, Wijnroks & Jongmans, 2008). More recent large-scale studies replicated those findings in 8-year-old children (Anderson
et al., 2011; Jaekel, Wolke & Bartmann, 2013) and adolescents (Wilson-Ching et al., 2013) born prematurely.
During recent years, data on the neuro-cognitive outcome of preterm birth in young adulthood have become available due to several longitudinal cohort studies and from large-scale Scandinavian national databases (for an extensive review see Saigal, 2014). However, a key limitation for interpreting available findings is that the measures different studies used varies remarkably and are most of the time rather unspecific. Many studies compared global measures, from which can be assumed that they rely, at least partially, on efficient attentional processing. For instance, most reports indicate that preterm born young adults still have lower full-scale IQ scores compared to those born at term. Moreover, rates of educational achievement, employment and independent living seem to be slightly diminished in preterm individuals (major reviews are Doyle & Anderson, 2010; Hack et al.,
1.3 Clinical Examples of Visual Attention Deficits
11
Brain Changes
Preterm neonates are at high risk of brain injury. The major type of brain lesions are focal white matter (WM) injuries, i.e. periventricular leukomalacia. Modern MRI techniques show that even in the absence of focal lesions, preterm birth is often accompanied by diffuse neuronal, axonal and glial damage extending to deep grey matter (thalamus), cortical and cerebellar areas (major reviews are Deng, 2010; Volpe, 2009; Ment, Hirtz & Hüppi, 2009; Salmaso et al., 2014). The unique vulnerability of the premature brain has to be considered in front of the major changes it undergoes during the late second and third trimester of gestation including: differentiation of the foetal subplate zone, alignment and layering of cortical neurons, expansion of axons and dendrites, as well as selective pruning of synapses and glia cells (Miller & Ferriero, 2009). Major neurobiological models of early brain injury propose that initially destructive processes (e.g. loss of oligodendrocytes due to perinatal insults, such as ischemia or inflammation) are followed by secondary maturational disturbances (Deng, 2010; Volpe, 2009). Microstructural damage during the perinatal period, particularly disruptions in a) the formation of structural connectivity between thalamo-cortical and
cortico-cortical regions (Kostović & Judaš, 2010; McQuillen & Ferriero, 2005), and b) the emergence of synchronous brain signaling (Bartos, Vida & Jonas, 2007), has been associated with a large-scale reorganization of the preterm brain’s intrinsic network architecture (Doria et al., 2010).
Intrinsic functional connectivity (iFC) is characterized by temporally and spatially coherent patterns of low-frequent (< 0.1 Hz) fluctuations of the blood oxygenation level-dependent (BOLD) signal measured by fMRI (Biswal et al., 1995). These patterns correspond to known neuroanatomical systems (Smith et al., 2009), and are consistent across individuals (Damoiseaux et al., 2006), different states of consciousness (Horovitz et al., 2008), and even species (Vincent et al., 2007). Thus, intrinsic brain networks (IBN) are thought to represent a principle, functionally relevant organization of the mammalian brain. The emergence of IBN has been placed mainly within the last trimester of gestation (Fransson et al., 2007; Smyser
General Introduction: Visual Attention, Deficits and the Brain
12
preterm infants (< 26 weeks) exhibit less mature and abnormally formed IBN at term age (see also Fuchino et al., 2013). Changes of iFC seem to be only partially caused by WM lesions (Smyser et al., 2013), but even exist without evident structural injury (Smyser et al., 2014). These findings suggest that the functional network architecture of preterm and full-term infants follow diverging developmental trajectories during the perinatal period, because of distinct experiences, physiological and structural development. Differences still persist into childhood (Damaraju et al., 2010), and as recent data from our group shows have not disappeared by adulthood. Instead, we observed wide-spread patterns of decreased and increased iFC in the pre- versus full-term adult brain (Bäuml et al.,
2014; see also White et al., 2014). Rather than a delay in maturation, these results indicate a systematic and long-lasting reorganization of the cerebral functional architecture in association with preterm birth.
Linking Attention Deficits and Brain Changes
Critically, thalamic, visual and dorsal attention IBN – brain systems which are essential for visual attention – are among those networks showing long-term effects of preterm birth. It is likely that observed re-modelling of iFC in attention-related IBN plays a role in the attention deficits experienced by preterm born individuals. There is strong support for the idea that attention operates on low-frequent (< 1 Hz) spontaneous oscillations to control neuronal excitability via cross-frequency coupling (evidences in rabbits Bishop, 1932, monkeys Lakatos et al., 2008 and humans Besle et al., 2011, for a review see Schroeder & Lakatos, 2009). Following this notion, the dynamic organization of the brain in large-scale, yet flexible, networks allows tuning the ongoing fluctuations of neuronal excitability (mediated by slow cortical potentials, He et al., 2008) to the temporal stream of task-relevant events (for reviews on the relevant cellular processes see Vaishnavi et al., 2010). The resting-state BOLD signal clearly represents a focused (frequency-limited) view on these events. Still, it provides a unique window for the non-invasive investigation of task-relevant neuronal processes which are intrinsically realized in the rhythmic, ongoing activity of the human brain (Raichle, 2010, 2011; Zhang & Raichle, 2010).
trial-by-1.3 Clinical Examples of Visual Attention Deficits
13 trial variability in task-evoked signals (Fox et al., 2006) and variability in the related behavior (Fox et al., 2007). Regarding visual attention, iFC have already been linked to individual differences of attentional performances in healthy participants (Sali, Courtney & Yantis, 2016), and to attention deficits in patients with ADHD (Hoekzema et al., 2014; Sripada, Kessler & Angstadt, 2014, for a review see Parks & Madden, 2013). To date no study has examined whether and how altered iFC in attention-related IBN are linked to the adverse development of visual attention in preterm born individuals. Two different hypotheses exist. First, changes in iFC may express an impaired functional organization of the preterm adult brain, whereby stronger iFC alterations lead to more severe attention deficits. Or alternatively, changed iFC may constitute a compensatory mechanism to mitigate harmful consequence of preterm birth, such that stronger iFC alterations lead to less severe attention deficits.
1.3.2.Example 2: Late Neurodegenerative Disturbances
We now move to the last decades of the life span, where the risk of developing dementia increasingly grows. The most common form of dementia arises from
Alzheimer’s disease (AD) and is primarily associated with memory deficits. However, in very rare cases, neuropathology is largely restricted to primary visual and visual association cortices (Hof et al., 1997; Renner et al., 2004; Tang-Wai et al., 2004). This neurodegenerative syndrome is known as posterior cortical atrophy (PCA).
Attention Deficit
According to the atrophy pattern, patients with PCA show a fairly selective deficit of visual attention and other higher visual and visuospatial skills. Salient features
of PCA include Balint’s syndrome (simultanagnosia, optic ataxia and ocular apraxia) and Gerstman’s syndrome (agraphia, acalculia and finger agnosia) (Benson, Davis & Snyder, 1988). Full presentations of Balint’s and/or Gerstman’s
General Introduction: Visual Attention, Deficits and the Brain
14
evidenced by patients’ ability to name single items of a visual scene. Instead, they are no longer able to integrate individual elements to form a meaningful whole (Wolpert, 1924), a condition which is tremendously disturbing for daily life functioning. For example, a very typical disabling impairment are reading difficulties (Beh et al., 2014). Simultanagnosia has been grossly characterized as a deficit of visual attention (e.g. Rizzo & Robin, 1990), though the specific underlying impairment has not been fully elucidated.
Two alternative accounts of simultanagnosia had been proposed. The first approach dates back to a single case report of a patient whose STM memory capacity seemed to be so much decreased that he could only perceive one object at a time. Speed of perceptual processing for a single item, on the other hand, occurred to be normal (Coslett & Saffran, 1991b; see also Pavese et al., 2002). In a large review article, Rizzo and Vecera (2002) proposed that the investigation of STM capacity deficits might be especially fruitful for our understanding of the specific defects causing simultanagnosia. More recent studies were able to more systematically investigate the independent contribution of impaired STM capacity and processing speed to symptom occurrence. By using TVA-based assessment, Duncan et al. (2003) demonstrated that two patients with simultanagnosia following stroke suffered from extremely reduced rates of visual processing speed. The authors argue that in complex scenes where multiple objects compete for processing resources, a severe slowing of processing speed might cause perceptual failure for all but the most salient object. Consistently, Finke and colleagues (2007) revealed a significant correlation between slowed visual processing speed and severity of simultanagnosia in patients with Huntington’s disease. The controversy of whether reduced STM storage capacity or visual processing speed leads to simultanagnosia has not been reconciled yet. This is mainly because the literature is, despite of some more recent group studies (Finke et al., 2007), still dominated by single case reports and non-uniform conceptualization and assessment of visual attention (Rizzo & Vecera, 2002).
Brain Changes
1.3 Clinical Examples of Visual Attention Deficits
15 Only cases with underlying AD will be considered here. Histopathological examinations evidence that PCA is characterized by a focal accumulation of senile plaques and neurofibrillary tangles in parietal, occipital and posterior temporal brain regions, particularly in Brodmann areas 17 and 18 (Hof et al., 1997; Tang-Wai et al., 2004). Investigations of Lehmann and colleagues in relatively large patient groups extensively broadened our understanding of the neuroimaging profile of PCA. The authors used voxel-based morphometry (VBM) to quantify and localize patterns of atrophy based on anatomical MRI scans in an objective and fully-automated manner. Compared to healthy control participants, the researchers found enormous volume loss within the cerebral posterior hemisphere, whereby the occipital and parietal lobe showed the greatest reductions, with superior parietal cortex being on average 20% smaller in patients, followed by areas in the temporal lobe (Lehmann et al., 2011; Lehmann et al., 2012). This atrophy pattern is syndrome-specific as a direct comparison between PCA and patients with the amnestic AD or logopenic AD variant reveals (Lehmann et al., 2011; Lehmann et al., 2012; Lehmann et al., 2013b; Caso et al., 2015, for a review see Alves et al.,
2013). VBM analyses of white matter (WM) volume show extensive atrophy within posterior brain regions in PCA patients relative to healthy controls. Specific volume loss compared to other AD variants, was observed in bilateral dorsal occipito-parietal and ventral occipito-temporal regions along the major visual pathways (Migliaccio et al., 2012a). Results from diffusion tensor imaging (DTI) confirm bilateral microstructural changes in the major association bundles, e.g. inferior fronto-occipital, superior and inferior longitudinal fasciculus, as well as in the splenium and thalamic radiations (Caso et al., 2015; Cerami et al., 2015). Beyond structural grey matter (GM) and WM changes, PCA had been reported to affect many different characteristics of the posterior brain, including large-scale functional connectivity (Lehmann et al., 2013b; Migliaccio et al., 2016), glucose metabolism (Lehmann et al., 2013a; Nestor et al., 2003), and brain perfusion (Kas
et al., 2011).
Linking Attention Deficits to Brain Changes
General Introduction: Visual Attention, Deficits and the Brain
16
underpinnings of simultanagnosia comes from the stroke literature. Chechlaczet al. (2012) compared lesion patters between stroke patients with symptoms of simultanagnosia versus unilateral visuospatial attention deficits (neglect, extinction). Lesion subtraction and VBM analyses revealed that damage to both GM and WM areas is linked to simultanagnosia. In more details, symptoms of simultanagnosia were related to GM lesions within large portions of the occipital (bilateral calcarine, cuneus and parieto-occipital fissure, left middle and superior occipital gyrus) and parietal cortex (right intraparietal sulcus, bilateral postcentral and superior parietal gyri). Regarding WM damage associated with simultanagnosia, the bilateral occipital and parieto-occipital lesions found here indicate a critical role for damage within long association pathways. A further characterization of WM lesions by DTI tractography confirms that especially bilateral microstructural impairments within the main projection fibers of the visuospatial attention system underlie deficits of simultaneous perception. Preliminary evidences from a DTI study of two PCA patients support the idea that disruptions of the superior and inferior longitudinal fasciculus as well as the inferior fronto-occipital fasciculus are necessary for the occurrence of simultanagnosia (Migliaccio et al., 2012b). Following the notion of Duncanet al. (2003), Chechlacz and colleagues proposed that the observed reduction of structural connectivity might have led to a slowing of processing speed and by that caused simultanagnosia. Yet, this speculative neuro-cognitive model of simultanagnosia has never been tested empirically.
In summary, while previous work in both clinical groups points towards substantial disturbances of visual attention, no investigation to date has systemically assessed the effect of preterm birth or posterior cortical atrophy on basic visual attention functions by means of TVA-based assessment. From earlier studies we know that both groups show changes in attention-related brain areas or networks. Yet, the relationship between these neuronal changes and attention deficits is not sufficiently understood.
1.4. Aims of This Thesis
1.4 Aims of This Thesis
17 end, the computational Theory of Visual Attention (TVA) combined with modern structural and functional MRI techniques were applied in a neurodevelopmental (preterm birth) and neurodegenerative (posterior cortical atrophy (PCA)) condition with attention deficits. We aimed to utilize the specificity of model-based assessments of latent, “process-pure” and independent parameters of visual attention in order to establish robust behavior-brain relationships. With regard to preterm birth, attention problems are the most prominent sequelae which may even persist into adulthood. Long-lasting alterations of intrinsic functional connectivity (iFC) in attention-related brain networks seem to be a potentially underlying mechanism. However, previous studies have not yet identified which specific attention process is impaired and how it is linked to changes of iFC in preterm bon adults. The first project of the current thesis assessed the specific long-term effect of preterm birth on basic attentional functions and the nature of the relationship to alterations of intrinsic brain networks. With regard to PCA, perception of simultaneously presented object is often severely impaired (simultanagnosia) due to degenerative processes within the visuospatial attention system. However, controversies exist about which attention deficit underlies simultanagnosia and how it is related to grey matter (GM) and white matter (WM) atrophy. The second project of the current thesis systematically investigated the cognitive and neuroanatomical features of simultanagnosia in a relatively large group of patients with PCA.
To broaden our understanding of the relationship between attention deficits and changes of the large-scale structural and functional architecture of the human brain, the current thesis focuses on the following research questions:
Project 1
a) Besides the observed attention deficits in childhood, does preterm birth have specific long-lasting effects on the attention system’s general capacity
General Introduction: Visual Attention, Deficits and the Brain
18
b) Are impaired attention parameters linked to changes of iFC in the thalamic, visual and dorsal attention network, and does the nature of this relationship reflect a detrimental or compensatory mechanism? For each preterm adult, we correlated attentional performance scores with the strength of iFC within clusters showing a significantly altered functional organization between pre- versus full-term born participants.
Project 2
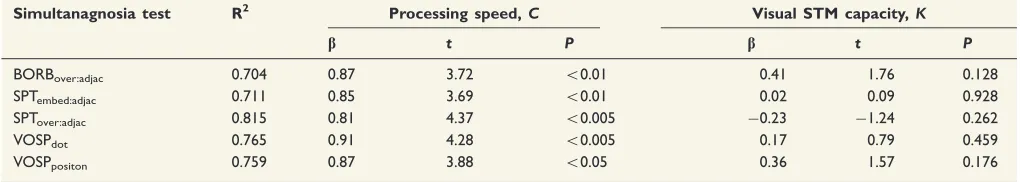
a) Do deficits of STM capacity or visual processing speed contribute to the occurrence of simultanagnosia? To answer this question, we compared independent estimates of STM capacity and visual processing speed between patients with PCA and healthy control participants and tested, in a regression analysis, which one of both attentional parameters significantly predicts patients’ simultanagnosia symptoms.
19
2.
Project 1: Visual Attention in Preterm
Born Adults: Specifically Impaired
Attentional Sub-mechanisms that Link
with Altered Intrinsic Brain Networks
in a Compensation-like Mode
The current chapter includes a research article entitled “Visual attention in preterm born adults: Specifically impaired attentional sub-mechanisms that link with altered intrinsic brain networks in a compensation-like mode”. This article showed for the first time that short-term memory storage capacity is selectively impaired in preterm born adults, and cortical changes in intrinsic functional connectivity seem to compensate for these adverse consequences of prematurity on visual attention development. The manuscript was published in NeuroImage in 2015.
Contributions:
Authors: Kathrin Finke, Julia Neitzel, Josef G. Bäuml, Petra Redel, Hermann J. Müller, Chun Meng, Julia Jaekel, Marcel Daamen, Lukas Scheef, Barbara Busch, Nicole Baumann, Henning Boecker, Peter Bartmann, Thomas Habekost, Dieter Wolke, Afra Wohlschläger, Christian Sorg
Visual attention in preterm born adults: Speci
fi
cally impaired attentional
sub-mechanisms that link with altered intrinsic brain networks in a
compensation-like mode
Kathrin Finkea,b,1, Julia Neitzela,c,f,1, Josef G. Bäumlc,d, Petra Redela, Hermann J. Müllera, Chun Mengc,d,f,
Julia Jaekelg,j, Marcel Daamenh, Lukas Scheefh, Barbara Buschi, Nicole Baumannj, Henning Boeckerh,
Peter Bartmanni, Thomas Habekostb, Dieter Wolkej,k, Afra Wohlschlägerc,d, Christian Sorgc,d,e,⁎ aDepartment of Psychology, General and Experimental Psychology, Ludwig-Maximilians-Universität München, Leopoldstr. 13, 80802 Munich, Germany
bDepartment of Psychology, University of Copenhagen, Øster Farimagsgade 2A, 1353 Copenhagen K, Denmark
cTUM-Neuroimaging Center of Klinikum rechts der Isar, Technische Universität München TUM, Ismaninger Strasse 22, 81675 Munich, Germany dDepartment of Neuroradiology, Klinikum rechts der Isar, Technische Universität München TUM, Ismaninger Strasse 22, 81675 Munich, Germany eDepartment of Psychiatry, Klinikum rechts der Isar, Technische Universität München TUM, Ismaninger Strasse 22, 81675 Munich, Germany fGraduate School of Systemic Neurosciences GSN, Ludwig-Maximilians-Universität, Biocenter, Großhaderner Strasse 2, 82152 Munich, Germany gDepartment of Developmental Psychology, Ruhr-University Bochum, Bochum, Germany
hFunctional Neuroimaging Group, Department of Radiology, University Hospital Bonn, Germany iDepartment of Neonatology, University Hospital Bonn, Germany
jDepartment of Psychology, University of Warwick, Coventry, United Kingdom kWarwick Medical School, University of Warwick, Coventry, United Kingdom
a b s t r a c t a r t i c l e i n f o
Article history:
Accepted 29 November 2014 Available online 9 December 2014
Keywords: Preterm birth Preterm born adults Selective attention Theory of Visual Attention Intrinsic brain networks Compensation
Although pronounced and lasting deficits in selective attention have been observed for preterm born individuals it is unknown which specific attentional sub-mechanisms are affected and how they relate to brain networks. We used the computationally specified‘Theory of Visual Attention’together with whole- and partial-report paradigms to compare attentional sub-mechanisms of pre- (n = 33) and full-term (n = 32) born adults. Resting-state fMRI was used to evaluate both between-group differences and inter-individual variance in changed functional connectivity of intrinsic brain networks relevant for visual attention.
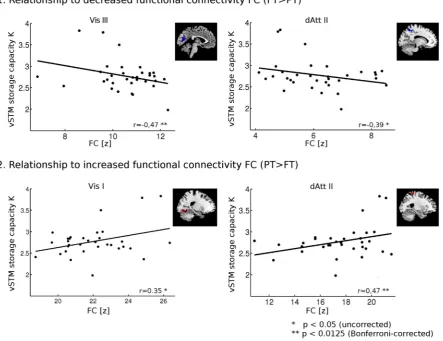
In preterm born adults, we found specific impairments of visual short-term memory (vSTM) storage capacity while other sub-mechanisms such as processing speed or attentional weighting were unchanged. Furthermore, changed functional connectivity was found in unimodal visual and supramodal attention-related intrinsic networks. Among preterm born adults, the individual pattern of changed connectivity in occipital and parietal cortices was systematically associated with vSTM in such a way that the more distinct the connectivity differences, the better the preterm adults' storage capacity.
Thesefindings providefirst evidence for selectively changed attentional sub-mechanisms in preterm born adults and their relation to altered intrinsic brain networks. In particular, data suggest that cortical changes in intrinsic functional connectivity may compensate adverse developmental consequences of prematurity on visual short-term storage capacity.
© 2014 Elsevier Inc. All rights reserved.
Introduction
Preterm birth (b37 weeks of gestation) is a substantial risk factor for suboptimal neurocognitive development with disadvantages persisting into adulthood (Baron and Rey-Casserly, 2010; D'Onofrio et al., 2013;
Wolke and Meyer, 1999). Due to improvements in medicine and demographic changes preterm birth and survival rates are increasing with a global prevalence of about 10% (Blencowe et al., 2012). In order to identify specific neurocognitive targets for potential intervention, it is important to scrutinize the long-term cognitive and neuronal changes following preterm birth.
Specific functional weakness in preterm born individuals, which persists into early adulthood and is not explained by global cognitive deficit, has been observed for visual attention (Anderson and Doyle, 2003; Atkinson and Braddick, 2007, 2012; Mulder et al., 2009; Shum
NeuroImage 107 (2015) 95–106
⁎ Corresponding author at: Department of Psychiatry and Neuroradiology, Klinikum rechts der Isar, Ismaninger Strasse 22, 81675 Munich, Germany. Fax: +49 89 4140-7665.
E-mail address:[email protected](C. Sorg).
1Equalfirst author contribution.
http://dx.doi.org/10.1016/j.neuroimage.2014.11.062
1053-8119/© 2014 Elsevier Inc. All rights reserved.
Contents lists available atScienceDirect
NeuroImage
et al., 2008; Strang-Karlsson et al., 2010; van de Weijer-Bergsma et al., 2008). Attention deficits and their long-term stability are documented,
for example, by changed eye movement at infancy (Atkinson and Braddick, 2012; van de Weijer-Bergsma et al., 2008), by deficits in
neuropsychological tests at school age (Anderson and Doyle, 2003; Atkinson and Braddick, 2007; Johnson, 2007; Luciana et al., 1999; Shum et al., 2008; Taylor et al., 2004), and by slower reaction times in perceptive–attentional tests in early adulthood (Strang-Karlsson et al., 2010). However, the specific cognitive mechanisms underlying such
observable behavior are unknown.
The major forms of brain injury after preterm birth are subcortical white and gray matter lesions together with impaired structural connectivity (Ball et al., 2012; Eikenes et al., 2011; Ment et al., 2009; Nosarti et al., 2008; Padilla et al., 2014; Pierson et al., 2007; Srinivasan et al., 2007; Salmaso et al., 2014; Volpe, 1998, 2009). These initially rath-er localized lesions are assumed to lead to widespread and functionally relevant long-term consequences (Hack and Taylor, 2000; Volpe, 2009), particularly in intrinsic brain networks (Bäuml et al., 2014; White et al., 2014). Such networks organize brain activity (Fox and Raichle, 2007) and are relevant for specific cognitive functions (Laird et al., 2011;
Smith et al., 2009).
In the current study, we wanted to specify sub-mechanisms of visual attention affected in adults born preterm on the basis of the“Theory of Visual Attention” (TVA) framework. Furthermore, we aimed to integrate potential cognitive changes in visual attention with changes in intrinsic functional connectivity (iFC) of intrinsic brain networks in preterm born adults.
TVA, attentional sub-mechanisms, and its neural correlates
TVA is a mathematically formulated model of selective attention (Bundesen, 1990; Bundesen et al., 2005). In TVA, visual processing is conceived of as a parallel-competitive race. Visual objects in a given display are supposed to compete for selection, i.e., conscious represen-tation, into the capacity-limited visual short-term memory (vSTM) store. Bottom-up and top-down generated bias signals determine ‘attentional weights’for objects. Depending on their relative weights, some objects are thus favored for selection. The probability of selection is determined by an object's processing ratev, which depends on the attentional weight (w) that it receives, on sensory effectiveness, and the capacity of the vSTM store (if the store isfilled, the selection process
terminates). In TVA, the processing speed,C, for a display is defined as
the sum of allvvalues in the display and, thus, characterizes the visual information processing rate of a given participant. Methods that have been previously used to disentangle impaired and preserved parame-ters of visual attention and short-term memory in neurodevelopmental disorders such as dyslexia, ADHD and spina bifida myelomeningocele
(Bogon et al., 2014; Caspersen and Habekost, 2013; Finke et al., 2011; McAvinue et al., 2012; Stenneken et al., 2011) are simple psychophysi-cal tests of whole and partial report of briefly presented letter arrays.
Integrated within the TVA framework these tests permit different parameters of visual attention in a given participant to be extracted and quantified independently, and in measurements that are not
con-founded by, for example, cognitive or motor slowing. Such cognitive specificity is the optimal basis for relating quantified basic parameters
of visual attention performance to underlying neural networks in healthy and patient populations (Gillebert et al., 2012; Peers et al., 2005; Sorg et al., 2012; Wiegand et al., 2013). We used the TVA based approach in order to collect estimates of visual perceptual processing speed (parameterC), vSTM storage capacity (parameterK), top-down control (parameterα), and spatial laterality of attention (parameter
wλ).
With respect to normally developed brains, the neural interpretation of TVA (NTVA) (Bundesen et al., 2005) specifies that posterior
visual perceptual areas are governed by bias signals generated in frontoparietal areas and by a salience map putatively located in the
pulvinar (Corbetta and Shulman, 2002; Kanwisher and Wojciulik, 2000; Kastner and Ungerleider, 2000). Visual perception is assumed to rely on a parallel race of visual objects that compete for access to the limited vSTM store (Bundesen, 1990). Thalamo-cortical feedback loops are suggested to (re)-activate the same visual neurons in posterior parts of the cortex coding and maintaining the winner objects (Gillebert et al., 2012; Magen et al., 2009; Todd and Marois, 2004; Xu and Chun, 2006). Due to their reliance on widespread interconnected brain areas the TVA parameters, and particularly vSTM storage capacity, are vulnerable to interruptions or connectivity changes within large-scale brain networks (Habekost and Rostrup, 2007). Based on these areas relevant for TVA-related mechanisms, we focused our analysis on intrinsic brain networks of the posterior brain that might be a brain base for impaired attentional sub-mechanisms in preterm born adults.
Intrinsic brain networks after preterm birth and its potential link with altered attention
Large-scale intrinsic functional connectivity is organized in intrinsic brain networks, which are defined by synchronous ongoing activity
(i.e. iFC) in the frequency range of 0.01–0.1 Hz (Fox and Raichle, 2007). Intrinsic networks are consistent across individuals (Damoiseaux et al., 2006), development (Fransson et al., 2007), different behavioral states (Horovitz et al., 2008), and even species (Vincent et al., 2007), and possibly represent a basic organization principle of the mammalian brain. They are functional networks i.e. their areas commonly co-activate during both non-task and task states, suggesting intrinsic networks to implement specific aspects of cognition and behavior
(Laird et al., 2011; Smith et al., 2009). One possible explanation for this functional specificity is that functional connectivity at rest reflects
the history of correlated activity changes during goal-directed behavior (Berkes et al., 2011; Lewis et al., 2009; Riedl et al., 2011). By the use of resting-state functional resonance imaging (rs-fMRI), precursors of intrinsic brain networks are already detectable in newborns (Fransson et al., 2009) and even preterm born infants (Doria et al., 2010), with the latter showing subtle alterations in network connectivity (Damaraju et al., 2010; Smyser et al., 2010). Recently, changed intrinsic networks have been demonstrated for preterm born adults (Bäuml et al., 2014; White et al., 2014; Wilke et al., 2013), indicating distinct developmental trajectories for intrinsic networks after preterm delivery.
Given the functional–cognitive relevance of intrinsic networks, it seems reasonable to expect that impaired mechanisms of visual attention might be related to changes of intrinsic networks, which cover posterior areas of the brain relevant for visual attention, i.e. tha-lamic, visual, and dorsal attention networks. In principle, two types of relationship are possible: (i) the more attention is impaired the more intrinsic connectivity is changed from that of healthy controls, reflecting
detrimental effects of preterm birth; (ii) the less attention is impaired the more intrinsic connectivity is changed from that of healthy controls, reflecting compensatory response on effects of preterm birth. Beyond
the pattern of altered attentional sub-mechanisms in preterm born adults, the present study investigates the nature of the relationship between altered visual attentional mechanisms and intrinsic networks of the posterior brain.
Materials and methods
Participants
Participants were recruited as part of the prospective Bavarian Longitudinal Study (BLS) (Riegel et al., 1995; Wolke and Meyer, 1999), a geographically defined whole-population sample of preterm
born children and full-term controls. Of the initial sample, 33 preterm adults and 32 healthy term controls (all aged 25 to 27 years)
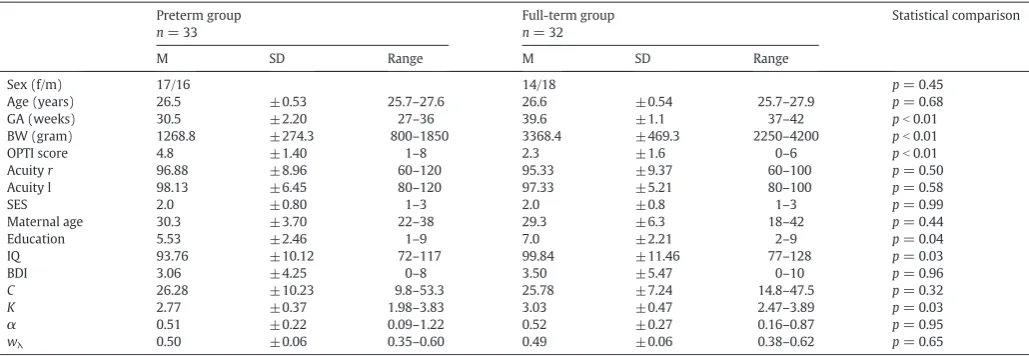
participated in TVA-based attention assessment and magnetic reso-nance imaging including rsfMRI. Relevant biographical and clinical data are listed inTable 1. Groups were matched in terms of sex, age, vi-sual acuity, socioeconomic background, maternal age, and depressive symptom scores. Education level and IQ were significantly lower in
the preterm group. The local ethics committee of the Klinikum rechts der Isar approved the study. All study participants gave written in-formed consent and received travel expenses and payment for atten-dance. Before participants were asked to attend examinations, each subject was carefully screened for MR-related contraindications (e.g. pregnancy, pacemaker implants). The additional exclusion criteria for participating in the study were non-correctable reduction of sight in ei-ther eye and the presence of psychiatric disorders that are known to af-fect attention such as ADHD, autism, schizophrenia, or major depression. All participants had normal or corrected-to normal vision and were not color-blind. Participants were examined at the Depart-ment of Neuroradiology, Klinikum rechts der Isar, Technische Universität München, Germany.
Measures of prematurity, demography, and cognitive performance Gestational age was estimated from maternal reports of the last menstrual period and serial ultrasounds during pregnancy at birth. When the two measures differed by more than two weeks, a clinical assessment with the Dubowitz method was applied (Dubowitz et al., 1970). Maternal age and birth weight were obtained from obstetric records. Perinatal medical complications were assessed with a stan-dardized optimality scoring system (OPTI) including 15 items (e.g. am-nion infectious syndrome; pathologic CTG) (Prechtl, 1967). Items were coded as 1 (non-optimal) or 0 (optimal) and summed into an index score with the higher value indicating more complications. The family socio-economic background was collected through structured parental interviews within 10 days of the child's birth. It was computed as a weighted composite score based on the profession of the self-identified head of family together with the highest educational qualifi
-cation held by either parent (Bauer, 1988). Prior to attention and MRI examination, subjects were asked to take part in an assessment of global cognitive functioning at the age of 26 years by trained psychologists. This included a short version of the German Wechsler Adult Intelligence Scale-III (WAIS-III;Von Aster et al., 2006) allowing computation of Full Scale IQ.
Behavioral assessment of TVA parameters of attention
Computational TVA framework
Briefly, in TVA-based measurement of individual attentional
functions of a given participant, two parameters determine general capacity aspects: Visual perceptual processing speedCis the number of visual elements that can be processed by a given participant per second; vSTM storage capacityKquantifies the number of items that
can be categorized and selected in parallel and transferred into a vSTM store (Cowan, 2001; Habekost and Starrfelt, 2009; Luck and Vogel, 1997; Sperling, 1960). Two other parameters describe specific
attentional weighting processes. One is the efficiency of top-down
con-trolαand the other the laterality of the spatial distribution of attention wλ. These weighting parameters determine how a person distributes the amount of attentional resources available when presented with multiple, alternative inputs, that is: when selective attention needs to be allocated. All TVA parameters are derived from two experimental tests, namely, whole and partial report tasks with high similarity in terms of stimulus material and response requirements, and thus of perceptual and motor skill requirements. For formal TVA descriptions and equations, maximum likelihood modelfitting and software, see Kyllingsbæk (2006).
General assessment procedure
Participants underwent TVA-based assessment and fMRI scanning on the same day. Stimuli were presented on a 17-inch monitor (1024 by 1280-pixel resolution, 60-Hz refresh rate), in a dimly lit room. A chin rest was used to keep viewing distance at 50 cm. Each participant completed the whole- and partial-report, each lasting ~0.5 h, within one testing session. Task order was balanced across participants. In both experiments,first, the participants were instructed tofixate on
a central white cross (0.3° visual angle) presented for 300 ms. Then, after a gap of 100 ms, red and/or green letters (0.5° high×0.4° wide) were briefly presented on a black background. Individual exposure
durations were determined in a practice session to meet a criterion value. The letters were randomly chosen from a pre-specified set
(“ABEFHJKLMNPRSTWXYZ”), with the same letter appearing only once on a given trial. Each participant received the same displays in the same sequence. Stimuli were either masked or unmasked. In unmasked conditions, the effective exposure durations were prolonged
Table 1
Sample characteristics.
Preterm group n= 33
Full-term group n= 32
Statistical comparison
M SD Range M SD Range
Sex (f/m) 17/16 14/18 p= 0.45
Age (years) 26.5 ±0.53 25.7–27.6 26.6 ±0.54 25.7–27.9 p= 0.68
GA (weeks) 30.5 ±2.20 27–36 39.6 ±1.1 37–42 pb0.01
BW (gram) 1268.8 ±274.3 800–1850 3368.4 ±469.3 2250–4200 pb0.01
OPTI score 4.8 ±1.40 1–8 2.3 ±1.6 0–6 pb0.01
Acuityr 96.88 ±8.96 60–120 95.33 ±9.37 60–100 p= 0.50
Acuity l 98.13 ±6.45 80–120 97.33 ±5.21 80–100 p= 0.58
SES 2.0 ±0.80 1–3 2.0 ±0.8 1–3 p= 0.99
Maternal age 30.3 ±3.70 22–38 29.3 ±6.3 18–42 p= 0.44
Education 5.53 ±2.46 1–9 7.0 ±2.21 2–9 p= 0.04
IQ 93.76 ±10.12 72–117 99.84 ±11.46 77–128 p= 0.03
BDI 3.06 ±4.25 0–8 3.50 ±5.47 0–10 p= 0.96
C 26.28 ±10.23 9.8–53.3 25.78 ±7.24 14.8–47.5 p= 0.32
K 2.77 ±0.37 1.98–3.83 3.03 ±0.47 2.47–3.89 p= 0.03
α 0.51 ±0.22 0.09–1.22 0.52 ±0.27 0.16–0.87 p= 0.95
wλ 0.50 ±0.06 0.35–0.60 0.49 ±0.06 0.38–0.62 p= 0.65
Abbreviations: m: male, f: female; GA: gestation age; BW: birth weight; OPTI: optimality score of perinatal conditions; Acuity l: visual acuity of left eye at 6 years of age, Acuityr: visual acuity of right eye at 6 years of age; SES: socioeconomic status at birth; maternal age: maternal age at birth; education: school performance at 13 years of age; IQ: Wechsler Intelligence Test for Adults at 26 years of age; BDI: Beck Depression Inventory at 26 years of age,C: processing speed,K: visual short-term memory storage capacity,α: top-down control of attention,wλ: spatial distribution of attention. Statistical comparisons: sex: chi-squared statistics; age, GA, BW, IQ: t-tests; OPTI, acuityrandr, SES, education, BDI: nonparametric Mann– Whitney-U-tests,C,K,α,wλ: ANCOVAs with IQ as a covariate.
by several hundred milliseconds due to‘iconic’memory buffering. The verbal report of individual letters was performed in arbitrary order and without stress on response speed. The experimenter entered the responses on the keyboard. The total number of trials was 288 in the partial- and 192 in the whole-report experiment, separated into blocks of 48 trials each. Within each block, the different trial types were presented equally often in randomized order.
Whole report
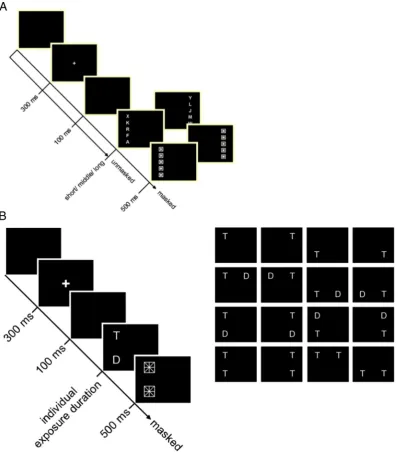
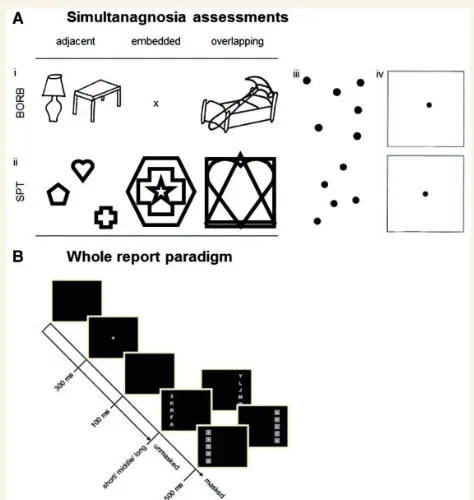
In the whole-report task participants were briefly presented with
multiple stimuli and had to identify as many of them as possible (see Fig. 1A). On each trial, a column offive equidistant red or green letters
was presented 2.5° of visual angle to the left or the right of thefixation.
All letters were either red or green. The participants' task was to identify and report as many letters as possible.
In a pretest (24 trials), the individual exposure duration was determined at which the participant could report, on average, one letter correctly. In the whole report, this value was then used as the
‘intermediate’, together with a shorter (half as long) and a longer (twice as long) exposure duration. The preterm group's average expo-sure durations were 45.64 (SD = 7.83), 88.79 (SD = 19.57), and 174.48 (SD = 39.08) ms, and did not differ significantly from those of
the full-term group, that were 45.17 (SD = 7.0), 82.23 (SD = 17.26), and 164.90 (SD = 33.40). Letter displays were presented either masked or unmasked. This resulted in six‘effective’exposure durations because, in unmasked displays, storage of visual information in iconic memory leads to prolonged information processing. Twelve different conditions were obtained (2 hemifields, 3 exposure durations, 2 masking
condi-tions), each with 16 trials. Performance (i.e. the number of letters reported correctly) was measured as a function of exposure duration.
Based on accuracy in the different effective exposure duration conditions, parameters reflecting processing efficiency were modeled.
In TVA the processing race depends on the dynamics of the processing system. This is expressed in an exponentially increasing probability for an object to be selected with increasing exposure duration. By the use of six effective exposure durations we aimed to measure a broad
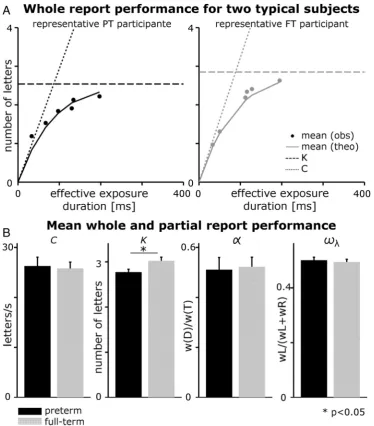
range of performance spectrum that reflects the early as well as the late section of the participant's whole report functions, thereby allowing a reliable modelfit of the data. The probability of identification was modeled by an exponential growth function in which the growth pa-rameter reflects the rate at which objects can be processed (processing speedC: number of element/s) and the asymptote indicates the maxi-mum number of objects that can be represented within vSTM (vSTM storage capacityK) (for illustration seeFig. 2A, left panel). Note that two additional parameters, minimum effective exposure duration (t0) and effective additional exposure duration in unmasked displays (mμ) were also determined (and did not differ significantly between groups). Here, they mainly served the valid estimation of parametersCandK.2
Partial report
In the partial-report task participants had to report pre-specified (i.e., with respect to color) targets only, while ignoring distractors. In each trial either a single target (letter) or a target plus distractor (letter) or two targets appeared at the corners of an imaginary square with an edge length of 5° centered on the midpoint of the screen (seeFig. 1B). Two stimuli were presented either horizontally or vertically. Sixteen conditions (4 single target, 8 target + distracter, 4 dual target condi-tions) resulted. All stimuli were masked. Participants were asked to identify and report all red targets and ignore the green distracters. In a pretest (32 trials), the individual exposure duration was determined at which the participant could report single targets with 80% accuracy. In the partial report, 6 blocks, each with 48 trials, were presented. The average exposure duration determined for the preterm group was 90.21 ms (SD = 24.69); that of the full-term group was 91.5 ms (SD = 23.42).
From the probabilities of target identification, separate attentional weights were derived for left and right hemifields (wLandwR, respec-tively) and for targets (wT) and distractors (wD). The distribution of attentional weights across hemifields and that across target and
Fig. 2.(A) Representative whole report results for two subjects. Whole-report performance for a representative preterm group participant and a representative full-term group participant. Mean number of correctly reported letters as a function of effective exposure duration. Solid curves represent the bestfits from the TVA to the observations. The estimate of visual short-term storage capacityKand processing speedCis marked by dashed lines. (B) Whole and partial report results. Average estimates and standard errors for parameterK,C,α(i.e. efficiency of top-down control), andwλ(i.e. spatial laterality of attention). Analyses of covariance were used for group comparisons (pb0.05).
2For whole reportfitting, we set up a model for variable exposure durations andfixed
display size. We thresholded the maximum score to the individual highest score of the participants and, when a small number of high scores occurred (inb5% of trials), the threshold was set 1 item below the maximum. TheKrange was limited to values between this maximum score and 1 item below. Its initial score was set at the average of these two values. By setting limits to v-values (information uptake at each stimulus location), the range ofC-estimates was 0–100. The minimum of parameterst0 andmμwere set to 0 and the initial values at 10 ms and 100 ms, respectively.
99