AU TOM ATED M EASU REM ENT OF C O M PL E X EN G IN EERING
SURFACES USING MULTI STATION PH O T O G R A M M E T R Y
4
A thesis submitted for the title o f Doctor o f Philosophy
ProQuest Number: U642886
All rights reserved
INFORMATION TO ALL USERS
The quality of this reproduction is dependent upon the quality of the copy submitted.
In the unlikely event that the author did not send a complete manuscript and there are missing pages, these will be noted. Also, if material had to be removed,
a note will indicate the deletion.
uest.
ProQuest U642886
Published by ProQuest LLC(2016). Copyright of the Dissertation is held by the Author.
All rights reserved.
This work is protected against unauthorized copying under Title 17, United States Code. Microform Edition © ProQuest LLC.
ProQuest LLC
789 East Eisenhower Parkway P.O. Box 1346
Contents
1
List of figures--- 6
List of equations--- 10
List of tables--- 11
ACKNOWLEDGEMENTS--- 13
ABSTRACT--- 14
ABSTRACT (In Greek)--- 15
1 INTRODUCTION _________________________________________ 16 1.1 Research background--- 16
1.2 Research alms--- 17
1.3 Structure of thesis--- 19
MEASUREMENT METHODS IN METROLOGY__________________________ 21 2.1 Background--- 22
2.1.1 Requirements--- 24
2.1.2 Applications--- 25
2.1.3 Typical problems---2.2 Close range measurement systems--- 28
2.2.1 Laser scanners--- 29
2.2.1.1 Methods of distance measurement______ 30 2.2.1.2 Synchronised laser scanner system description --- 32
2.2.1.3 Key advantages and disadvantages 34 2.2.2 Projection systems_____________________________ 35 2.2.2.1 Measurement method for structured light 37
2.2.S.2 Key advantages and disadvantages 45
2.2.4 Photogrammetry and machine vision systems--- 45
2.2.4.1 Fundamentals of photogrammetry and
machine v is io n --- 46
2.2.4.2 Digital close range photogrammetry 50
2.2.4.S Applications of close range
photogrammetry--- 52
2.2.4.4 Machine vision--- 54
2.2.4.5 Applications of machine vision--- 57
2.2.5 Comparison of digital photogrammetry and machine
v is io n --- 59
2.3 Sum m ary--- 60
IMAGE MEASUREMENTS _________________________________ 62
3.1 2D Image measurements--- 63
3.1.1 Retro-reflective targets--- 64
3.1.1.1 Target measurement__________________ 65
3.1.2 Natural feature detection--- 68
3.1.2.1 Interest operators_____________________ 69
3.1.2.2 Edge detection--- 71
3.2 2D to 3D - Least squares texture matching_________________ 76
3.2.1 Texture matching principles______________________ 77
3.2.2 Texture matching parameters____________________ 79
3.2.3 Texture matching quality________________________ 80
3.3 Evaluation of image measurement algorithms and texture
matching--- 81
3.4 Texture anaiysis--- 82
3.4.1 Discrete Fourier transform--- 83
3.5 Summary_________________________________ 85
4.1.1 Digital image characteristics--- 89
4.1.2 Camera calibration--- 91
4.1.2.1 Methods for camera calibration--- 94
4.1.3 Image quality--- 97
4.2 Least squares bundle adjustm ent--- 98
4.2.1 Self calibrating bundle adjustment--- 101
4.3 Image networks--- 103
4.3.1 Convergent image network design--- 103
4.3.2 Epipolar geometry for image networks--- 105
4.4 Surface representation in 2D and 3D space--- 107
4.4.1 Delaunay triangulation--- 108
4.5 Summary--- 110
METHODOLOGY_________________________________________ 111 5.1 Method Overview--- 112
5.2 Method description--- 115
5.2.1 Network Set-up--- 116
5.2.1 Applying the interest operator--- 117
5.2.2 Topological patch matching______________________ 119 5.2.2.1 Matching--- 119
5.2.2.2 First stage--- 121
5.2.2.3 Second stage--- 123
5.2.3 3D point cloud and triangle densification--- 124
5.2.4 Boundaries--- 125
5.3 Quality control--- 128
5.3.1 A-priori weights for natural feature measurements 128 5.3.2 Image-matching quality evaluation--- 130
5.4 Summary--- 130
6 EXPERIMENTS AND ANALYSIS OF RESULTS_____________ 131 6.1 Data sets--- 131
6.3 Influences of image geometry--- 134
6.3.1 Affine parameters from bounding triangle--- 135
6.3.1.1 Significance of curvature--- 139
6.3.2 Epipolar line constraints--- 141
6.3.2.1 Epipolar length--- 141
6.3.2.2 Epipolar line intersection--- 143
6.3.3 Edge segments--- 145
6.3.3.1 Line segments as triangle constraints 145 6.3.3.2 Boundary definition between multiple objects--- 147
6.4 Influences of Image quality--- 148
6.4.1 Fourier-based image texture detection--- 149
6.4.1.1 Texture matching response--- 151
6.4.1.2 Texture matching correlation coefficient— 154 6.4.2 Image magnification--- 156
6.4.3 Dynamic range--- 161
6.5 Quality anaiysis--- 164
6.5.1 Precision and reliability--- 165
6.5.1.1 DCS460 network--- 165
6.5.1.2 E S I.0 network--- 167
6.5.2 Verification of accuracy using CMM data--- 168
6.5.2.1 Common datum definition--- 170
6.5.2.2 Surface 1 imaged with the E S I.0--- 172
6.5.2.3 Surface 1 imaged with the DCS460--- 176
6.5.2.4 Surfaces 2 & 3 --- 177
6.5.3 Summary of results--- 184
6.6 Summary--- 188
CONCLUSIONS AND FUTURE WORK____________________ 189 7.1 Key features of the method--- 190
7.2 Accuracy and precision--- 193
REFERENCES - BIBLIOGRAPHY--- 199
APPENDIX A--- 216
A l Weighted centroid--- 216
A2 Foerstners math--- 217
APPENDIX B--- 218
81 ESI .0 Camera calibration--- 218
82 DCS460 Camera calibration--- 223
APPENDIX 0--- 225
List of Figures
Figure 2.1: Diagram of close range measurement m ethods--- 23
Figure 2.2: Reconstruction of a cathedral in Antwerp using machine vision techniques 25 Figure 2.3: Archeological (a, b) and architectural (c, d) reconstruction--- 26
Figure 2.4: Industrial metrology measurements of plane wing and automobile parts 26 Figure 2.5: Body part modelling--- 27
Figure 2.6: Principal of optical triangulation--- 31
Figure 2.7: Pulse laser principle--- 32
Figure 2.8: Synchronized laser scanner--- 33
Figure 2.9: Triangulation geometry for the synchronised laser scanner--- 34
Figure 2.10: Creating and decoding the gray level values to produce object coordinates — 38 Figure 2.11: Object scanned with coded light--- 39
Figure 2.12: Coordinate measuring systems--- 41
Figure 2.13: Different probe systems--- 42
Figure 2.14: CMM machine and object datum definition--- 43
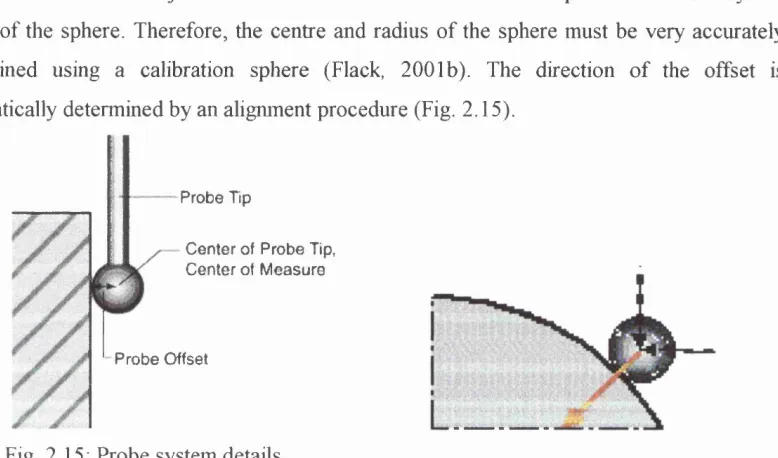
Figure 2.15: Probe system details--- 44
Figure 2.16: Central perspective projection--- 46
Figure 2.17: Collinearity principle--- 47
Figure 2.18: Photogrammetric resection (a) and intersection (b )--- 48
Figure 2.19: Epipolar plane and epipolar lin e --- 49
Figure 2.20: Imaging configurations --- 51
Figure 2.21: Plant modelling using HAZMAP--- 52
Figure 2.22: Automobile inspection system _______________________________________ 53 Figure 2.23: System for industrial metrology--- 54
Figure 2.24: Coplanarity of vectors m l, m 2 and m ________________________________ 55 Figure 2.25: Object modelling--- 58
Figure 3.1: Retro-reflective targets--- 64
Figure 3.2: Coded and circular retro-reflective targets--- 65
Figure 3.4: Retro reflective target exposures (regular, over and under exposed) and
corresponding intensity diagrams--- 67
Figure 3.5: Histograms and corresponding images of areas with wide range of gray level content where the interest operator was successful (a, b) and areas of low gray level content where it failed (c).--- 70
Figure 3.6: Edges detected on cylindrical objects--- 71
Figure 3.7: Typical edge p ro files--- 72
Figure 3.8: Edge detection using Sobel (left image) and Prewitt (right image) filters 73 Figure 3.9: Canny detection at two different thresholds (a = 1.0 & a = 2.8)--- 74
Figure 3.10: Edge detection using Canny (left image) and recursive Gaussian (right image) filters--- 74
Figure 3.11: Seed and target patch - affine transformation of target p a tc h --- 78
Figure 3.12: Image patches and the corresponding Fourier image of the real part--- 85
Figure 4.1: (a) Kodak DCS 410 & 460 & (b) Kodak ES 1.0--- 88
Figure 4.2: Image formation by a le n s --- 92
Figure 4.3: Geometry of the image plane and interior orientation--- 92
Figure 4.4: (a) 3D and (b) 2D retro-reflective target test fields--- 95
Figure 4.5: Test field for stereo calibration--- 96
Figure 4.6: Images containing both retro reflective target and texture information--- 98
Figure 4.7: Convergent image network design--- 104
Figure 4.8: Epipolar geometry and epipolar ray constraint 2 for convergent image netw ork--- 106
Figure 4.9: 3D Point cloud and 3D Delaunay triangulation m e sh --- 109
Figure 5.1 : Overview of proposed methodology--- 111
Figure 5.2: Point detection results using Foerstners interest operator--- 113
Figure 5.3: Diagram of densification process--- 114
Figure 5.4: Camera locations for image network capture --- 116
Figure 5.5: Retro reflective target distribution and resulting Delaunay triangulation 117 Figure 5.6: Interest operator in seed image within initial triangulation mesh--- 118
Figure 5.7: Interest operator density within triangulation mesh--- 118
Figure 5.10: Bounding triangle constraints in epipolar search--- 122
Figure 5.II: Epipolar length constraint criteria--- 122
Figure 5.12: Patch matching at intersection point using original point as reference
template--- 123
Figure 5.13: Intersection options dialog--- 124
Figure 5.14: Dense point cloud and resulting triangulation in 2D and 3D--- 125
Figure 5.15: VRML model of densified point cloud demonstrating areas where linear
segments could be used for better surface representation--- 126
Figure 5.16: Edge linking parameters dialog--- 126
Figure 5.17: Matched edge segments in images and triangulation mesh in 3D and VRML 127
Figure 5.18: Correlation coefficient (r < 0.7 = blue) and error ellipse plots for matched
points--- 129
Figure 5.19: Mean standard deviations for 3D point cloud in 3D viewer--- 129
Figure 6.1: A typical image for the pipe room dataset imaged with the DC460 camera— 133
Figure 6.2: Triangulation mesh from densified point cloud for pipe room d a ta se t 134
Figure 6.3: Point cloud for triangle densified using external affine transformation
parameters including an image at 90° r o ll--- 136
Figure 6.4: Point cloud for densified triangle using external affine transformation
parameters. --- 137
Figure 6.5: Edge detection used to separate initial triangle — 977 points matched within
the new triangulation compared to 388 using the initial triangle--- 137
Figure 6.6: Point cloud for triangle densified using external affine transformation
param eters--- 138
Figure 6.7: Surfaces 1 and 2 used for curvature analysis--- 140
Figure 6.8: Plane fit to points from densification process for two surfaces--- 142
Figure 6.9: Epipolar line length constrained by Constraint 3 (left) and Constraint 4
(right)--- 142
Figure 6.10: Epipolar intersection constraint 2 - epipolar lines intersect to provide
candidate points for the matching process--- 143
Figure 6.11: Matching from epipolar intersection (left) and matching from backdriving
cross marks location of point estimation from backdriving--- 145
Figure 6,13: Edge segments in 2D and 3D space for the gearbox using the DCS460 data set A --- 146
Figure 6.14: 2D Triangulation constrained by line segments--- 146
Figure 6.15: 3D Triangulation constrained by line segments and rendered surface model 147 Figure 6.16: Object segmentation using boundaries--- 148
Figure 6.17: Range for Fourier magnitudes and corresponding gray level intensity histograms--- 151
Figure 6.18: Interest operator and matching results and corresponding Fourier plot--- 151
Figure 6.19: Histogram of Fourier magnitudes for successful and failed matching--- 152
Figure 6.20: Interest operator and matching results and corresponding Fourier plot--- 153
Figure 6.21: Histogram of Fourier magnitudes for successful and failed matching--- 153
Figure 6.22: Plot of image matching correlation and Fourier number--- 155
Figure 6.23: Plot of image matching correlation and Fourier number--- 155
Figure 6.24: Range of image matching correlation values in triangle--- 156
Figure 6.25a: Point extraction for the ‘curved surface patch in the DC260 (left) and DCS460 (right) datasets--- 157
Figure 6.25b: Point extraction for the ‘flat’ surface patch in the DC260 (left) and DCS460 (right) datasets--- 158
Figure 6.26: Matching success rate over 159patch size for ‘curved’ local surface--- 158
Figure 6.27: Matching success rate over patch size for flat local surface--- 159
Figure 6.28: Triangulation from DCS460 dataset (top) and DC260 (bottom) for ‘flat’ surface patch--- 161
Figure 6.29: Triangulation from DCS460 dataset (left) and DC260 (right) for ‘curved’ surface patch--- 161
Figure 6.30: Images of different dynamic range and areas of interest--- 162
Figure 6.31: Fourier-based texture indicator plots for two different dynamic ranges --- 162
Figure 6.37: Figure 6.38: Figure 6.39: Figure 6.40: Figure 6.41: Figure 6.42: Figure 6.43: Figure 6.44: Figure 6.45: Figure 6.46: Figure 6.47: Figure 6.48: Figure 6.49: Figure 6.50: Figure 6.51: Figure 6.52: Figure 6.53:
Local areas where CMM measurements were made. Red marks the areas used for accuracy
comparison---Network configuration of DCS460 and ES 1.0
datasets---Spherical ball bearing attached to the gearbox
surface---Concept of photogrammetric measurement of spherical
target---Image and VRML of surface 1 derived from densified point cloud - red marks casting
anomaly---Image residuals for densified point
cloud---Error ellipsoid after point cloud adjustment (red are points with four rays and excluded from the
analysis)---Surface comparison results for surface
1---Point to CMM reference surface comparison for the DCS460 data ■
Point to DCS460 reference surface comparison for the ES 1.0
data-Image and VRML of surface patches 2&3 derived from densified point cloud - red rectangle marks overlap area with CMM point
data---Densification results for surfaces 2 & 3 from the DCS460 data sets-
Probe tip measurement error
---Point to surface offsets for DCS460 point cloud - mean offset 0.45 mm
CMM reference surface 3 and reference surface derived from DCS460 point c lo u d
---Offsets of ES 1.0 point cloud from surface 2 derived from the DCS460 point data
---Offsets of ES 1.0 point cloud from surface 3 derived from the DCS460 point
data---Figure 6.54: Accuracy results for a lower and a high-resolution metrology camera
169 170 171 171 173 174 174 175 176 177 179 180 181 182 182 183 184 186
List of equations
Equation 2.1
Equation 2.2
Equation 2.3
Equation 3.1
Equation 3.2
Collinearity equations and rotation matrix R— Coplanarity equation and the Essential matrix Coplanarity equation and the Fundamental
matrix-Radiometric and geometric model for adaptive least squares matching. Correlation coefficient for texture
Equation 3.3 Equation 3.4 Equation 4.1 Equation 4.2 Equation 4.3 Equation 4.4 Equation 4.5 Equation 6.1:
Fourier transform and inverse Fourier transform. Discrete Fourier transform ---Radial (a) and tangential (b) lens distortion models- Enhanced collinearity equations (Atkinson, 1996)— Least squares bundle adjustment equations---Observation equations and cofactor matrix
Observation equations and cofactor matrix. Magnitude of the Discrete Fourier Transform
83 84 93 93 101 102 102 150
List of Tables
Table 2.1 Table 2.2 Table 2.3 Table 4. Table 6.1 Table 6.2: Table 6.3: Table 6.4: Table 6.5: Table 6.6: Table 6.7: Table 6.8: Table 6.9: Table 6.10 Table 6.11 Table 6.12 Table 6.13
Typical capabilities of commercial laser scanning systems Typical capabilities of commercial light projection systems- Typical accuracy of CMM system
s---Sensor characteristics for KodakDC260, DCS460, ES 1.0 and Canon DVl Datasets and cameras used (with identification index)---Matching results for one triangle covering continuous surface of small depth variation
Matching results for one triangle covering non-continuous surface of significant depth variation---Matching results for one triangle covering non-homogeneous surface and containing background surface of infinite depth---Example of internal (zero shift and rotation) and external (from triangle) affine transformation parameters and mean updated values after successful matching for continuous surface
example---30 36 42 90 132 136 137 138 139 RMS and standard deviation for shift parameters in matching and failure 139 cases for continuous curvature surface_________________________________ Plane fit to points from densification process for two surfaces_________ Matching results for triangle of different shape due to imaging geometry. Matching results for triangle of small depth variation using constraints 3 and
Matching results for complex surface using Constraint 2 and backdriving-Range of Fourier numbers for images used in densification Range of Fourier numbers for images used in densification process---Camera characteristics for DCS460 and DC260.0 datasets.
Table 6.14: Analysis of matching for a ‘curved’ triangle in the DC260 and DCS460 Table 6.15 Table 6.16 Table 6.17 Table 6.18 Table 6.19 Table 6.20 Table 6.21 Table 6.22 Table 6.23 Table 6.24: Table 6.25 Table 6.26 Table 6.27 Table 6.28 Table 6.29: Table 6.30: Table 6.31: Table 6.32: Table 6.33:
Table 7.1:
datasets
Matching results for images of different dynamic range of the same area Matching results for images of different dynamic range of the same area- Adjustment results for DCS460 network (data set C )---Object coordinate corrections for the targets used to constrain the network- Adjustment results for ES 1.0 network (data set K) ---Object coordinate corrections for the targets used to constrain the network. Network configuration for DCS460 and ES 1.0 datasets________________ Summary of results from self-calibrating bundle adjustment for ball bearing and retro reflective targets network ---Object coordinate corrections for the four ball bearings after self-calibrating bundle adjustment__________________________________________________ Target point offsets from CMM surface---Densification results for surface 1---Network adjustment results for surface 1
Coordinate corrections for target only network and target with point cloud n etw o rk ---Network adjustment results for surface 1 from the DCS460 dataset ---Densification results for surface 2&3 from the ES 1.0 datasets---Densification results for surface 2&3 from the DCS460 data set.
Matching and bundle adjustment results for surface 2&3---Bundle adjustment results for surfaces
2&3---Relative precision estimates for retro-target and combined point cloud and target
networks---159 Analysis of matching for a ‘flat’ triangle in the DC260 and DCS460 datasets— 160
Table 7.2: Relative precision for commercial measurements
AKNOWLEDGEMENTS
The developm ent o f this research has been an exhausting but highly rewarding
experience that w ould not have been possible w ithout the invaluable support o f my
supervisor, Dr. Stuart Robson, both during the painstaking process o f program m ing and
the even m ore taxing process o f w riting this dissertation. I w ould also like to thank my
second supervisor, D ave Chapm an for his very useful input and prom pt response.
Finally, I w ould like to give special m ention to the supportive, creative and friendly
environm ent o f the departm ent o f G eom atic Engineering and how this has been a
significant factor to the com pletion o f this research.
The hardships encountered during the years o f developing this research have been
significantly am eliorated by the trem endous financial but m ostly psychological support
o f my family, who really couldn’t have been any m ore helpful. T heir support, as well as
the support I ’ve had from my friends both in the U K and G reece, has been invaluable. I w ould like to m ention specially Tim, Andy and Chris for providing, am ong other things,
a very pleasant and desperately needed distraction to endless hours o f processing and
program m ing.
Finally, I w ould like to thank the G reek N ational Institute o f Scholarships (IKI) for their
ABSTRACT
A ccurate three-dim ensional m odels o f objects are increasingly required in engineering
applications. A ccurate surface point m easurem ent to targeted objects is already
established w ith close range photogram m etry using retro-reflective targets, dense image
netw orks and high-resolution digital cam eras w ithin the self-calibrating bundle
adjustm ent. H owever, in cases o f com plex objects, targets provide inadequate
inform ation about the object surface and m ore dense inform ation is required. The use of
alternative m easurem ent m ethods, such as coordinate m easuring m achines, laser
scanning or structured light projection, is not always appropriate or w ithin the cost
specifications o f the application.
This thesis describes a new m ethodology that robustly and reliably produces dense
surface m easurem ents o f com plex objects within the established m ulti-photo close
range photogram m etric framework. The m ethod represents a new fully autom ated process that densifies a triangulation m esh originating from a sparse set o f retro-
reflective targets m easured in an im age network, to produce a dense 3D point cloud that
is an accurate representation o f the object surface. In order to achieve this the technique utilises im age texture inform ation, a variety o f feature detection algorithm s and a set of
geom etric constraints, which are derived from im age netw ork geom etry and dynamic
D elaunay triangulation. Since the presence o f appropriate im age texture inform ation is
fundam ental to the technique, a rapid Fourier-based im age analysis tool that can detect
the presence o f suitable im age content is also integrated w ithin the m ethod.
Finally, data quality o f the 3D point cloud is investigated. The precision and reliability
o f the derived 3D data are ensured through the inclusion o f a least squares bundle
adjustm ent w ithin the method. An accuracy evaluation is achieved based on the
acquisition o f surface m easurem ent data from a m echanical probe-based coordinate
m easuring m achine (Leitz CM M , 101012). Results verify the capabilities o f the
IYN04^H
T piaSidaxaxa p o v x é l a a K p ip e ia ç é%o\>v a\)Çavôp8vri (f|XT|Gr| a s ecpappoysç px|%aviicf)q Ktti p,8xpoloy{ag. AKpiPeiç pexpfjaeK; orjpEiœv £7n(pdvsiaç Trpoç avxiKeipeva pe
Trpoaearjpaapévo'üç axôxoDç exoDV f|ôr| KaGiepœGei axrjv (pmxoypappsxpia
XPTjGipoTtoiœvxaç aD xo-avxavaK À aG X iK od ç axôxovç, jruKvd ôiKxua (pœxoypacpiœv Kai
\|/Ti(piaKéç pxjxavéç uvj/riXfiç avâXvar\c, Siapeaoi) xoi) povxéA-oi) e^axiaxcov xexpayévcov pe xa\)xôxpovr| a\)vôpGcoGri xoi) ea co x ep iK o d 7tpoCTavaxoX,iCTpoi3. H 8(pappoyf| 8vaÀlaKxiK©v
PeGôôcov péxpriariç, ôttcoç Mrixavéç M8xpf|a8©v AKpipEiaç (coordinate measuring
m achines - CM M ), laser scanners K ai structured light system s Ô8V 8iv a i Tcdvxa 8(piKxf| f|
U7i8pPaiV8i xo K Ô axoç xr|ç 8 (p a p p o y f|ç .
H ouyKEKpipévri épcuva 7T8piypdq)8i pia véa péGoôo yia xr|v aÇiÔ7naxr| k u i
oXoTcXripcopÉvri 7iapaycoyf| TuuKvœv p8xpf|08CûV oTipciov 87Ci(pdv8iaç 7r8pi7cX,OKC0V
avxiKEipévœv xP'H<^iM^o7roi(bvxaq œç UTiôpaGpo xr|v KaGicpcapevT] péGoôo xriç
noX\)-ôiKxuaKi)ç 87ny8iaç cpœxoypappcxpiaç. H v éa péGoôoç avxiTrpoacoTtcuci pia cvxclmg
auxopaxT) ÔiaôiKaaia TruKvœariç cvôç xpiycoviKOu ô i k x u o u, x o o t t o i o 7rpof|lG8 and éva piKpô yKpouTi auxo-avxavaKÀ,aoxiKd)v oxôxcov pcxpripévœv o8 ô i k x u o cpcoxoypaq)id)V, p8
0x6x0 xT|v Sripioupyia 8vôç t t u k v o u 3D ô i k x u o u orjpcicûv t t o u avavrapaoxouv p8 aKpipcia
xTjV 87n(pdv8ia xou avxiK8ipévou. H 87rix8uÇr| auxou xou oxôxou 8iv a i 8(piKxr| p8 xrjv
Eioayœyf) ‘u(pf|ç ciKÔvaç’ (im age-texture), alyopiGpcov auxôpaxriç cÇaycoyriç
XapttKxripioxiKobv oripcicov Kai ysopcxpiKmv Tccpiopiapœv, o i o t c o i o i Tcpoépxovxai aTcô
XT|V y8œ p8xpia xou ô i k x u o u Kai xov xpiycoviopô Delaunay. Acôopévou ôxi r| u7tapÇr|
‘u(pf|ç EiKÔvaç’ siv a i 7ipcoxapxiKf|q orjpaoiaç yia xr|v pcGoôo^voyia, évaç aXyopiGpoq
xaxeiaç avdXuoriç ciKÔvaç paoiopévoç oxrjv o8ipd Fourier 7i8piXapPdv8xai axrjv ép8uva.
T é lo g , T| TcoiôxTjxa xcov cÇayœpEvcov or|p8 0ÔiKxuœv 8p8UV8ixai A.87rxop8pd)ç. H
8O(0X8pncri aKpipcia Kai aÇiOTUoxia xcov 3D aripcicov 8ivai 8Ôpaicopévr| péoco xrjç
oup7t8pi^apPavopévriq auxo-ouvôpGcoorjç claxioxcov xcxpaycovcov. H a7c6A,uxr| aKpipcia
xcov or|p8icov 8p8uvdxai péoco xr|q ouyKpiorjç p8 ÔcÔopéva aTiô pia u\|/TtA,r|ç aKpiPciaç
pcxprjxncriç prixavfiç (Leitz CM M , 101012). T a aTioxcléopaxa CTuPcPaicovouv xiç
TTpoôiaypacpéç Kai ôuvaxôxrjxcç xr|ç pcGôôou v a Trapdyci Ôcôopéva u\|/r|A.f|ç aKpiPciaç Kai
INTRODUCTION
The key aim o f this thesis is to develope a m ethod for dense close range
photogram m etric m easurem ents o f com plex surfaces. Surface m easurem ents are of
interest in a variety o f applications, such as industrial and engineering metrology,
m edicine, architecture and archaeology. In such applications, m etric inform ation about
surface shape is often required, with the aim o f com paring as-built or m anufactured
shape to design shape, or the relative location betw een disparate com ponents. In the
field o f engineering metrology, a great num ber o f applications prim arily concerned with
3D m odels o f object surfaces set stringent requirem ents w ith respect to m easurem ent accuracy and data quality. Photogram m etry is an established m easurem ent m ethod in
engineering that can fulfil such requirem ents by applying retro-reflective targets, m ulti
photo im age networks and geom etrically stable digital cam eras within the self-
calibrating bundle adjustment. This thesis describes a m ethodology for producing accurate dense surface m easurem ents using a sim ilar close range photogram m etric
fram ew ork but with a m inim al num ber o f targets. The developed m ethod is shown to be
both autom ated and flexible in term s of the surfaces that are m easured and the types of cam eras used. A pplication exam ples in engineering m etrology as well as less accuracy-
oriented applications, such as archaeology, are given.
1.1
R e se arch b ack g ro u n d
The background for this research is set by exam ining and com paring m easurem ent
system s that have been established in engineering oriented close range applications to
provide data o f appropriate accuracy. For convenience and structuring o f this
com parison three-dim ensional m easurem ent m ethods are distinguished as being either
‘optical’ or ‘m echanical’.
Photogram m etry is an ‘optical’ m easurem ent m ethod that has been established as a
reliable high accuracy close range m easurem ent technique (§2.3.2). Com parisons
betw een photogram m etry and other m easurem ent system s that provide 3D surface
processing, some o f w hich are reliability, accuracy, flexibility and cost. However, the
severe lim itation o f applying pre-defined targets on the object surface in order to
achieve high accuracy m easurem ents renders photogram m etry inappropriate in cases
w hen targets cannot be placed or it becom es im practical to do so. The latter is
particularly true w hen object surface com plexity is such as to dictate a requirem ent for
very large num bers o f densely distributed targets, com parable in density to point clouds
produced by laser scanning or structured light m ethods (§2.2.1, §2.2.2). This conclusion
has led this research to inspect alternative m ethods for producing dense point data
w hilst avoiding the need to em ploy additional sensors, such as structured light
projectors, w hich can be restrictive. Possibilities for an alternative approach could be
found in the field o f m achine vision, where a large variety o f techniques for non-
m etrological purposes, such as visualisation and fast scene rendering, are initialised by
im age processing feature detection algorithm s (§2.3.3-§3.1.2). W hilst techniques in this
area are being increasingly em ployed within photogram m etric system s for aerial Digital
Elevation M odel generation, m achine vision techniques have expanded the use of natural features to a large variety o f close-range applications, w here accuracy is not the
key issue (§2.3.2.2).
1.2
R e se a rc h aim s
The program o f research described in this thesis focuses on the use o f digital
photogram m etry in com bination w ith other image based algorithm s, often m ore closely
associated w ith m achine vision, to provide an integrated fram ew ork for acquiring dense
object surface inform ation with an appropriate level o f data quality.
The prim ary aim o f this research is to develop a m easurem ent technique that fulfils a
num ber o f key requirem ents that are com m only encountered in close-range m etrology
applications involving com plex surfaces. These requirem ents are related to the object
characteristics, the purpose and accuracy o f the acquired data, and the speed, cost and
• C om plex object characteristics
This research is aim ed at resolving surface description problem s associated with
com plex objects, such as sharp depth discontinuities, occlusions and local curvature
variations. Such characteristics pose significant lim itations to existing close range
m easurem ent systems, such as laser scanning (§2.2.1), structured light projection
(§2.2.2) and CM M (§2.2.3). These lim itations associated w ith occlusion, boundary
definition and 3D m odel fidelity as well as accuracy and precision, are expected to be
surpassed w ith the proposed m easurem ent m ethod described in this research.
• D ata quality
To be fit for purpose, this research m ust produce m easurem ents that exhibit high
accuracy, precision and reliability within the specifications typically encountered in
metrology and engineering applications. M easurem ents from C oordinate M easuring
M achines (CM M ) are established as having the highest accuracy am ong all existing m easurem ent systems, including laser scanning, structured light projection and
photogram m etry (§2.2.3). However, in term s of speed, cost and efficiency the use of
CM M is often either not justifiable or inappropriate for a large num ber o f applications.
• Autom ation and flexibility
Photogram m etry has the advantage o f allowing fast data acquisition, w ith the ability to
capture large num bers o f im ages either remotely on digital data cards or directly to a
host com puter using a frame grabber. The exploitation o f the inform ation captured in an
image, w hich is actively pursued in machine vision applications to provide 3D surface
representations can be applied in a photogram m etric fram ew ork to provide automated,
dense point surface point data. This is achieved by integrating im age texture-related
algorithm s to derive all the necessary inform ation for producing surface measurem ents. The m ethod is aim ed to represent a new fully autom ated process that densifies a
triangulation m esh originating from a sparse set o f retro-reflective targets m easured in
an im age netw ork by incorporating such techniques w ithin a close range
photogram m etric m easurem ent framework.
• Cost
In the proposed close range photogram m etric m easurem ent fram ew ork the aim is to
achieve dense 3D object surface m easurem ents by using a single digital cam era. W hilst
the cost o f new high-resolution digital cam eras can be high it is significantly low er than
In order to achieve these aims a set o f algorithm s have been developed and im plem ented
in a w indow s-based environm ent. The developed process has been tested using
networks o f im ages acquired w ith a wide selection o f digital cam eras in order to
m easure a variety o f geom etric and free form surfaces. D ata quality has been validated
by m easurem ent com parisons to C M M data derived from the sam e surfaces.
1.3
T h e s is stru c tu re
The structure o f this thesis follows a num ber o f them es that have been explored in order
to arrive at the developed m ethodology. In Chapter 2, the background o f close range m easurem ent m ethods in m etrology is discussed and a justification for the developm ent
o f a photogram m etric m easurem ent system that deals with dense surface m easurem ents is given. This justification is drawn from the inability or im practicality o f alternative
m easurem ent system s to m eet m any o f the typically encountered m etrology
m easurem ent requirem ents.
C hapter 3 discusses the issues involved in 2D image m easurem ents that are encountered
in the tw o established optical m easurem ent m ethods o f photogram m etry and m achine vision. Such issues are associated with two different types o f features, artificially
introduced retro-reflective targets and natural point and line features. The com bination o f m easuring both w ithin the same images is exam ined by fine-tuning exposure and
gain settings in a high-resolution digital cam era to achieve optim um im age texture.
Texture m atching is im plem ented to derive im age point correspondences w ithin a m ulti
photo netw ork. Finally, the developm ent o f a rapid im age texture detection tool based
on the discrete Fourier transform is presented for the purposes o f establishing areas of
insufficient im age texture on-site, which are expected to have a significant im pact on
the perform ance o f the feature detection and texture m atching algorithm s.
The factors that are involved in achieving appropriate high quality im age m easurem ents
are exam ined in C hapter 4. The issues discussed in this chapter are associated with
digital cam era technology, calibration m ethods and data acquisition and established
m easurem ents. Such strategies include the acquisition o f m ulti-photo im age networks
and data processing w ithin a least squares bundle adjustment.
Chapter 5 gives a description o f the developed m ethodology and provides a detailed
discussion o f all the processing stages involved. The m ethodology is a densification
process that is initialised by applying dense natural feature detection w ithin the initial
im age-based triangles o f a sparse triangulation network. 2D im age point correspondence
is achieved by the developm ent o f a m ulti-photo geom etrically constrained texture-
m atching process and subsequent 3D coordinates are derived using photogram m etric
intersection. Precision and reliability assessm ent are achieved by processing the point
cloud w ithin a self-calibrating bundle adjustment. V isualisation and model fidelity
issues are addressed by the production of V R M L models.
Chapter 6 presents the results o f experim ents carried out to analyse the quality,
reliability and flexibility o f the densification method. These are categorised according to
image geom etry, im age quality and accuracy, precision and reliability. The first includes epipolar geom etry and bounding triangle geom etric constraints. The second evaluates
im age m agnification and image texture related issues, including the use o f a rapid image
texture detection tool based on Fourier m agnitudes. The third part o f Chapter 6
exam ines in detail the precision, reliability and accuracy achievable by the densification
methodology. Accuracy estim ates are m ade through com parison o f point cloud m easurem ents to independent m easurem ents made with a Leitz 101012 CM M at the
N ational Physics Laboratory.
Conclusions and suggestions for further w ork that arise from all previous chapters are
2
Measurement methods in close range applications
Three-dimensional measurements are acquired for the purpose of describing physical object properties such as shape and size, as well as dynamic phenomena, such as incremental
change over time, continuous movement and surface deformation. This research is involved with close range measurements of small-scale objects, which can extend up to 100 m in the largest dimension (Cooper et al, 1996) and are measured from distances of 0-300 metres between the measurement sensor and the object of interest. This research is involved with close range measurements of small-scale objects that typically occupy measurement volumes up to 1 m^ at distances from 0.5 to 3 metres, although it can be applied to larger
object volumes.
The acquisition of three-dimensional measurements is achieved by a number of different methods. The purpose of this chapter is to provide a comparison between established three- dimensional measurement methods in close range applications, distinguishing between ‘optical’ and ‘m echanical’ measurement methods. The selection of the described methods is based on the fact that they are all competitive techniques in the field of point measurement and established in a wide range of close range measurement applications. The strengths and weaknesses of each method are reviewed according to measurement acquisition and data quality criteria, where data quality is defined in terms of precision, accuracy and reliability (§4.2). In the context of this research, the criteria are significantly influenced by the
measurement requirements and are reviewed in relation to typical problems encountered in close range engineering and metrology applications.
Metrology applications commonly involve accurate, precise and reliable three-dimensional measurements of discreet points on object surfaces (Fraser, 1993; Schwartz, 1982; Atkinson,
1996). In the context of this thesis the term metrology is used to describe the process of acquiring three-dimensional measurements of small-scale objects and defining the level of
quality with which these measurements are made. The objects encompass a variety of applications, including industrial and engineering metrology and extending to medicine,
A comparison between the described measurement methods is made and the selection of an optical measurement method for the purposes of dense object 3D data acquisition is
justified. It is found that the framework of close range photogrammetry provides a number of advantages for discreet point measurements, such as the ability to extract a quantifiable measure o f data quality and lower cost. The integration of techniques from the research field of machine vision is offered as a viable solution to weaknesses inherent in typical close range photogrammetric processing, such as point density and automation.
2.1 Background
Close range measurement methods have developed from manual tape and optical theodolite measurement techniques to sophisticated digital systems, such as laser scanners and coordinate measuring machines (CMM), which are all able to provide robust, dense 3D point clouds on the object surface. Close range measurement systems provide three- dimensional coordinates with varying degrees of data quality according to the requirements of the application. Industrial and engineering metrology applications typically set the highest standards for measurement quality (Fraser, 1992; Beyer, 1995), although similar requirements can be encountered in applications such as architecture, archaeology and medicine.
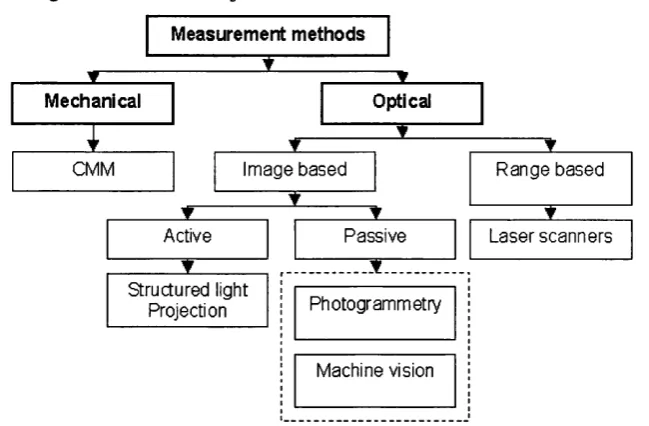
This research examines measurement systems that have been established in close range applications to provide data of appropriate accuracy. These can be distinguished, according to the means for data acquisition into optical and mechanical (Fig. 2.1). Optical systems can
be range-based, such as laser scanners and image-based, such as light projection systems, photogrammetry (§2.2.4.2) and machine vision (§2.2.4.4). Optical systems operate by sensing structured on unstructured light that illuminates the object surface. Optical range
systems record the reflected signal to establish 3D location, whereas image-based systems process the information that has been recorded in images. Laser trackers are optical range
on the object surface, whereas passive systems record objects illuminated by unstructured light in images. Mechanical systems, such as coordinate measuring machines rely on directly
applying a sensing element on the object surface to establish 3D location of discreet points.
Active Passive
Image based CMM
Laser scanners Optical
Mechanical
Machine vision Photogrammetry
Range based
Structured light Projection
Measurement methods
Fig. 2.1 : Diagram of close range measurement methods
Photogrammetry is an image-based measuring method initially derived for the purposes of mapping from aerial photography but is also established in a variety of close range applications (CIPA, 1993; Dallas et al, 1995; Gruen et al, 1989), including high accuracy engineering metrology (Fraser-ed. Atkinson, 1996; Beyer, 1995). In non-metrological applications, where accuracy is not the key issue, the field of machine vision provides a large variety of techniques for the purpose of visualization and fast scene rendering (Moravec, 1979, Pollefeys et al, 1998a). The research described in this thesis focuses on the use of digital photogrammetry in combination with other image based algorithms derived
from machine vision, to provide an integrated framework for acquiring dense object surface information with an appropriate level of data quality.
2.1.1 Measurement Requirements
Close range applications can be defined by a set of principal requirements that enable the
the object characteristics, the purpose of the acquired data, and the speed, cost and efficiency in terms o f automation and ease o f use of the measurement system.
The requirement for data density is often encountered in applications where complex shapes are involved and surface description is important. For example, in surface deformation applications dense point clouds are preferred to sparse key point feature measurements.
A nother requirement is automation during the measurement process as well as during data
processing. This requirement is taken into account when selecting an off-line or real time system.
Portability and versatility of the measurement method can also be very significant. For example, in some cases the object needs to remain on-site and is under constant use or movement or is not approachable and cannot be physically touched by any measuring instrument.
Finally, the requirement for data quality is very significant in close range metrology applications. The quality of the measurements is directly linked to the reliability and robustness of the measurement process, the density of the data and the speed and cost of the measuring system. The level of automation also affects data quality as fully automated procedures often make assumptions that do not apply in every situation and directly affect the quality of the measurements.
The cost o f the measuring system is always one of the key requirements in a large number of applications. This requirement is taken into account in respect to the purpose of the
in aircraft manufacturing to establish conformity to the design and reverse engineering (building CAD models of manufactured objects that no prior model exists for) have requirements of very high quality measurements (Fraser, 1996) from higher cost measuring systems.
2.1.2 Applications
Close range measurement applications are quite varied in the choice of measurement method according to the application requirements. Close range measuring systems are the focus point of ongoing research, which is aiming at improving measuring techniques and producing robust and reliable systems for a variety of applications. The majority of recent close range measurement applications is successfully achieving discreet point measurement and object reconstruction by using state-of-the-art commercial measuring systems.
In architecture and archaeology applications, precise models of large-scale objects, such as buildings and smaller scale artefacts are constructed for the purposes of heritage, restoration, and deformation monitoring. The systems that are most commonly used for such applications employ laser-scanning devices for the accumulation of three-dimensional data (Beraldin et al, 2001), as well as photogrammetry (Gruen et al, 2001) (Fig.2.2) (Pollefeys, 2000). Machine vision is often recruited in archeological applications to provide full 3D visualizations of archeological sites and artifacts (Fig. 2.3) (Cyra, 2001, 3D Laser Mapping Ltd, 2001).
Fig 2.3; Archeological (a,b) and architectural (c, d) reconstruction
In industrial and engineering applications, measurements o f machines or machine parts are increasingly important for dimensional metrology, maintenance, deformation monitoring and reverse engineering. Coordinate Measuring Machines (CMM) are the most common measuring systems in this area, with many applications in mass production and as-built verification (Fig. 2.4)(Leica Geosystems). An alternative measurement metliod is provided by close range photogrammetric systems, which have established a variety o f solutions for the accurate measurement of machine-made objects (ESIC SN, 2002). Close range laser scanning is another option for industrial and engineering metrology applications such as large-scale industrial environment reconstruction and as-built surveys for plant upgrades and refurbishment.
Fig. 2.4: Industrial metrology measurements of plane wing and automobile parts
body 3D reconstruction (Commean et al, 1994, D’Apuzzo N., 1998) (Fig. 2.5) ((Cyberware, 1999; GOM, 2002). Recently some consideration has been given to internal part measurements using on-site real time measuring systems during operations. Construction of full 3D models of die human body is applied in animation sciences as well as medicine, for the purposes of realistic human form representations. In such cases, object reconstruction from machine vision techniques is directly applicable.
I
I
Fig. 2.5: Body part modeling
2.1.3 Typical problems in close range measurements
For most close range applications data quality specifications and overall cost requirements can be met by more than one measuring system. This poses tlie problem of selecting the most appropriate measuring method to meet the specifications and solve the problems encountered in that particular application. Typical problems in close range applications involve object characteristics, occlusion and data density and are discussed with respect to data quality issues.
object surface. Laser scanning and light projection techniques for example, are very successful in providing dense surface measurements for continuous surfaces with smooth change in surface direction, although there tend to be failures at object boundaries and edges (Boehler et al, 2001). The complexity of the surface, in particular its degree of conformity to
a mathematical surface model, are significant factors in deciding the number and location of points required to achieve an appropriate representation of the object. In metrology applications, where issues like surface anomalies and localised deformations are o f interest, the appropriate measurement technique would be required to provide very dense point data with a very high degree of accuracy and reliability. In such cases, coordinate measurement machines can successfully overcome smaller volume and complex surface problems, but the
cost of such a system and the impracticality of applying it to complex objects is a great disadvantage.
Object dynamics pose a different type o f problem to most measurement systems. In cases where objects are in constant motion and need to be measured in a dynamic state, systems, which measure on a point-by-point measurement process, become unusable. In such cases photogrammetry can provide an alternative lower cost measurement method to active systems, w hilst still achieving very high standards of data quality.
Occlusions can be encountered when object complexity is responsible for obstructing the
view of parts of the object surface from particular viewpoints, or when more than one objects of interest are located in very close proximity as is the case in many engineering environments, such as industrial sites. Occlusion can be resolved by moving the
2.2 Close range measurement systems
The use of active sensor technology to acquire dense three-dimensional surface information is an increasingly researched and applied subject in close range applications (El-Hakim, 2001; Taylor, 2001). Active sensors produce a signal, which is directed or projected on the
object surface and recorded to provide 3D information. In the context of this thesis, active systems that are established and applied in commercial applications are examined and compared against each other in terms of fulfilling requirements described earlier in this chapter (§2.1.1).
2.2.1 Laser scanners
Laser scanning is used for a number of purposes, such as visualization and 3D modelling in a variety of applications, among which are deformation monitoring, maintenance and construction in engineering (Cyra, 2001; Leica Geosystems, LR200), architecture, heritage preservation (Baribeau et al, 1996; Soucy, 1996) and virtual reality (El-Hakim et al, 1996).
Among the laser scanning system capabilities are the ability to automatically record thousands o f points in a short period of time and produce a dense point cloud in 3D space. The points can be natural object points or predefined targets.
The fundamental characteristics of a laser scanner are the wavelength o f the laser beam, spot size, measuring range, accuracy, repeatability and resolution of the system. The laser wavelength used in laser scanning sensors lies between the infrared and green part of the
spectrum from 1 millimetre to 700 nanometers. Laser sensors are classified according to safety specifications based on wavelength and power output strength. Regulations require
manufacturers to certify each laser product as Class I (least hazardous), II, III, or IV, depending on the characteristics of the laser radiation emitted (EDA, 2002). The range of the sensor is defined by the minimum and maximum possible distance the sensor has been
scanner to the object. Each system configuration employs a different method of achieving three-dimensional positioning for the data points. Sensor resolution is defined by the m inimum angle between two distinct points, which can be individually and reliably measured by the laser beam, given the fact that the beam focuses on an area rather than a
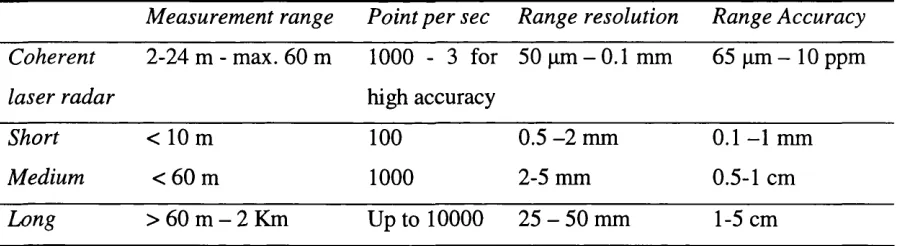
discreet point on the object. The minimum detectable object within the laser footprint depends primarily on the object reflectivity (diffuse, specular, diffuse and specular), as well as laser power, range, wavelength, aperture, atmospheric conditions and target structure when targets are used n the object surface (Baltsavias, 1999). The accuracy of the range data is highly dependant on the distance measurement method and the desired measurement range o f the scanner. A brief overview of the key capabilities of different laser scanning systems is given in (Table 2.1) (Hug, et al, 1997; Riegl, 2002; Cyra, 2001; Leica Geosystems, LR200). The coherent laser radar system is distinguished from other commercial scanners for its very high accuracy capabilities as a non-contact measuring coordinate machine (§2.2.3), but also its very high cost.
M easurement range Point per sec Range resolution Range Accuracy
Coherent 2-24 m - max. 60 m 1000 - 3 for 50 pm - 0.1 mm 65 pm - 10 ppm
laser radar high accuracy
Short < 10 m 100 0.5 - 2 mm 0.1 -1 mm
Medium < 60 m 1000 2-5 mm 0.5-1 cm
Long > 60 m - 2 Km Up to 10000 25 - 50 mm 1-5 cm
Table 2.1: Typical capabilities of commercial laser scanning systems.
2.2.1.1 Methods of distance measurement
The measuring method of laser scanning systems varies according to w hether a scanner is
configured for close, medium or far range measurements. It involves the recording of polar coordinates from an object point to the sensor using continuous or pulse laser configurations.
distance o f the point from the device. The laser spot is recorded by a CCD camera at an angle from the device, so that the position of the spot changes with varying distance (Fig. 2.6)( German Aerospace centre DLR). The distance is geometrically calculated from the viewing angle and the fixed base length between laser source and camera, which is known from calibration. The object is scanned in both X and Y directions, which allows for a 3D profile of the scanned surface. Triangulation scanners can achieve high accuracy for short ranges, given that their accuracy decreases with increasing range in proportion to the square of the distance. The depth range o f the object area is typically required to be within a certain limit (not greater than a third o f the largest dimension), as these sensors cannot measure relative to their baseline, which is defined as tlie distance between emitter and detector.
/
Fig. 2.6: Principal of optical triangulation
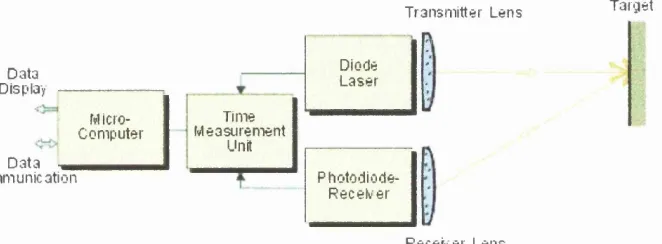
although atmospheric interference and bright daylight can reduce the measurement range. The measurement accuracy of this system is limited by the accuracy the time intervals are recorded (Baltsavias, 1999) and is greatly reduced when such a system is used at short ranges.
T ran sm itter L ens T arg et
D ata Display
Micro c o m p u te r D ata
C om m unication
Time M e asu rem en t
Unit
Diode L a se r
P h o to d io d e-R e c e tv e r
Receiv er L en s Fig. 2.7: Pulse laser principle
Another type of “time-of-flight” distance measurement system used for medium range applications employs a modulated-beam sensor. This sensor emits a signal, which is rapidly varied in strengtli to produce a signal that changes over time. Time-of-flight is indirectly measured by comparing the signal from the laser with the delayed signal returning from the target. This approach is used in phase measurement systems, where the laser signal is typically sinusoidal, and the phase of the outgoing signal is compared with that of the reflected liglit. Phase measurement is limited in accuracy by the frequency of modulation and the ability to resolve the phase difference between the signals. Some systems overcome some of the limitations of phase measurement by using the range-to-ffequency conversion principle (Acuity Research).
2
.2
.1.2
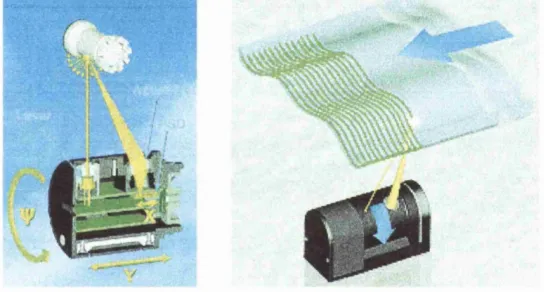
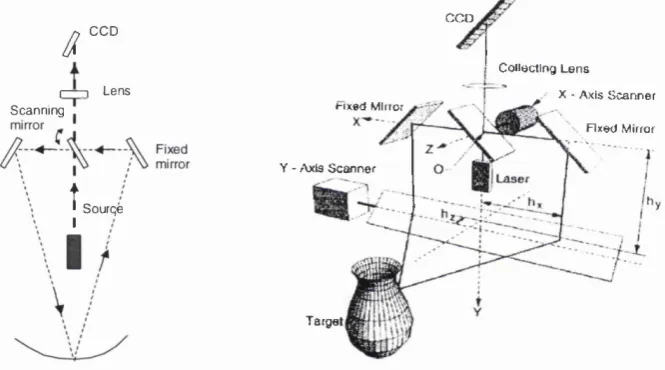
Synchronised laser scanner system descriptionAn example of a laser scanning system used in high accuracy metrological applications is the synchronized laser scanner (Rioux, 1984), developed at the National Physics Laboratory of Canada. The system consists of a laser beam source, a double-sided mirror for the projection and detection of the laser signal, two scanning mirrors to deflect the beam within the predefined scanning range and a CCD sensor for the recording of the signal position and intensity (Fig. 2.8) (Al-Hanbali et al, 2000).
C C D
S can n in g
â
i~ ~ n L ens
CCD
C ollecting L e n s
X - Axis S c a n n e r
Î
I
Y - /\xl3 S c a n n e r
S o u rq e
H xed Mhrot
Fixed Mirror
Target
Fig. 2.8: Synchronized laser scanner
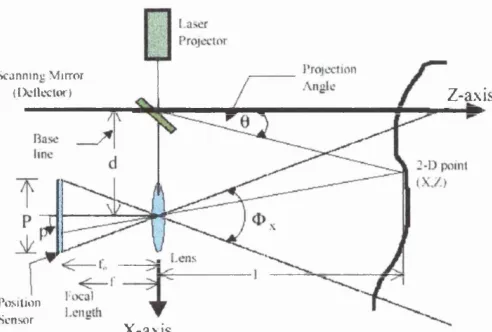
Scanninj; Mirror
(IXMlecior) Z -a x is
I’oMlJon Sensor
X -a x is
Fig. 2.9: Triangulation geometry for the synchronised laser scanner
The accuracy of a laser scanning system is highly dependant on the mean distance o f the system from the object of interest. The accuracy achieved with this particular system is estimated to be 0.2 mm for distances of 0.6 - 2.0 metres, which are typical for close range metrological applications. The key advantages of tliis system over conventional optical triangulation laser scanning systems are decrease of the laser spot size and greater immunity to ambient liglit.
2.2.1.3 Key advantages and disadvantages
On the other hand, scanning systems are often too expensive for small-scale projects and cannot be applied to all objects or scenes. For example, complex surfaces with abrupt discontinuities cause failures in the return signal and consequently loss of data around boundaries and steep surface changes. The reflectivity o f the targeted surface is another important factor, which can cause failures and loss of data quality. In optical triangulation
systems, which yield the highest accuracy the complexity of the object surface can cause failures. For example, surface discontinuities and abrupt height (depth) changes cause distortions in the imaging of the circular laser footprint and consequently miscalculation of the point position. Complex objects require registration of a large num ber of scanning profiles (Bom az et al, 2002) from different angles to resolve occlusion, which can limit the speed, efficiency and data quality of the final product. Finally, and most importantly the absolute accuracy o f the 3D point cloud is not within the specifications for many applications in industrial and engineering metrology.
2.2.2 Projection systems
Projection systems are used in many applications, such as medicine and metrology for the three-dimensional measurements of objects. In engineering applications projection systems provide an increasingly utilised method for measuring small industrial objects for maintenance and monitoring purposes. The technique is capable of providing dense 3D measurements particularly in cases when the object surface has little or no texture, such as smooth metallic and plastic surfaces.
Projection systems involve the projection of a visible or infrared light pattern on the object surface. The projection pattern can be formed using a variety of different projectors, such as
laser dot, LCD (Liquid Crystal Shutter), stripe, slide, and M oiré (Guehring, 2001). A projection system typically consists of the light projection device and one or more digital imaging sensors set up at an angle from the projector, with the whole system linked to a computer. The geometrical configuration between the projector and the imaging system is
Key characteristics of a light projection system are the spatial resolution, the imaging sensor
resolution, the field of view, the focus and the depth range accuracy. Spatial resolution is defined by the angular separation between pattern lines, which is set according to the level of detail the object is required to be modelled at. The field of view is defined by the depth range outside which the projected pattern comes out of focus. Projection systems typically have adaptable focus settings according to the distance from the object. M ost projection systems have low spatial resolution and although there are close range systems with high
resolution, the field of view is very narrow and they can be applied to measure quite small objects.
The single point depth accuracy achieved by active projection systems depends on the type of projection pattern, triangulation angle and calibration accuracy. Surface reflectance also influences the overall accuracy of the range measurement, as specular surfaces tend to reflect the pattern away from the camera and cause ambiguity in decoding the pattern code. Additional problems can also be caused when a section of the projected pattern is not
imaged by the cam era due to occlusions depending on the angle between the camera and the projector (triangulation angle), resulting in complete loss of data locally. A summary of typical values for the key characteristics of various projection patterns can be seen in table
2
.2
.M easurement volume Acquisition speed Spatial resolution Accuracy
Scanners 0.5-1 m^ 1 - 1 0 sec 0.5 - 2 mm +/-0.1-1 mm
Table 2.2: Typical capabilities of commercial light projection systems.
The complexity of the imaged objects, as well as requirements for higher accuracy have
caused projection systems to expand on the basic configuration of a single projector and a digital camera. Variations on the basic configuration include using more than one digital cam era or video recorder (Knyaz et al, 1999; Guehring, 2001; Niel et al, 2002), or the use of
2.2.2.1 Measurement method for structured light
The measurement method used in structured light projection systems is based on active triangulation, where a point is defined as the intersection of an optical ray and a plane in 3D space. The optical ray is formed by the position o f a discreet point in the image and the plane is defined by the projection pattern.
The basic concept behind the measuring technique is to observe how a known light pattern gets distorted on the object surface. The projection pattern can be moved along the object surface, or projected at a fixed position depending on the technique. In the case of projecting
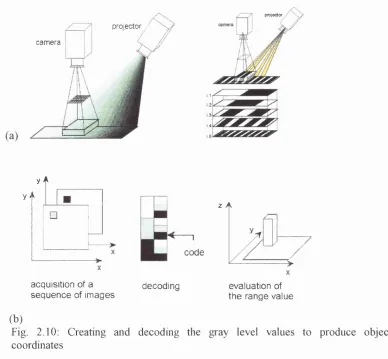
a pattern at a fixed position, a point on the object surface is observed by the digital imaging sensor at a number of different illumination circumstances, created by the projection sensor. This yields a code defined by a set of gray level values for each pixel, which corresponds to the intensity code o f the particular lighting pattern. The gray level values for each pixel are constructed by various techniques, such as projecting a fixed light pattern at different intensities or sequentially alternating between patterns (Fig. 2.10a) (Gartner et al, 2002). Appropriate decoding (Altschuler et al, 1979) provides the angle of projection for each lighting pattern (Fig. 2.10b), which defines a plane in 3D space. The plane location along with the image coordinates of the point, the position and attitude of the camera and the distance from the projector to the camera is used to solve for the position of the point on the object surface (Trobina, 1995).
In the case of a moving light pattern, the pattern is projected at various known positions around the object and the digital camera is set to acquire images at all projection times. Each
projection position has been computed in advance and for each pixel the gray level value of the distorted stripe is stored at every position to form an n-bit code. The knowledge of this code and the orientation parameters of the acquisition system allow for the establishment of the 3D position of the observed object point by triangulation. Initially an image is acquired