© 2014 IJEDR | Volume 2, Issue 4 | ISSN: 2321-9939
IJEDR1404002
International Journal of Engineering Development and Research (www.ijedr.org)3365
A study on River Bank Erosion of Jamuna River
using GIS and Remote Sensing Technology
1
Imran Khan,
2Muneer Ahammad,
3Shiblu Sarker
Postgraduate StudentDepartment of Water Resources Engineering,
Bangladesh University of Engineering and Technology, Dhaka, Bangladesh
________________________________________________________________________________________________________
Abstract - Jamuna River is characterized by its extremely dynamic and unstable alluvial channels. This 240km long braided river is located in lowest reach of the Brahmaputra River in Bangladesh. The Brahmaputra River catchment supplies enormous quantities of sediment from the actively uplifting mountains in the Himalayas, its erosive foothills and the great alluvial deposits stored in the Assam Valley. Large discharge and heavy sediment load during floods causes the Jamuna River to be extremely unstable, because of which it consistently migrates laterally. This tendency of lateral channel migration, results in erosion of the river banks which causes severe problem to the people living in the floodplain of the river Jamuna. This particular study was carried out using the satellite imagery of the last decade as well as some old historical images to show the pattern and extent of channel migration and bank erosion of the Jamuna River. A comprehensive analysis was carried out in this study using the state of the art GIS technology to identify the vulnerable reaches of the river in respect of bank erosion.
Index Terms - Morphological change, Bank Erosion, Jamuna River, GIS
________________________________________________________________________________________________________
I. INTRODUCTION
The gradient, water volume, water velocity and nature of river are responsible parameters for changing the rivers shape and size. The geomorphologic formation and the physical dynamics of the Brahmaputra basin are subject to runoff from the highest and most tectonically active mountain range in the world, the Himalayas. The combination of large and variable discharges of water and sediment is responsible for the Jamuna’s braided pattern which is characterized by unstable banklines and rapid rates of lateral movement. River bank erosion is treated as one of the foremost natural disasters responsible for poverty in Bangladesh due to the enormous destruction of resources and displacement of large numbers of the population. The hazard also has an impact on unemployment levels in rural Bangladesh. Hence, study on bank erosion and identification of vulnerable reaches, especially for the case of Jamuna, has great importance as it provides the opportunity to adopt possible strategies that may assist in mitigating the human suffering and adverse socio-economic impacts of these recurring natural events.
There is growing trend in research community to apply the various high tech techniques for human being's problems identification and to seek its solutions. GIS and RS are important tools which can aid in identifying river changes and bank erosions situations. This computer oriented techniques provides a platform to analyze spatially varied data and helps to find influential results. This study is aimed at quantifying the actual rates of bank erosion along the river Jamuna based on time series analysis of satellite images. This work also focuses on pattern of the change of channel alignment and identification of the reaches which are under potential risk of bank erosion as well.
II. STUDY AREA
IJEDR1404002
International Journal of Engineering Development and Research (www.ijedr.org)3366
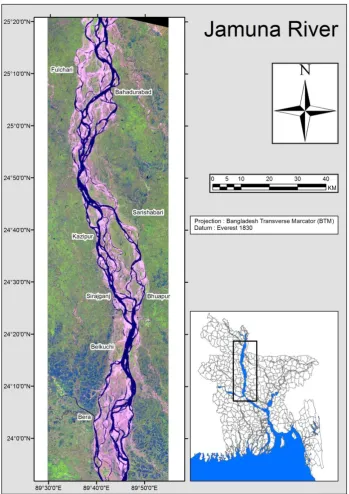
Figure 1 Study AreaIII. DATA AND METHODOLOGY
Identification of the channel migration pattern of rivers from satellite images of different years using GIS and Remote Sensing technology is found very much useful for studying the fluvial geomorphology of a river. For the purpose of this study the dry season satellite images from 1973 to 2014 have been collected. The details of these images are shown in Table 1. Bank lines of these years were digitized from the geo-referenced satellite imageries using the ARC GIS and erosion-accretion pattern due to the lateral movement of the active river channel have been estimated using the GIS software. Along with these, all the major channels of the Jamuna River were also digitized to show the channel migration pattern of this highly morphologically active river.
Table 1 List of Images used in the study and its properties
Image Year Satellite Ground resolution Source
1973 LANDSAT (LM) 1 60m x 60m
USGS
1976 LANDSAT (LM) 2 60m x 60m
1979 LANDSAT (LM) 3 60m x 60m
1989 LANDSAT (LT) 4 30m x 30m
2004 LANDSAT (LT) 5 30m x 30m
© 2014 IJEDR | Volume 2, Issue 4 | ISSN: 2321-9939
IJEDR1404002
International Journal of Engineering Development and Research (www.ijedr.org)3367
Image Year Satellite Ground resolution Source
2006 LANDSAT (LT) 5 30m x 30m
2007 LANDSAT (LT) 5 30m x 30m
2008 LANDSAT (LT) 5 30m x 30m
2009 LANDSAT (LT) 5 30m x 30m
2010 LANDSAT (LT) 5 30m x 30m
2011 LANDSAT (LE) 7 30m x 30m
2012 LANDSAT (LE) 7 30m x 30m
2013 LANDSAT (LE) 7 30m x 30m
2014 LANDSAT (LC) 8 30m x 30m
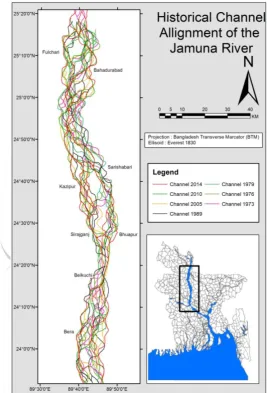
IV. CHANNEL ALIGNMENT
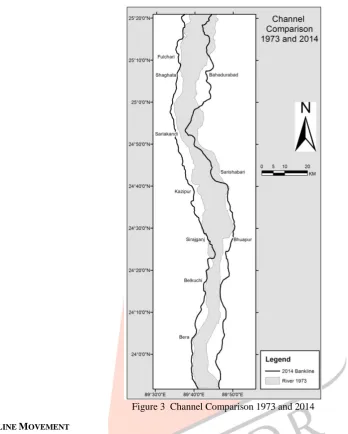
The historical channel alignment is shown in Figure 2. The figure clearly shows the dynamic braided nature of the Jamuna River. Due to the high sediment of load of the river, the channel pattern becomes highly irregular and changes abruptly. On the other hand a generalized output of the river bankline for the year 1973 and 2014 is shown in Figure 3. From this figure we can see near Sariakandi there is tendency of the channel to move towards the right bank. However near Bhuapur the channel is moving towards the left bank side and then takes more of a straight shape after Sirajganj.
IJEDR1404002
International Journal of Engineering Development and Research (www.ijedr.org)3368
Figure 3 Channel Comparison 1973 and 2014V. BANKLINE MOVEMENT
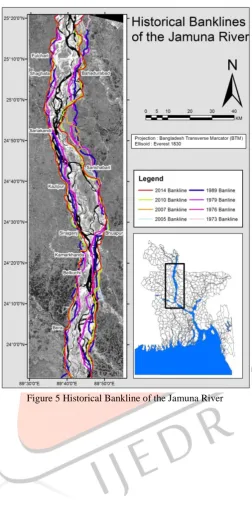
The historical bankline movement of the Jamuna River is shown in Figure 5. An interesting thing visible from this Figure as well as from Figure 3 is that the average width of the Jamuna River is showing an increasing trend. To verify this observation the average width of the river for all the available satellite images were determined using the digitized banklines. A plot was prepared showing the changing width of the Jamuna river which is shown in Figure 4. The Figure clearly shows the increasing average width of the river.
© 2014 IJEDR | Volume 2, Issue 4 | ISSN: 2321-9939
IJEDR1404002
International Journal of Engineering Development and Research (www.ijedr.org)3370
Figure 6 Bank Erosion and Accretion extent between 1973 and 2014VI. EROSION AND ACCRETION
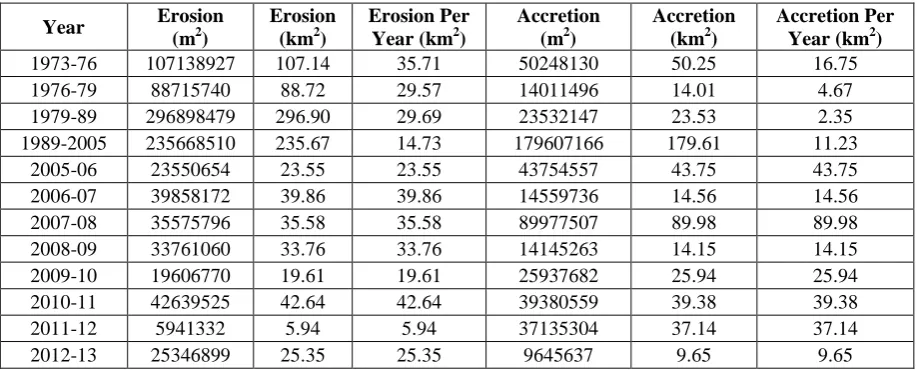
The area of erosion and accretion due to the river bank movement has been calculated with the aid of GIS for the purpose of this study, the details of which is shown in Table 2. On the other hand the details of the areas where erosion and where accretion has taken place over the last forty years are shown in Figure 6. It is visible from the Figure that in most places the unstable river bank has caused river bank erosion. However around about 15km downstream of Bahadurabad, up to Sarishabari has shown accretion tendency. Over here around about 125km2 of land has accreted over the last forty years. Interestingly although the summation of the year wise erosion shown nearly 1000km2 of erosion, the net erosion is actually around 607km2. This is because some of the area eroded in one flood may get aggraded in the next flood. The similar thing is also seen in case of accretion where the net accretion is found to be 166km2.
Table 2 The Details of Erosion/Accretion of the Jamuna River over the last 40 years
Year Erosion (m2)
Erosion (km2)
Erosion Per Year (km2)
Accretion (m2)
Accretion (km2)
Accretion Per Year (km2)
1973-76 107138927 107.14 35.71 50248130 50.25 16.75
1976-79 88715740 88.72 29.57 14011496 14.01 4.67
1979-89 296898479 296.90 29.69 23532147 23.53 2.35
1989-2005 235668510 235.67 14.73 179607166 179.61 11.23
2005-06 23550654 23.55 23.55 43754557 43.75 43.75
2006-07 39858172 39.86 39.86 14559736 14.56 14.56
2007-08 35575796 35.58 35.58 89977507 89.98 89.98
2008-09 33761060 33.76 33.76 14145263 14.15 14.15
2009-10 19606770 19.61 19.61 25937682 25.94 25.94
2010-11 42639525 42.64 42.64 39380559 39.38 39.38
2011-12 5941332 5.94 5.94 37135304 37.14 37.14
© 2014 IJEDR | Volume 2, Issue 4 | ISSN: 2321-9939
IJEDR1404002
International Journal of Engineering Development and Research (www.ijedr.org)3371
Year Erosion(m2)
Erosion (km2)
Erosion Per Year (km2)
Accretion (m2)
Accretion (km2)
Accretion Per Year (km2)
2013-14 43952023 43.95 43.95 15585053 15.59 15.59
VII. CONCLUSION
Based on this study following conclusions can be drawn,
The overall channel pattern of the Jamuna River is shown a rightward shifting tendency near Sariakandi and left ward moving tendency near Bhuapur.
The average width of the Jamuna River is increasing and over the last forty years the average width has increase around about 3 km.
The net erosion was calculated as 607km2 while the net accretion was found to be 166km2.
Most of the accretion has taken place from 15km downstream of Bahadurabad up to Sarishabari. REFERENCES
[1] Gogoi, C; Goswami, DC, “Study on Bank Erosion and Bank Line Migration Pattern of the Subansiri River in Assam Using Remote Sensing and GIS Technology”. The International Journal Of Engineering And Science (IJES), 2013, vol. 2, issue 9: pp. 01-06.