Magnetization Transfer Imaging to
Investigate Tissue Structure and Optimise
Detection of Blood Brain Barrier Leakage
in Multiple Sclerosis
Dr Nicholas Charles Silver, MBBS; MRCP
A thesis submitted to the University of London for the degree of
Doctor of Philosophy
March 2001
NMR Research Unit
Institute of Neurology
University College London
Queen Square
ProQuest Number: U643048
All rights reserved
INFORMATION TO ALL USERS
The quality of this reproduction is dependent upon the quality of the copy submitted.
In the unlikely event that the author did not send a complete manuscript
and there are missing pages, th ese will be noted. Also, if material had to be removed, a note will indicate the deletion.
uest.
ProQuest U 643048
Published by ProQuest LLC(2016). Copyright of the Dissertation is held by the Author.
All rights reserved.
This work is protected against unauthorized copying under Title 17, United States Code. Microform Edition © ProQuest LLC.
ProQuest LLC
789 East Eisenhower Parkway P.O. Box 1346
Abstract
Magnetic resonance imaging (MRI) has become a powerful researeh tool for in vivo
evaluation and monitoring o f multiple sclerosis (MS). Conventional MRI techniques detect
changes in the density or relaxation characteristies o f “free” water protons. They are sensitive
but lack pathological specificity. Magnetization transfer (MX) imaging provides a method for
evaluating those protons “bound” to maeromolecular struetures.
Part one o f this thesis outlines the clinical and pathological features o f MS and discusses
the importance o f demyelination and blood-brain barrier breakdown. An introduction to MRI
and MX imaging techniques is provided. Issues related to quality assuranee and standardization
for MX imaging are explored. In part two, MX ratio (MXR) is explored as a putative quantitative
marker o f demyelination and associated tissue destruetion. In part three, MX contrast (MXC) is
explored as a novel mechanism for improving the detection o f focal contrast-enhancing lesions.
A normative database for MXR in healthy white matter is presented in ehapter four.
Highest values are found where myelin density is greatest. M inor age-related MXR reduction is
observed. In ehapter five, MXR is evaluated in central pontine myelinolysis, a rare neurological
condition characterised pathologieally by severe demyelination. The results support myelin as
the predominant contributor to MXR values in white matter. In ehapter six, MXR is employed
as a putative marker o f demyelination to explore the relationships between demyelination and
blood-brain barrier damage in acute MS lesions. New techniques for registering two-dimensional
images were implemented to allow reliable measurement o f MXR prior to visible lesion
formation. No evidence was found to suggest signifieant demyelination prior to opening o f the
blood-brain barrier. Chapter seven details the novel application o f MXR measurement in the
cervieal spinal eord and preliminary data are presented showing reduction in MS. Further studies
in this clinically eloquent region will be o f interest.
The potential for MXC to improve gadolinium enhancing lesion deteetion in MS is
explored in the ehapters eight and nine. First, a cross-seetional study explores how the detection
o f enhancing lesions may be improved by MXC; in conjunction with a triple-dose gadolinium
and subsequent delay prior to imaging, sensitivity was more than doubled. Xriple-dose improved
sensitivity more than MXC. Finally, a serial study is presented that confirms a significant
increase in longitudinal sensitivity for such techniques. The potential benefits for monitoring
Acknowledgements
Thanks to my supervisor David Miller for his guidance and unfailing support throughout
my time in research. I have benefited from both his global vision and attention to detail. I would
especially like to thank Ian McDonald for his clarity, wisdom and kindness, all o f which have
provided a continued source o f inspiration. Thanks also to Alan Thompson for his input.
Many thanks to Paul Tofts and Gareth Barker for their theoretical and practical input. I
am indebted to Tina Good for her radiological expertise, enthusiasm, and friendship. Thanks also
to Ivan Moseley and Mary Gawne-Caine. I have enjoyed the international collaboration afforded
by MAGNIMS and would particularly like to thank Achim Gass and Wolfgang Schreiber for
their helpful suggestions and Massimo Fillipi and Maria Pia Sormani for their collaboration. I
am grateful to Mark Symms for his genuine enthusiasm and novel ideas. This thesis would not
have been possible without the dedication and hard work o f all o f the radiographers in the unit.
Special thanks to Dave MacManus and also to Alison Fletcher, Beth Gunn, and Andrew Howe.
Thanks to my fellow “Moorfields Clinic” colleagues who provided invaluable “out o f
hours”advice. In particular, thanks to Gavin Giovannoni for his collaboration and inspiration,
John Mottershead for his companionship and laboratory “cookery” skills (not forgetting the help
from Alison Green and G eoff Keir), Bob Brenner, Nick Losseff (for imparting his statistical and
software knowledge and for showing how the best ideas are the simple ones), Ming Lai (for
letting me use his data), Charlie Davie, Jonathon O ’Riordan and Katia Cikurel.
I particularly wish to thank my friends and fellow members o f the NM R Unit, including
Michael Sailer, Tina Holmes, Val Stevenson, Niall Tubridy, David W erring, Siobhan Leary,
Paul Molyneux, Peter Brex, Chris Clark, Jackie Foong, Collette Griffin, Arun Reginald and
G eoff Parker. M y thanks to you all for your kinship and support through the good times and the
bad. Special thanks to my successor, Tony Traboulsee, for proof reading this tome. Thanks also
to my non-medical friends, Lany, Moss, Lou, and Jonny for their much appreciated diversions.
Thanks to Di for her unfailing support, enthusiasm, and understanding (thank you also
for providing me with the most wonderful distractions ever imagined, Amy and Ben). Thank you
also to my parents, Trevor and Jill, for their constant encouragement and faith in me.
A special thanks to the Multiple Sclerosis Society o f Great Britain and Northern Ireland
for their generous support throughout my research studentship. Finally, thank you everyone who
Statement of Authorship
All projects outlined in this thesis represent my original and personal work. This thesis
would not however have been possible without specific individual contributions from
collaborators within the NMR Unit and other research centres. With the following exceptions and
those listed in the text o f this thesis, I was responsible for the initiation and design o f all project
protocols, recruitment o f subjects for study, acquisition o f all clinical and radiological data (with
help from the individual radiographers who performed all scanning), analysis o f all image data,
statistical testing, and interpretation o f the subsequent results: In Chapter 3, Drs. John
Mottershead, Geoff Keir, and Alison Green helped design and manufacture the M TR phantoms.
In Chapter 5, Dr Charlie Davie acquired the proton MRS control data from four healthy
volunteers. In Chapter 6, Dr Ming Lai recruited and acquired data from three o f the subjects. In
Chapter 9, Dr Maria Pia Sormani performed the sample size calculations in conjunction with Dr
Table of Contents
Page
Abstract 2
Acknowledgements 3
Statement of Authorship 4
Dedication 5
Table o f Contents 6
List o f Figures 11
List o f Tables 15
List o f Abbreviations 17
List of Publications 18
PART ONE BACKGROUND
1. Introduction
1.1 Personal and social cost implications o f multiple sclerosis 21
1.2 Background 22
1.3 Aims 24
1.4 Multiple sclerosis
1.4.1 Clinical background and definitions 25
1.4.2 Diagnosis 25
1.4.3 Clinical manifestations 33
1.4.4 Aetiology 36
1.4.5 Neuropathology 38 1.4.6 Treatment - disease modification 49 1.4.7 Treatment - symptomatic strategies 52
and rehabilitation
2. Common Methodology
2.1 Introduction 56
2.2 Basic principles o f magnetic resonance imaging
2.2.1 Introduction 56 2.2.2 Quantum mechanical description 57
o f magnetic resonance
2.2.3 Classical description o f magnetic resonance 59 2.2.4 Factors affecting the NMR signal: 63
Spin-lattice and spin-spin relaxation
2.2.5 Free induction decay and signal detection 66 2.2.6 Spin echoes 67 2.2.7 Relaxation mechanisms 70 2.2.8 Tissue NMR relaxation properties 74 2.2.9 Obtaining spatial information with 76
magnetic resonance imaging
2.2.10 M RIinstrumentation 80 2.2.11 Alternative pulse sequences fo r imaging 81
2.3 Magnetization Transfer: principles and techniques
2.3.1 Introduction 83 2.3.2 Basic principles o f magnetization transfer 84 2.3.3 Saturation transfer 85 2.3.4 Magnetization transfer in biological tissue 87 2.3.5 Preliminary in vivo demonstration o f M T 90
effects in biological tissue
2.3.6 In vivo applications o f magnetization 91 transfer imaging
2.4 MRI to assess blood-brain barrier integrity
2.5 MRI postprocessing to quantify pathological change
2.5.1 Qualitative M R I 104 2.5.2 Quantitative M R I 105
2.6 Clinical measurement
2.6.1 Approaches to disease quantification 108 2.6.2 Impairment and disability 109 2.7.3 The Expanded Disability Status Scale 110
3. Quality assurance and standardization for magnetization transfer
imaging
3.1 Introduction 113
3.2 Applications o f magnetization transfer
3.2.1 magnetization transfer contrast 114 3.2.2 magnetization transfer ratio 114 3.2.3 A bsolute quantitative measures o f the 116
magnetization transfer effect
3.3 Standardization o f MTR data acquisition
3.3.1 Factors that affect M T saturation 116
3.4 M TR data acquisition and processing to achieve standardised 123
measures
3.5 Quality assurance
3.5.1 Development o f a phantom fo r MTR 124 quality assurance
3.5.2 Developing and implementing a protocol fo r 125 quality assurance in M T imaging
PART TWO MAGNETIZATION TRANSFER TO MEASURE
STRUCTURAL INTEGRITY
4. A normative database for brain MTR measurements in health
4.1 Introduction 131
4.2 Methods 131
4.3 Results 134
4.4 Discussion 137
5. MTR as a putative marker of demyelination: observations in
central pontine myelinolysis
5.1 Introduction 140
5.2 Methods 142
5.3 Case histories 143
5.4 Discussion 152
6. A study to define the pathological evolution o f new MS lesions
6.1 Introduction 158
6.2 Methods 159
6.3 Results 161
6.4 Discussion 167
7. M easurement o f M TR in the spinal cord in MS
7.1 Introduction 173
7.2 Methods 174
7.3 Results 176
PART THREE MAGNETIZATION TRANSFER AS A CONTRAST
MECHANISM
8. A cross-sectional study to evaluate techniques to optimise detection
of focal blood-brain barrier breakdown in multiple sclerosis
8.1 Introduction 182
8.2 Methods 184
8.3 Results 187
8.4 Discussion 195
9. A serial study to assess the longitudinal sensitivity o f an optimised
approach for contrast-enhanced imaging
9.1 Introduction 201
9.2 Methods 202
9.3 Results 206
9.4 Discussion 212
PART FOUR CONCLUSION
10. Conclusions
10.1 MTR as a robust measure o f structural change in 217
multiple sclerosis
10.2 Future development o f MTR techniques 221
10.3 The role o f MT as a technique for improving sensitivity o f 222
contrast-enhanced MRI
10.4 Future development o f contrast-enhanced MRI 224
APPENDIX A A1 The expanded Disability Status Scale (EDSS) 226
A2 Functional Systems 228
APPENDIX B B1 Conference proceeding abstracts 231
List of Figures
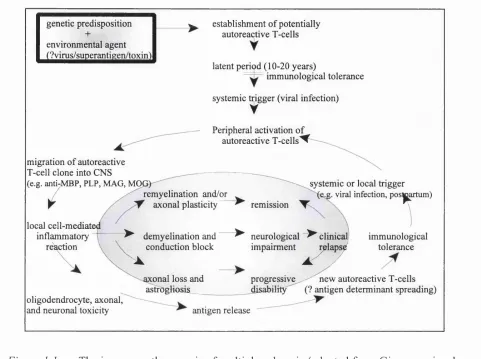
1.1 The immunopathogenesis o f multiple sclerosis. 2.1 Energy level diagram for the hydrogen nucleus. 2.2 Precession o f a spin in a magnetic field.
2.3 Diagrammatic representation o f the net magnetization (M ) o f individual magnetic moments at equilibrium.
2.4 The rotating frame.
2.5 Diagram showing return o f longitudinal magnetization in the rotating frame o f reference (due to spin-lattice relaxation).
2.6 Spin-lattice relaxation: exponential decay o f longitudinal magnetization back to its equilibrium value, with time constant T l. Two tissue types with different relaxation
properties are shown, showing the potential for generating “T l -weighted” image contrast.
2.7 Diagram showing decay o f transverse magnetization due to loss o f phase coherence
between the spins in the rotating frame o f reference (due to spin-spin relaxation).
2.8 Spin-spin relaxation: exponential decay o f transverse magnetization back to zero, with time constant T2.
2.9 Free induction decay.
2.10 The spin echo.
2.11 Generation o f T2 contrast with T2-weighted sequences. Two tissue types with different T2 curves are shown, showing the potential for generating “T2-weighted” image contrast.
2.12 Diagram showing a hydrogen proton magnetic moment and both its own associated magnetic field lines and those o f the external magnetic field, Bq.
2.13 Diagram illustrating how molecular rotation within the external magnetic field (Bg) can result in the hydrogen proton, Hy, experiencing different local magnetic fields as a result
o f its neighbouring hydrogen proton, Hg.
2.14 A diagram illustrating how a superimposed field gradient may allow spatial information to be obtained in the form o f a spectrum.
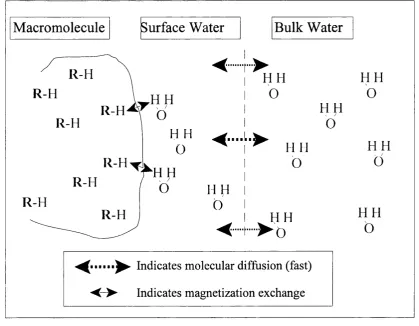
2.15 A diagram showing water structuring with magnetic interactions between water and maeromolecular protons (modified from Balaban and Ceckler (1992)). R in the diagram
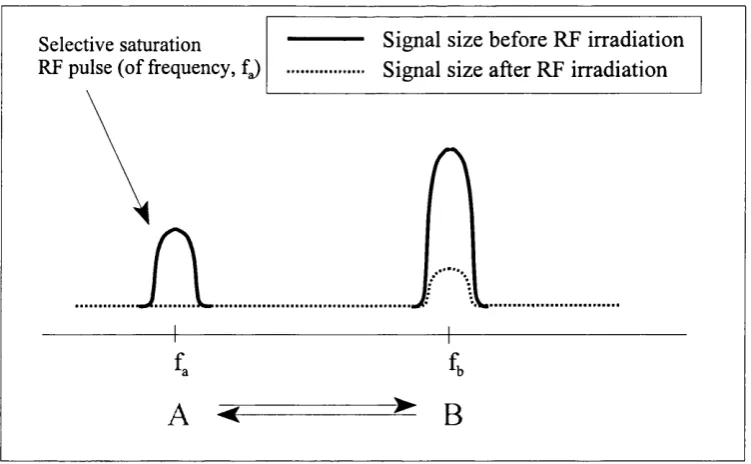
2.16 Saturation transfer experiment showing the effect o f saturating one o f 2 pools (spin pool A) within a chemically exchanging system (modified from Balaban and Ceckler ( 1992)).
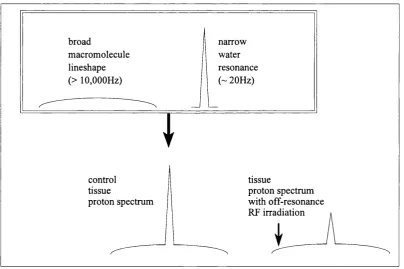
2.17 Diagram showing the individual lineshapes associated with the maeromolecular and free water proton pools and how these differences may be exploited to result in selective
saturation with a consequent reduction in the free w ater signal using off-resonance RF
irradiation.
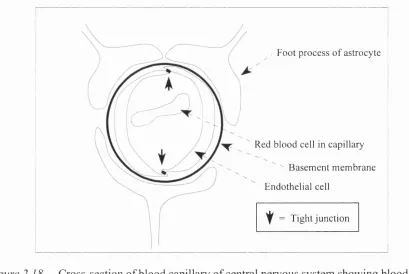
2.18 Cross-section o f blood capillary o f central nervous system showing blood-brain barrier to be comprised o f endothelial cells with tight junctions between, basement membrane
and astrocyte foot processes.
3.1 Phantom experiment to help determine the effect o f B, inhomogeneity on MTR measurement in a standard imaging headcoil. The diagram portrays a number o f separate
data acquisitions where the phantom remains in the same place in the magnet and the
headoil by 1 cm into the scanner at each acquisition.
3.2 Phantom data is presented for 2 separate bovalbumin phantoms o f differing concentration (PH ANT 1 and PH ANT 2). The MTR is shown with respect to the distance from the
caudal end o f the headcoil, while the headcoil is gradually moved with respect to the
“fixed” magnet and phantom. 95% confidence intervals are shown for figures derived
from the centre o f the coil for comparison.
3.3 In vivo experiment to help determine the effect o f B, inhomogeneity on MTR measurement in a standard imaging headcoil. The diagram portrays 2 separate data
acquisitions where the head remains in the same place in the magnet and the headoil by
7cm into the scanner at the second acquisition.
3.4 In vivo data is presented to show the effect o f a 7cm rostral headcoil shift on M TR measurements within similar brain regions. Findings are in keeping with the phantom
data in Figure 3.3, showing increasing inhomogeneity for M TR measurements within
regions o f interest placed caudally in the headcoil.
3.5 Quality control data for M TR measurements derived from 20% gelatin phantoms over six months. The inaccuracy o f repeated measurements was realised to be secondary to
“transmitter gain” fluctuations (i.e. flip angle calibration) and these were a result o f poor
auto prescan function with too small a figure used for the weight input.
4.1 Calculated M TR images showing regions o f interest for mean M TR measurement.
in the basis pontis (T2-weighted hyperintense, T 1 -weighted hypointense). The rim o f the
lesion appears o f normal signal. On T2-weighted MRI, the lesion appears homogenous.
On T 1 -weighted MRI, partial sparing of the corticospinal tracts is observed. Proton MRS
from the lesion shows NAA reduction and elevated free lipid peaks.
5.2 Calculated MTR image showing appearances o f the lesion within the basis pontis. A profile o f M TR values across the lesion is shown, showing maximal M TR reduction in
the lesion centre, relative sparing o f MTR within the descending corticospinal tracts,
radial increase in values from the centre o f the lesion and normal values in the outer rim
surrounding the lesion.
5.3 T2-weighted axial MRI and calculated MTR images showing appearances o f a symmetrical trident-shaped lesion confined to the basis pontis, surrounded by a rim of
tissue with normal T2-weighted signal intensity and M TR values. Recovery is seen
between the studies performed at 3 and 29 months, with shrinkage o f the lesion,
decreased T2 hyperintensity, and recovery o f MTR values. Proton MRS at 29 months
showed normal NAA.
5.4 (a) proton MRS demonstrating normal lesion NAA 29 months after onset o f CPM, (b) proton MRS from the basis pontis o f a healthy control subject.
5.5 Proton density, T2-weighted, and calculated MTR images depicting a symmetrical, trident-shaped lesion in the basis pontis surrounded by rim o f tissue with normal signal
characteristics, compatible with central pontine myelinolysis.
5.6 M TR profile o f CPM lesion, demonstrating maximal reduction in lesion centre (where pixels with M TR values o f 0 pu are observed) with radial increase to normal values at
lesion edge, (a) right-left profile, (b) antero-posterior profile.
5.7 Proton MRS demonstrating normal NAA in an acute CPM lesion, 1 week after onset o f neurological disturbance. In the same lesion, mean M TR was 10.6 pu (normal range =
36.5 - 40.9 pu).
6.1 Change in lesion MTR relative to initial enhancement. Mean lesion M TR (pu) is shown for all lesions greater than 20 mm^. Time is shown in weeks, week 0 representing the
time o f initial documented enhancement.
6.2 Images showing the initial appearances o f a large new enhancing lesion: (a) Post gadolinium Tl-w eighted image showing a new lesion with focal enhancement, (b) Post
ring-enhancement, (c) T2-weighted image corresponding to onset o f ring-enhancing
appearance, (d) Calculated MTR image corresponding to onset o f ring-enhancing
appearance.
6.3 Change in M TR in the central region and peripheral rim during the initiation and evolution o f a large ring-enhancing lesion.
6.4 Mean lesion MTR (pu) for all lesions greater than 45 mm^ (mean = 71.6 mm^), showing a greater decrease in MTR and more significant resolution than seen with smaller lesions.
6.5 Scatter plot showing the relation between the duration o f gadolinium enhancement and maximal lesion MTR reduction (SRCC=0.52, p=0.008).
6.6 Scatter plot showing the relation between maximal lesion area (as seen on the series o f proton density-weighted images) and maximal M TR reduction (SRCC=0.41, p=0.04).
7.1 Calculated M TR image o f the cervical spinal cord, with superimposed elliptical region o f interest above the C2/3 intervertébral disc.
7.2 Mean cervical cord MTR measurements in MS patients and controls (expressed as median value, interquartile range and overall range o f values).
8.1 The individual and combined effects o f Gd-DTPA dose, delay and MT contrast on detection o f enhancing lesions in 31 patients who underwent the complete protocol. The
dose o f Gd-DTPA is in mmol/kg and the time o f image acquisition following contrast
injection is as follows: early: 0-20 minutes, early delay: 20-40 minutes, and late delay:
40-60 minutes following contrast administration.
8.2 Contrast-enhanced Tl-w eighted images from a patient with secondary progressive MS, showing differences in enhancing lesion conspicuity with Gd-DTPA dose and MT. All
post-contrast images were obtained within 20 minutes o f Gd-DTPA administration.
Pre-contrast images
(a) proton density, (b) T2-weighted,
(c) non-MT Tl-weighted, (d) MT Tl-w eighted
Post-contrast images
(e) 0.1 mmol/kg Gd-DTPA, (f) 0.1 mmol/kg Gd-DTPA and MT,
(g) 0.3mmol/kg Gd-DTPA, (h) 0.3mmol/kg Gd-DTPA and MT.
List of Tables
1.1 Primary disorders o f myelin affecting the central nervous system.
1.2 Schumacher Criteria for diagnosis o f multiple sclerosis [from Schumacher et al., 1965].
1.3 Poser Committee Criteria for diagnosis o f multiple sclerosis [from Poser et al., 1983].
1.4 Common neurological disorders that may cause CSF oligoclonal bands.
1.5 Differential diagnosis o f multiple sclerosis.
1.6 Common symptoms in multiple sclerosis (adapted from Poser et al., 1979).
1 .7 Commonly affected clinically eloquent sites o f the central nervous system in multiple sclerosis and their associated clinical features.
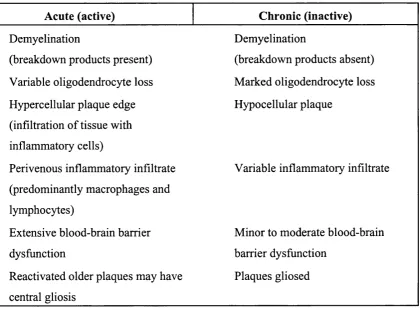
1.8 The pathological features o f acute and chronic lesions in multiple sclerosis.
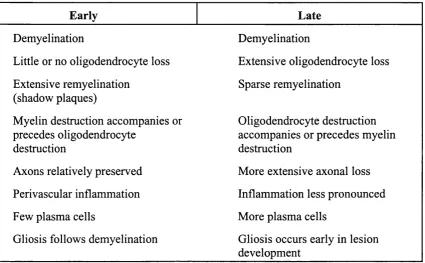
1.9 The features o f pathological lesions early and late in the course o f multiple sclerosis.
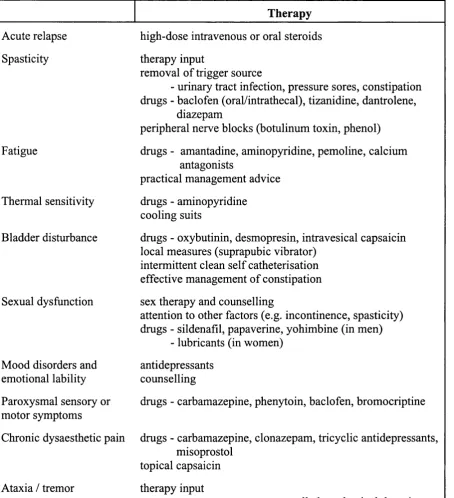
1.10 Therapeutic strategies to alleviate symptoms and optimise function.
2.1 Mean time spent in years at a given point o f the DSS for patients who later progress to the next level.
3.1 Quality assurance data for phantoms.
3.2 Quality assurance data for healthy controls. The median coefficient o f variation for each time point compared with baseline was compared with that for scan-rescan* to determine
whether scanner performance varied over time.
4.1 Regional variation o f M TR measurement in normal brain white matter.
4.2 Effect o f gender on regional MTR measurements.
4.3 Interhemispheric variation o f white matter M TR values in all 41 healthy control subjects.
4.4 Interhemispheric variation o f white matter MTR values in the 35 right handed subjects studied.
4.5 Interhemispheric variation o f white matter MTR values in the 5 left handed subjects studied.
4.6 Effect o f age on white matter MTR measurements.
4.7 Correlation between white matter M TR and subject age.
5.1 MTR and proton MRS data from three patients with central pontine myelinolysis.
7.1 Cervical cord mean MTR, EDSS, disease subgroup and T2 appearances in patients.
8.2 Effect o f Gd-DTPA dose (total number o f enhancing lesions detected within 20 minutes o f 0.1 mmol/kg and 0.3mmol/kg bolus doses).
8.3 Combined effect o f MT presaturation and early delayed imaging following single-dose Gd-DTPA.
8.4 Combined effect o f MT presaturation and early delayed imaging following triple-dose Gd-DTPA.
8.5 Combined effect o f MT presaturation, early delay and triple-dose Gd-DTPA. P. 1 Demographic data
9.2 MRI lesion activity summary for individual patients.
9.3 Statistical power calculations for the parallel groups trial design. [Based on a 6 month study using monthly MRI comparing a placebo versus active treatment group. The
treatment effect (percentage reduction in new enhancing lesions) is in the left hand
column. The sample size is the top row o f each table (in bold). A power o f more than
80% is generally considered adequate for determining the sample size required to show
a particular treatment effect].
9.4 Statistical power calculations for the cross over trial design [Based on a 6 month study using monthly MRI comparing 3 months run in (untreated) followed by 3 months o f
active treatment. The treatment effect (percentage reduction in new enhancing lesions)
is in the left hand column. The sample size is the top row o f each table (in bold). A power
o f more than 80% is generally considered adequate for determining the sample size
List of Abbreviations
BBB blood-brain barrier MIP macrophage inflammatory
CADASIL cerebral autosomal dominant protein
arteriopathy with subcortical MMP matrix metalloproteinase
infarcts MOG m yelin oligodendrocyte
CNS central nervous system protein
CPM central pontine myelinolysis MRI magnetic resonance imaging
CPMG Carr-Purcell-Meiboom-Gill MRS m a g n e t i c r e s o n a n c e
CSF cerebrospinal fluid spectroscopy
CT computerised tomography MS multiple sclerosis
DNA deoxyribonucleic acid MT magnetization transfer
DTPA d i e t h y l e n e MT C m a g n e tiz a tio n tra n s fe r
triaminepentaacetic acid contrast
EAE e x p e r im e n ta l a lle r g ic MTR magnetization transfer ratio
encephalomyelitis NA N-acetyl groups
EDSS expanded disability status NAA N-acetyl aspartate
scale PGA principal component analysis
ETE echo train length PD proton density
foff frequency offset PEP proteolipid protein
FLAIR fluid attenuated inversion PME p ro g re s s iv e m u ltifo c a l
recovery leukoencephalopathy
FSE fast spin echo PP primary progressive
Gd-DTPA gadopentate dimeglumine RF radiofrequency pulse
GRE gradient echo RNA ribonucleic acid
HIV human immunodeficiency RR relapsing-remitting
virus SAR specific absorption rate
HTLV-1 human T lymphotropic virus SE spin echo
IFN interferon SP secondary progressive
IE interleukin SPM s t a t i s t i c a l p a r a m e tr ic
IR inversion recovery mapping
NMR nuclear magnetic resonance SRCC S p e a r m a n ’ s R a n k
MAG m y e l i n - a s s o c i a t e d Correlation Coefficient
glycoprotein STIR short tau inversion recovery
MBP myelin basic protein TCR T-cell receptor
MEEAS m i t o c h o n d r i a l TE echo time
encephalomyelopathy with
TEef
effective echo timelactic acidosis and stroke TGF transforming growth factor
like episodes Tl inversion time
MERRF myoclonic epilepsy with TNF tumour necrosis factor
ragged-red fibres TR repetition time
MHC m ajor histocom patibility
List of Publications
NC Silver, GJ Barker, DO MacManus, JW Thorpe, RS Howard, DH Miller.
Decreased magnetisation transfer ratio due to demyelination: A case o f central pontine
myelinolysis.
J Neurol Neurosurg Psych 1996:61:208-209.
NC Silver, CD Good, GJ Barker, DG MacManus, AJ Thompson, IF Moseley, WI McDonald,
DH Miller.
Sensitivity o f contrast enhanced MRI in multiple sclerosis: effects o f gadolinium dose,
magnetisation transfer contrast and delayed imaging.
Brain 1997:120:1149-1161.
NC Silver, GJ Barker, NA Losseff, ML Gawne-Caine, DG MacManus, AJ Thompson, DH
Miller.
Magnetisation transfer ratio measurement in the cervical spinal cord: a preliminary study in
multiple sclerosis.
Neuroradiology 1997;39:441-445.
NC Silver, GJ Barker, DG MacManus, PS Tofts, DH Miller.
Magnetisation transfer ratio o f normal brain white matter: a normative database spanning four
decades o f life.
J Neurol Neurosurg Psych 1997;62:223-228.
NC Silver, RA Barker, DG MacManus, GJ Barker, M Thom, DCT Thomas, DH Miller.
Proton magnetic resonance spectroscopy in a pathologically confirmed acute demyelinating
lesion.
Journal o f Neurology 1997;244:204-207.
NC Silver, M Lai, M R Symms, GJ Barker, WI McDonald, DH Miller.
Serial magnetization transfer imaging to characterize the early evolution o f new MS lesions.
M Filippi, NC Silver, TA Yousry, DH Miller.
Newer magnetic resonance techniques and disease activity in multiple sclerosis: new concepts
and new concerns.
Multiple Sclerosis 1998;4:469-470
NC Silver, GJ Barker, DH Miller.
Standardization o f magnetization transfer imaging for multicenter studies.
Neurology 1999;53 95Suppl 3):S33-39 (review).
NC Silver, M Lai, MR Symms, GJ Barker, WI McDonald, DH Miller.
Serial gadolinium-enhanced and magnetization transfer imaging to investigate the relation
between the duration o f blood-brain barrier disruption and extent o f demyelination in new
multiple sclerosis lesions.
J Neurol 1999;246:728-730.
CA Davie, NC Silver, GJ Barker, PS Tofts, AJ Thompson, WI McDonald, DH Miller.
Does the extent o f axon loss and demyelination from chronic lesions in multiple sclerosis
correlate with the clinical subgroup?
J Neurol Neurosurg Psychiatry 1999;67;710-715.
Silver NC, Good CD, Sormani MP, MacManus DG, Thompson AJ, Filippi M, Miller DH.
An optimised protocol for detection o f enhancing brain and spinal cord lesions in MS.
PART ONE
CHAPTER 1
Introduction
1.1 Personal and social cost implications o f multiple sclerosis
It is estimated that there are 87,000 people in the United Kingdom with multiple sclerosis
(MS) [Holmes et al., 1995]. Although it may appear at any age, MS most commonly presents in early adult life. As such, MS represents a signifieant cause o f personal morbidity with
implications for both immediate family and society. For an affected individual, MS may have
widespread impact on physical, cognitive, emotional and social functions, thereby limiting
normal activity.
Life expectancy is only slightly reduced in MS, by approximately six to seven years
[Sadovnick et a l, 1992]. This study showed disability to be the greatest risk factor for death, with pneumonia as a common immediate cause. Suicide represented a significant cause o f death,
especially in the less disabled patients - overall rates approached seven and a h alf times that o f
the general healthy age- and sex-matched population.
Community based studies suggest that approximately 50% o f patients will require
assistance for mobility within 15 years o f onset [Weinshenker et al., 1989]. There is great variability o f disease expression. Indeed, people have been recognised where the disease only
manifested itself at post-mortem [Mackay et al., 1967; Ghatak and Hirano, 1974]. As MS may affect all parts o f the central nervous system (CNS), the range o f possible physical symptoms is
extensive. Often affected are vision, sensation, power, coordination and balance. Common
distressing symptoms include fatigue, spasm, pain, sleep disorder and sexual dysfunction.
In addition to physical disability, more than 40% o f community based patients show
evidence o f cognitive impairment on formal neuropsychological testing [Rao, 1997]. Cognitive
impairment may result in unemployment, social dysfunction and loss o f independence [Rao et a l, 1991].
It has long been realised since Charcot’s early descriptions o f the disease that psychiatric
abnormalities as well as cognitive impairment occur as part o f MS. Studies from the early 20^
(a prevailing mood o f serenity and cheerfulness), eutonia (a sense o f physical wellbeing) and
disorders o f emotional expression [Cottrell and Wilson 1926]. Although more recent studies with
improved methodology have shown a lower incidence o f psychiatric morbidity, depression is still
very common, with a prevalence o f 40-45% [Ron and Logsdail 1989]. When compared with
other (non-cerebral) neurological and rheumatological causes o f disability, the prevalence o f
depression appears much higher; while cerebral involvement may contribute, it may also reflect
the reaction to a disease which has a major adverse impact on activities o f daily living and
quality o f life [Ron and Logsdail 1989].
A recent community-based study in the United Kingdom (UK) looked at data gathered
from a questionnaire circulated to 999 people with MS, o f which 672 subjects (67%) responded
[Holmes et al., 1995]. This broadly stratified subjects according to mobility into 3 groups: (A) ambulatory, (B) requiring unilateral support for ambulation, and (C) wheelchair-dependent. The
annual per capita cost to the NHS was £350 (group A), £650 (group B), and £4000 (group C).
The total UK annual cost from MS was £1.2 billion, with little more than 12% o f this (£153
million) spent in the National Health Service (NHS). The NHS expenditure on MS amounted to
less than 2% o f total NHS expenditure. The major financial burden o f £536 million per year was
borne by individuals and families living with MS, with the greatest single loss being foregone
earnings o f more than £395 million per year. Individuals were also shown to bear a heavy cost
o f £ 140 million for expenses which include child care, house alterations, and purchase o f special
equipment and supplies. State costs (in financial benefits and lost tax revenue) were £435 million
per year and industrial costs amounted to over £76 million per year (including absence from work
by family carers).
1.2 Background
The cause or causes o f the clinical condition termed MS remain uncertain. Basic
observations that allow insight into the mechanisms o f pathological evolution and symptom
production / resolution are therefore very important in helping our understanding o f the
condition. Such observations can help distinguish the features o f the disease that are responsible
for its diverse clinical manifestations. In turn, increased knowledge may improve our ability to
prevent or slow the disease process using therapeutic strategies that selectively target the
This thesis describes work using magnetic resonance imaging (MRI), a technique that
may help to characterise and quantify changes in the CNS responsible for the clinical
manifestations o f the disease. Because it is safe and essentially non-invasive, MRI is ideally
situated to allow repeated snapshots into the natural history o f MS.
While clinical outcome measures remain the gold standard for determining therapeutic
response in clinical trials, they are hampered by difficulties associated with the diversity o f the
disease process and the protean problems associated with disability scales, namely poor
responsiveness, poor reproducibility [Frances et al., 1991], and a tendency to be affected by day to day fluctuations in function [W hittaker et a l, 1995]. As such, definitive clinical therapeutic trials in MS require large patient numbers and a long study duration, thereby requiring major
expenditure and resources. It is therefore not surprising that considerable interest exists in the use
o f quantitative MRI outcome measures for therapeutic trials [Miller et al., 1996]. However, it is also recognised that MRI techniques in current routine clinical use have poor ability to predict
clinical outcome. There is therefore demand for sensitive and reproducible quantitative MRI
measures that are able to assess global pathological changes in the CNS with greater pathological
specificity.
MRI has greatly contributed to our understanding o f MS and there is rapid development
in this field. Early studies concentrated on the visible focal abnormalities (i.e. lesions) [Young
et al., 1981] and correlated these with underlying pathological abnormalities [Stewart et al.,
1984; Ormerod et al., 1987; Neweombe et a l, 1991]. The use o f conventional cranial MRI to detect lesions is useful for clinical diagnosis [Poser et al., 1983] and for prediction o f those patients with clinically isolated syndromes who will go on to develop definite MS [Lee et al.,
1991; Morrissey et al., 1993; O ’Riordan et al., 1998]. The relation o f lesion evolution, as described by conventional non-enhanced MRI, to mechanisms o f disability and recovery appears
more complex and is at best limited [Koopmans et ah, 1989; M iller era/., 1996]. Reasons for this include (1) difficulties associated with both clinical and MRI measurements, (2) the inability o f
conventional qualitative MRI to differentiate the pathological substrates o f lesions (e.g. oedema,
demyelination, axonal loss, gliosis), (3) lesions will exert different clinical effects according to
anatomical localization, (4) invisible pathology in the normal-appearing white matter also
contributes to disability, and (5) conventional MRI detects changes in structure rather than
functional change (e.g. due to the metabolic environment, brain plasticity or sodium channel
magnetization transfer, proton spectroscopy, diffusion, and functional imaging show promise to
help discriminate the relevant pathological substrates o f clinical impairment and recovery.
Unlike all other MRI techniques, magnetization transfer (MT) imaging utilises the
interaction between “free” water protons and those “bound” to maeromolecular structures. This
provides a novel form o f tissue contrast that may be utilised either in a quantitative manner to
assess the structural elements o f tissue (e.g. measurement o f the M T effect with magnetization
transfer ratio (MTR)), or qualitatively to improve discrimination between different tissue
components (i.e. magnetization transfer contrast (MTC)).
1.3 Aims
In this thesis, I explore the potential application o f MT imaging to investigation o f the
underlying pathogenetic basis o f MS and determine how MT imaging may be utilised to help
monitor the natural history o f the disease or its response to therapy.
For successful implementation o f MT imaging techniques into clinical and research
practice, issues related to quality assurance and standardization first require consideration. Such
issues are discussed in chapter three and reference is made to original data.
In chapter four, a normative MTR database is established in healthy subjects to determine
the anatomical variation o f MTR within the normal brain and the variations that may arise as a
result o f age, gender or cerebral hemisphere dominance. To help evaluate the pathophysiological
substrates o f MTR measurement, in chapter five I investigate how M TR may be affected in
central pontine myelinolysis, a condition characterised by severe demyelination as the
predominant pathological abnormality. In chapter six, the natural history o f MTR within MR
visible lesions in MS is determined; regions o f normal-appearing white matter are assessed at
weekly intervals during their evolution into new and visible MS lesions. In chapter seven, MT
imaging is successfully implemented to study the cervical spinal cord. A preliminary
investigation is performed to compare MTR values in MS with those o f healthy control subjects.
The role for further studies in this clinically eloquent CNS site is determined.
In chapter eight, I investigate MTC as a method to optimise enhancing lesion conspicuity
with gadolinium contrast-enhanced MRI. Comparison is made with two other potential
optimization techniques, the use o f a larger (triple) dose o f gadolinium and delayed imaging.
determine disease activity in longitudinal imaging studies. In particular, their potential ability to
simplify exploratory treatment trials in MS is explored.
1.4 Multiple Sclerosis
1.4.1 Clinical background and definitions
Multiple sclerosis is an acquired primary demyelinating disease o f the CNS in which
myelin is a main target o f autoimmune inflammatory processes. The condition is typically
characterised by multifocal episodic disturbances o f CNS function, resulting in lesions that are
o f varied age and differing anatomical location. In this thesis, the terms “lesion” and “plaque”
are used interchangeably.
Traditionally, MS has been referred to as a primary demyelinating condition. This is
because (i) the disruption and loss o f normal myelin is an acquired process and not due to
abnormal myelinogenesis (i.e. dysmyelination), and (ii) demyelination has been considered as
an event that is not dependent on axonal damage. However, it is increasingly recognised that
axonal damage may represent an important feature o f acute lesions [Trapp et al., 1998] early in the disease and play an important role in the development o f persistent and progressive disability.
Multiple sclerosis is just one o f a number o f prim ary demyelinating conditions o f the
CNS [Table 1.1].
1.4.2 Diagnosis
The diagnosis o f MS was previously made purely on clinical grounds. The ability to
accurately diagnose MS has become increasingly important as therapeutic options have become
more readily available. In addition, more accurate diagnosis has been made possible with the
development o f more sensitive paraclinical investigations to help support the diagnosis and
exclude alternative neurological conditions.
Diagnostic criteria. The first attempt at precision o f diagnosis came in the mid 1960's when the Schumacher committee established criteria with which to diagnose clinically definite
Acquired, inflammatory or infectious demyelinating conditions
Multiple sclerosis (acute, chronic, and variants): benign
relapsing-remitting (RR) secondary progressive (SP) primary progressive (PP) transitional
Marburg variant o f multiple sclerosis Subacute sclerosing panencephalitis
Acute disseminated encephalomyelitis Acute haemorrhagic leukoencephalopathy
Human immunodeficiency virus (HIV) encephalopathy Human immunodeficiency virus (HIV) vacuolar myelopathy HTLV-1 associated myelopathy (tropical spastic paraparesis) Progressive multifocal leukoencephalopathy (PML)
Monosymptomatic demyelinating syndromes
Optic neuritis
Acute transverse myelitis Sacral myeloradiculitis
Demyelinating disease with restricted distribution
Neuromyelitis optica (Devic’s syndrome) B alo’s concentric sclerosis (tumour-like)
Acquired toxic-metabolic disorders of myelin
Central pontine myelinolysis Machiafava Bignami syndrome
Vitamin B 12 deficiency (subacute combined degeneration) Hexachlorophene intoxication
Periventricular leukoencephalopathy (associated with anti-mitotic and radiotherapy) Heroin pyrolysate leukoencephalopathy
Traumatic disorders o f myelin
Trauma
Compression adjacent to tumour
Hereditary metabolic disorders o f myelin
Metachromatic leukodystrophy
Adrenoleukodystrophy, adrenomyeloneuropathy
Globoid cell leukodystrophy (Krabbe’s disease, galactosylceramide lipidosis) Spongiform leukodystrophy (Canavans disease)
Pelizaeus-Merzbacher disease
Dysmyelinogenetic lipodystrophy (Alexander disease)
Phenylketonuria___________________________________________________________
Neurological examination reveals objective abnormalities o f CNS function
Neurological history indicates involvement o f at least two CNS regions
CNS disease predominantly reflects white matter involvement
Involvement o f CNS follows one or two patterns
• two or more distinct episodes with significant symptoms, each o f at least 24 hours duration and 1 month apart
• slow or stepwise progression o f signs and symptoms in a disseminated pattern for at least 6 months
Patient 10-50 years old at onset
Symptoms and signs can not be better explained by an alternative disease process (diagnosis must be made by a competent clinician)_______________________________________________
Table 1.2 Schumacher Criteria for diagnosis o f multiple sclerosis [from Schumacher et al.,
1965].
These criteria recognised both relapsing-remitting and progressive forms o f the disease.
In 1983, Poser and colleagues modified these criteria to help identify those patients who could
be appropriately involved in research studies and clinical trials [Poser et al., 1983]. They expanded the age o f onset to 59 years and recognised the incorporation o f data derived from
laboratory investigations (evoked potentials and neuroimaging to show evidence for
dissemination in space and cerebrospinal fluid (CSF) analysis to confirm inflammatory reaction
localised to the CNS). The new criteria now included categories for Clinically Definite and
Laboratory Supported MS [Table 1.3].
All patients who have contributed data to the studies in this thesis have clinically definite
Category Attacks Clinical
evidence
Paraclinical
evidence
CSF
oligoclonal
bands
Clinically 2 2
definite MS 2 1 and 1
Clinically 2 1
probable MS 1 2
1 1 and 1
Laboratory 2 1 or 1 present
supported 1 2 present
definite MS 1 1 and 1 present
Laboratory 2 present
supported
probable MS
Table 1.3 Poser Committee Criteria for diagnosis o f multiple sclerosis [from Poser et a l,
1983].
Laboratory investigations. Although confirmation o f the diagnosis does not necessarily require evidence from investigations, it is usual for neurologists to undertake one or more tests.
Evoked potentials (visual, somatosensory and brainstem) were the first non-invasive
investigations available and their use became well-established during the 1970's. Visual evoked
potentials remain the most useful, particularly to document evidence o f previous optic neuritis
in patients who have no visual symptoms at time o f investigation.
During the past 15 years, M RI has become established in confirming the diagnosis o f MS
developed for the interpretation o f brain MRI. The first, devised by Paty and colleagues
recommended the presence o f four lesions, with three o f these in a periventricular location; while
sensitivity was relatively good (85%), specificity was shown to be less than 60% [Paty et ah,
1988]. The specificity o f diagnosis using MRI can be increased by requiring the presence o f an
ovoid lesion or (sub)callosal lesions. Fazekas and colleagues proposed that a brain MRI scan is
strongly suggestive o f MS when two o f three specified criteria (a periventricular lesion, a lesion
larger than 6mm., or an infratentorial lesion) are present [Fazekas et al., 1988]. A retrospective study showed these criteria to have high specificity (almost 100%) and sensitivity o f 88%
[Offenbacher et al., 1993]. Cerebral MRI may also offer a useful role for excluding alternative differential diagnoses (e.g. vascular disease, lymphoma, métastasés, vasculitis, granulomatous
disorders, adrenoleukodystrophy, acute disseminated encephalomyelitis). Spinal MRI may offer
useful additional information as lesions due to MS are commonly seen in the cervical spine and
alternative diagnoses may be excluded. Repeated brain MRI with or without gadolinium contrast-
enhanced T1-weighted images help show evidence o f dissemination in space and time, although
this approach is not generally employed unless diagnosis is difficult (e.g. differentiating MS from
acute disseminated encephalomyelitis).
Examination o f CSF provides the most persuasive evidence for an inflammatory immune
disease affecting the CNS. Changes that may be observed in MS include a mild increase in the
level o f cellular reaction or protein and an increase in the level o f immunoglobulin, the latter
having various methods for detection. The European consensus identified the presence o f
oligoclonal bands isolated to cerebrospinal fluid as the most useful indicator o f localised
inflammatory disease [Andersson et al., 1994]. Oligoclonal bands are present in over 90% o f patients with clinically definite MS, but are not specific to this condition and may be found in
a large number o f inflammatory and immune-mediated diseases o f the CNS, some o f which must
be considered in the differential diagnosis [Table 1.4]. Newer techniques for
immunoelectrophoresis may allow higher sensitivity and these include isoelectric focussing, the
Inflammatory disorders
multiple sclerosis
systemic lupus erythematosus primary Sjogren’s syndrome Behçet’s disease {rare)
polyarteritis nodosa
Infectious diseases
viral encephalitis (e.g. herpes simplex, human immunodeficiency virus) transverse myelitis
Lyme disease (neuroborreliosis) neurosyphilis
chronic fungal meningitis
subacute sclerosing panencephalitis progressive rubella panencephalitis
progressive multifocal leukoencephalopathy toxoplasmosis
cysticercosis trypanosomiasis
chronic fungal meningitis yaws
Granulomatous disease
sarcoidosis {rare)
Others {rare)
Guillain-Barré syndrome cerebrovascular disease
adrenoleukodystrophy (including adrenomyeloneuropathy) CNS lymphoma
cerebral neoplasia_______________________________________________
Table 1.4 Neurological disorders that may cause CSF oligoclonal bands.
A combination o f MRI and CSF oligoclonal bands can be used to virtually rule out MS
when both tests are negative, as their high sensitivities allow a high negative predictive value.
Particular care is required when imaging shows multifocal white matter lesions, but oligoclonal
bands are absent from the cerebrospinal fluid. Fieschi and colleagues extensively reinvestigated
18 such patients from a cohort o f 405 consecutive patients and found new diagnoses for six;
vasculitis in two, and one patient each with mitochondrial encephalomyelopathy with lactic
acidosis and stroke-like episodes (MELAS), atrial septal aneurysm with embolic cerebrovascular
Therefore, the presence o f positive oligoclonal bands help support the diagnosis, although their
presence is not specific to MS. W hen absent, this test alerts the clinician to the possibility o f
alternative diagnoses, although MS is not excluded [Zeman et al., 1996].
It should be remembered that, even with the diagnostic techniques available, the role o f
an experienced neurologist in diagnosis remains pivotal.
Differential diagnosis. A considerable number o f conditions may result in multifocal deficits o f the CNS and require consideration in the differential diagnosis o f MS. They include
inflammatory disorders, infectious diseases, post-infectious demyelinating conditions, inherited
disorders (of myelin and mitochondria), structural disorders, vitamin deficiencies, and toxic
disorders. They may be divided into those with a monophasic, multiphasic or progressive course
[Table 1.5].
Certain clinical features may be particularly helpful when reaching a diagnosis o f MS.
The majority o f patients present with one or more o f the signs o f optic neuritis, limb weakness,
paraesthesiae, diplopia, ataxia, vertigo and disturbance o f micturition. Certain symptoms are rare
in alternative diagnoses and these include (i) heat intolerance with or without precipitation o f
transient focal deficit (e.g. U hthoffs phenomenon), (ii) Lhermitte’s sign (transient electric shock
like feeling, tingling, or sensation o f vibration that travels down the back on neck flexion) in the
absence o f cervical disc herniation or cervical trauma, (iii) girdle-like dysaesthesias, and (iv)
certain paroxysmal symptoms (e.g. trigeminal neuralgia, tonic spasms, diplopia, neuralgic pain,
transient limb weakness, hemiataxia). Multiple sclerosis may occur at any age and may occur in
the presence o f a strong family history. However, it is very uncommon for MS to present in
childhood, over the age o f 60, or where there is a clear pattern o f inheritance. Patients with MS
rarely have rheumatological or constitutional symptoms; their occurrence, especially with
abnormal blood markers for disease such as positive autoantibodies should cause suspicion for
an alternative diagnosis. Certain clinical features may occur as a result o f MS but are rare at
presentation; these include aphasia, significant cognitive dysfunction, psychosis, and extreme
anxiety. Likewise, certain symptoms are recognised but rarely occur in the course o f MS; these
include hemianopic visual disturbance, movement disorders such as parkinsonism or dystonia,
M onophasic course
• acute disseminated encephalomyelitis (ADEM) • isolated optic neuritis
M ultiphasic course
• Inflammatory disorders
e.g. systemic lupus erythematosus, primary Sjogren’s syndrome, Behçet’s disease, polyarteritis nodosa, W hipple’s disease, isolated angiitis o f the CNS
• Granulomatous disorders
e.g. Sarcoidosis, W egener’s granulomatosis • Vascular disease
e.g. arteriovenous malformations, cerebral autosomal dominant arteriopathy with subcortical infarcts (CADASIL)
• Prothrombotic disorders
e.g. protein S deficiency, protein C deficiency, antithrombin III deficiency, antiphospholipid syndrome, thrombotic thrombocytopaenic purpura
• Infectious diseases
e.g. Lyme disease. Brucellosis • Structural disorders
e.g. Amold-Chiari malformation • Mitochondrial encephalomyopathies
e.g. mitochondrial encephalomyelopathy with lactic acidosis and stroke like episodes (MELAS), myoclonic epilepsy with ragged-red fibres (MERRF)
Progressive course
hereditary spastic paraparesis
Leber’s hereditary optic neuropathy (subacute, irreversible visual loss) B12 deficiency
tobacco-alcohol amblyopia
tropical spastic paraparesis (especially in patients o f Japanese or Caribbean origin)
adrenoleukodystrophy (including adrenomyeloneuropathy) progressive multifocal leukoencephalopathy (PML)
compressive lesion (e.g. disc herniation, rheumatoid spondylopathy, meningioma, neurofibroma, primary cerebral lymphoma, metastatic or primary maligant _____________ tumour)______________________________________________________________
1.4.3 Clinical manifestations
Presentation and disease course. Multiple sclerosis is classically characterised by a relapsing-remitting course due to lesions in many regions o f the CNS, with onset most common
in young adulthood and the development o f progressive disability occurring in the majority o f
patients at some stage.
Relapses are described as acute or subacute episodes o f neurological dysfunction that
usually reach a peak in a few days to weeks, followed by relatively little change, and finally
remission to a variable degree. Isolated or mixed motor or sensory symptoms are the most
frequent presenting features, with less involvement o f visual, cerebellar, and brain stem
structures. 85% o f patients commence with such a relapsing-remitting disease course [Runmarker and Andersen, 1993].
After this initial relapsing-remitting course, the majority o f patients will enter a
progressive phase o f the disease (50% within 10 years) [Runmarker and Andersen, 1993]. Such
patients are described as having a secondary progressive disease course and may, in addition to their disease progression, continue or cease to have superimposed relapses.
There is also a small group o f patients in whom the onset o f clinical disease is followed
by a progressive decline without remission or superimposed relapse. Such patients are often
described as having prim ary progressive MS and they account for approximately 10% o f cases [Runmarker and Andersen, 1993; Thompson et al, 1997]. In these patients, the condition often predominantly involves one part o f the CNS, and patients typically present at an older age than
those with relapsing-remitting onset; the commonest mode o f presentation is with a spastic
paraparesis, as opposed to the more common sensory and visual disturbances seen at presentation
in relapsing-remitting disease [Thompson et al, 1997]. In this thesis, patients have also been studied who have been classified as having a transitional disease course; in these cases, patients have had a primary progressive course with the addition o f a single relapse either prior to or
superimposed on their progressive course [Thompson et al, 1997].
The last subgroup o f patients with MS studied in this thesis are more difficult to
categorise and have been termed as having benign MS. For the purposes o f all work presented in this thesis, this refers to patients with a disease duration greater than or equal to 10 years who
have not developed significant disability, with a score o f 3 or less on K urtzke’s Expanded
Disability Status Scale [EDSS, Kurtzke, 1983]. Despite this relatively benign early course,
certain difficulties in evaluating research results in this group.
Clinical prognostic factors. There remains uncertainty about those factors that pose risk either for development o f MS, or for causing relapse or disease progression in established
disease.
The population that is at highest risk for development o f MS are women o f childbearing
age. Pregnancy has been shown to significantly reduce the frequency o f relapse (approximate
30% risk reduction), although this is counteracted by a similar increase in relapse rate in the early
puerperium [Confavreux et al., 1998]. However, pregnancy is not thought to have an overall bearing on long term prognosis.
For a long time, infection has been implicated in the pathogenesis o f MS; indeed, this
represented the original rationale behind the use o f interferons in MS, although their mechanism
o f action is now thought to be independent o f infection prevention. Several prospective studies
have suggested a correlation between relapse and common infections, especially minor infections
o f the upper respiratory tract or chronic sinusitis [Sibley et al., 1985; Gay et al., 1986]. Mechanisms whereby MS activity may be precipitated by infections include the host production
o f y-interferon [Panitch et al., 1987].
Other proposed précipitants o f relapse in MS have included immunization, trauma,
exposure to general anaesthetic agents, and stress. In many cases, data is not definitive and can
not rule out such associations, although the accumulated evidence to date does not convincingly
support such hypotheses.
Studies have addressed the relation between demographic and clinical features o f the
disease. It is generally agreed that certain features are associated with more favourable outcome
and these include: younger age at onset, female gender, onset with purely sensory symptoms or
optic neuritis, complete remission from first episode, low attack frequency and long interval
between first and second episodes. Conversely, a poorer outcome may be associated with disease
presentation at an older age (>40 years), male gender, prominent cerebellar component, insidious
pyramidal involvement, high attack frequency, and early fixed disability [Weinshenker and Ebers
1987; W einshenker et al., 1991a; Runmarker et al., 1994; W einshenker 1995].
For clinically isolated syndromes suggestive o f MS (isolated optic neuritis, acute partial myelitis,
or acute brain stem syndromes suggestive o f demyelination), MRI has some predictive role.
Approximately 50-70% o f such patients will have asymptomatic white matter lesions on MRI
[Miller, 1997]. The risk o f conversion to clinically definite MS is low where no asymptomatic
lesions are seen, whereas multiple asymptomatic lesions increase both the risk o f conversion to
MS and also for greater disability at 10 years [O’Riordan et <2/.,1998].
In established MS, the predictive value o f MRI for future clinical disability has so far
been limited by the disappointingly poor correlations between lesions (as demonstrated on
conventional T2-weighted sequences) and clinical features [Miller, 1997].
Cerebrospinal fluid may also yield prognostic information. A long term study by
Sandberg-Wollheim and colleagues in acute optic neuritis demonstrated a low probability o f
remaining free o f neurological symptoms 18 years later if cerebrospinal fluid abnormalities were
noted at presentation [Sandberg-Wollheim et a l, 1990].
However, despite data from large natural history studies and the appearance o f new or
improved techniques to provide in vivo markers o f disease, it remains impossible to provide an
accurate prognosis for individual patients with MS.
Clinical features and disability. One o f the outstanding characteristics o f MS is its variability, both between individuals and in the same individuals over time. Early in the disease,
relapses commonly are followed by complete remission, although this is not invariable. Later in
the course o f the disease, incomplete recovery or disease progression are more usual, with
gradual accumulation o f neurological impairment. The most common deficits associated with
MS are listed in Table 1.6.
Presentation * During disease course*
visual /oculomotor 49 70-80
paresis 43 88
paraesthesiae 41 87
incoordination 23 82
bladder/bowel 10 63
cerebral 4 39
* expressed as a p erc e n ta g e (the total is g rea ter than 100% , a llo w in g fo r m ultiple sym ptom s a t presen tation )
There are certain clinically eloquent sites o f the CNS that are preferentially affected by
MS, thereby resulting in certain common symptoms [Table 1.7]. Other clinical features m aybe
more difficult to clearly associate with individual affected sites o f the CNS, especially where
lesions are located within the cerebral hemispheres (e.g. cognitive impairment, depression,
fatigue, sleep disturbance, movement disorders). Discrete hemisphere cortical lesions may rarely
give rise to clearly associated symptoms (e.g. epilepsy, dysphasia).
A detailed account o f disability and impairment in MS, in particular focussing on the
problems associated with their measurement, is given in chapter two.
Region Clinical features
Optic nerve optic neuritis (blurred vision, scotoma, pain)
Spinal cord paraesthesiae, numbness, weakness, spasticity, disturbance
o f bladder / bowel function, impotence, Lherm itte’s
phenomenon
Brainstem vertigo, diplopia, oscillopsia, dysphagia, incoordination.
trigeminal neuralgia
Cerebellum ataxia
Table 1.7 Commonly affected clinically eloquent sites o f the central nervous system in multiple sclerosis and their associated clinical features.
1.4.4 Aetiology
The cause o f MS remains undetermined. Epidemiological studies have however provided
some insight.
The prevalence o f MS varies across the world. It appears to be influenced by a complex
interaction o f ethnic background and geographical position. In general, prevalence increases with
increasing distance from the equator (<1 per 100,000 in equatorial regions, 6-14 per 100,000 in
southern United States and southern Europe, 30-80 per 100,000 in parts o f northern Europe and
northern United States, and >100 per 100,000 in the United Kingdom and Canada), thus