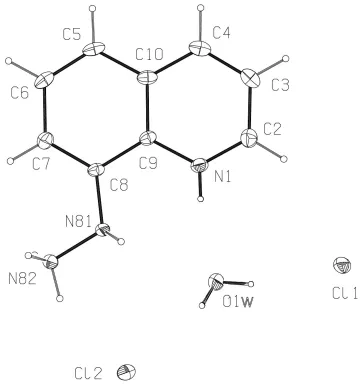
• No results found

8 Hydrazino­quinoline di­hydro­chloride hydrate

N/A
N/A
Protected

Academic year: 2020

Share "8 Hydrazino­quinoline di­hydro­chloride hydrate"

Copied!
7
0
0

Loading.... (view fulltext now)

Full text

(1)

organic papers

o1070

Daniel E. Lynchet al. C9H11N3H2O2Cl DOI: 10.1107/S1600536802015878 Acta Cryst.(2002). E58, o1070±o1071

Acta Crystallographica Section E Structure Reports

Online

ISSN 1600-5368

8-Hydrazinoquinoline dihydrochloride

hydrate

Daniel E. Lyncha* and Ian McClenaghanb

aSchool of Science and the Environment,

Coventry University, Coventry CV1 5FB, United Kingdom, andbKey Organics Ltd, Highfield Industrial Estate, Camelford, Cornwall PL32 9QZ, United Kingdom

Correspondence e-mail: apx106@coventry.ac.uk

Key indicators Single-crystal X-ray study

T= 150 K

Mean(C±C) = 0.002 AÊ

Rfactor = 0.038

wRfactor = 0.104

Data-to-parameter ratio = 15.0

For details of how these key indicators were automatically derived from the article, see http://journals.iucr.org/e.

#2002 International Union of Crystallography Printed in Great Britain ± all rights reserved

The structure of the title compound, C9H11N32ClH2O,

comprises a planar cation containing two quaternary N atoms, packed in the solid-state with two Clÿ anions and one water

molecule. Each component is involved in the hydrogen-bonding network, with one Clÿ anion and the O atom both

being involved in three-centre associations, while the second Clÿanion is involved in a four-centre association.

Experimental

The title compound was obtained from Key Organics Ltd and crystals were grown from ethanol solution.

Crystal data

C9H11N3ÿ2ClÿH2O

Mr= 250.12

Triclinic,P1 a= 6.9716 (14) AÊ b= 8.9866 (18) AÊ c= 9.986 (2) AÊ

= 70.04 (3) = 89.20 (3) = 69.60 (3)

V= 547.2 (3) AÊ3

Z= 2

Dx= 1.518 Mg mÿ3

MoKradiation Cell parameters from 3835

re¯ections

= 2.9±27.5 = 0.57 mmÿ1

T= 150 (2) K Plate, colourless 0.400.300.10 mm

Data collection

Bruker±Nonius KappaCCD area-detector diffractometer

'and!scans

Absorption correction: multi-scan (SORTAV; Blessing, 1995) Tmin= 0.804,Tmax= 0.945

7519 measured re¯ections

2465 independent re¯ections 2168 re¯ections withI> 2(I) Rint= 0.075

max= 27.5

h=ÿ9!9 k=ÿ11!11 l=ÿ12!12

Re®nement

Re®nement onF2

R[F2> 2(F2)] = 0.038

wR(F2) = 0.104

S= 1.04 2465 re¯ections 164 parameters

H atoms treated by a mixture of independent and constrained re®nement

w= 1/[2(F

o2) + (0.0551P)2

+ 0.1837P]

whereP= (Fo2+ 2Fc2)/3

(/)max< 0.001

max= 0.32 e AÊÿ3

min=ÿ0.60 e AÊÿ3

(2)

Table 1

Hydrogen-bonding geometry (AÊ,).

DÐH A DÐH H A D A DÐH A

N1ÐH1 O1Wi 0.78 (2) 2.05 (2) 2.817 (2) 165 (2)

N81ÐH81 Cl1ii 0.91 (2) 2.32 (2) 3.1983 (16) 164.5 (18)

N82ÐH82 Cl2ii 0.91 (2) 2.25 (2) 3.1476 (18) 169.8 (18)

N82ÐH83 O1Wiii 0.87 (2) 1.94 (2) 2.808 (2) 178.7 (19)

N82ÐH84 Cl2iv 0.89 (3) 2.39 (3) 3.1805 (17) 149.1 (19)

O1WÐH1W Cl1v 0.84 (3) 2.21 (3) 3.0348 (17) 164 (2)

O1WÐH2W Cl2iii 0.76 (3) 2.47 (3) 3.180 (2) 158 (2)

Symmetry codes: (i)x;y;zÿ1; (ii)xÿ1;y;z; (iii)ÿx;1ÿy;1ÿz; (iv)ÿx;1ÿy;ÿz; (v) 1ÿx;ÿy;1ÿz.

All aromatic H atoms were included in the re®nement, at calcu-lated positions, as riding models with CÐH set to 0.95 AÊ. All H atoms involved in the hydrogen-bonding network were located in difference syntheses and both positional and displacement parameters were re®ned.

Data collection: DENZO (Otwinowski & Minor, 1997) and

COLLECT(Hooft, 1998); cell re®nement:DENZOandCOLLECT; data reduction:DENZOandCOLLECT; program(s) used to solve structure:SHELXS97 (Sheldrick, 1997); program(s) used to re®ne structure: SHELXL97 (Sheldrick, 1997); molecular graphics:

PLATON-97 (Spek, 1997); software used to prepare material for publication:SHELXL97.

The authors thank the EPSRC National Crystallography Service (Southampton).

References

Blessing, R. H. (1995).Acta Cryst.A51, 33±37.

Hooft, R. (1998).COLLECT. Nonius BV, Delft, The Netherlands.

Otwinowski, Z. & Minor, W. (1997). Methods in Enzymology, Vol. 276, Macromolecular Crystallography, Part A, edited by C. W. Carter Jr and R. M. Sweet, pp. 307±326. London: Academic Press.

Sheldrick, G. M. (1997). SHELXS97 and SHELXL97. University of GoÈttingen, Germany.

Spek, A. L. (1997).PLATON-97. Version of May 1997. University of Utrecht, The Netherlands.

Figure 1

(3)

supporting information

sup-1

Acta Cryst. (2002). E58, o1070–o1071

supporting information

Acta Cryst. (2002). E58, o1070–o1071 [doi:10.1107/S1600536802015878]

8-Hydrazinoquinoline dihydrochloride hydrate

Daniel E. Lynch and Ian McClenaghan

S1. Comment

no comment

S2. Experimental

The title compound was obtained from Key Organics Ltd and crystals were grown from ethanol solution.

S3. Refinement

All aromatic H atoms were included in the refinement, at calculated positions, as riding models with C—H set to 0.95 Å.

All H atoms involved in the hydrogen-bonding network were located on difference syntheses and both positional and

(4)
[image:4.610.124.488.68.458.2]

Figure 1

Molecular configuration and atom-numbering scheme for the title compound, showing 50% probability ellipsoids.

8-Hydrazinoquinoline dihydrochloride hydrate

Crystal data

C9H11N3·H2O·2Cl

Mr = 250.12

Triclinic, P1 Hall symbol: -P 1

a = 6.9716 (14) Å

b = 8.9866 (18) Å

c = 9.986 (2) Å

α = 70.04 (3)°

β = 89.20 (3)°

γ = 69.60 (3)°

V = 547.2 (3) Å3

Z = 2

F(000) = 260

Dx = 1.518 Mg m−3

Mo radiation, λ = 0.71073 Å Cell parameters from 3835 reflections

θ = 2.9–27.5°

µ = 0.57 mm−1

(5)

supporting information

sup-3

Acta Cryst. (2002). E58, o1070–o1071

Data collection

Bruker-Nonius KappaCCD area-detector diffractometer

Radiation source: Bruker Nonius FR591 rotating-anode

Graphite monochromator

Detector resolution: 9.091 pixels mm-1

φ and ω scans

Absorption correction: multi-scan (SORTAV; Blessing, 1995)

Tmin = 0.804, Tmax = 0.945 7519 measured reflections 2465 independent reflections 2168 reflections with I > 2σ(I)

Rint = 0.075

θmax = 27.5°, θmin = 3.1°

h = −9→9

k = −11→11

l = −12→12

Refinement

Refinement on F2 Least-squares matrix: full

R[F2 > 2σ(F2)] = 0.038

wR(F2) = 0.104

S = 1.04 2465 reflections 164 parameters 0 restraints

Primary atom site location: structure-invariant direct methods

Secondary atom site location: difference Fourier map

Hydrogen site location: inferred from neighbouring sites

H atoms treated by a mixture of independent and constrained refinement

w = 1/[σ2(F

o2) + (0.0551P)2 + 0.1837P] where P = (Fo2 + 2Fc2)/3

(Δ/σ)max < 0.001 Δρmax = 0.32 e Å−3 Δρmin = −0.60 e Å−3

Fractional atomic coordinates and isotropic or equivalent isotropic displacement parameters (Å2)

x y z Uiso*/Ueq

N1 0.1739 (2) 0.07021 (18) 0.21676 (16) 0.0155 (3)

H1 0.134 (3) 0.116 (3) 0.135 (3) 0.030 (6)*

C2 0.3176 (3) −0.0843 (2) 0.25755 (19) 0.0191 (4)

H2 0.3641 −0.1364 0.1888 0.024*

C3 0.4012 (3) −0.1711 (2) 0.40145 (19) 0.0211 (4)

H3 0.4996 −0.2840 0.4318 0.026*

C4 0.3395 (3) −0.0915 (2) 0.49820 (18) 0.0188 (4)

H4 0.3994 −0.1481 0.5955 0.023*

C5 0.1176 (3) 0.1629 (2) 0.54967 (17) 0.0185 (4)

H5 0.1748 0.1122 0.6476 0.023*

C6 −0.0323 (3) 0.3219 (2) 0.50005 (18) 0.0185 (4)

H6 −0.0776 0.3813 0.5640 0.023*

C7 −0.1209 (3) 0.3991 (2) 0.35551 (18) 0.0170 (3)

H7 −0.2248 0.5097 0.3237 0.021*

C8 −0.0597 (2) 0.31715 (19) 0.26010 (16) 0.0129 (3)

N81 −0.1340 (2) 0.38149 (17) 0.11329 (14) 0.0154 (3)

H81 −0.188 (3) 0.313 (3) 0.091 (2) 0.024 (5)*

N82 −0.2880 (2) 0.54946 (17) 0.06257 (16) 0.0153 (3)

H82 −0.405 (4) 0.551 (3) 0.105 (2) 0.026 (5)*

H83 −0.233 (3) 0.620 (3) 0.070 (2) 0.017 (5)*

H84 −0.319 (4) 0.578 (3) −0.031 (3) 0.034 (6)*

C9 0.1006 (2) 0.15379 (19) 0.30938 (16) 0.0135 (3)

C10 0.1875 (2) 0.0741 (2) 0.45477 (17) 0.0155 (3)

(6)

Cl2 0.33779 (6) 0.50675 (5) 0.23075 (4) 0.01915 (14)

O1W 0.1078 (2) 0.22369 (16) 0.91537 (13) 0.0191 (3)

H1W 0.159 (4) 0.134 (4) 0.896 (3) 0.051 (8)*

H2W 0.001 (4) 0.266 (3) 0.875 (3) 0.033 (7)*

Atomic displacement parameters (Å2)

U11 U22 U33 U12 U13 U23

N1 0.0183 (7) 0.0164 (7) 0.0118 (7) −0.0062 (6) −0.0005 (5) −0.0049 (6)

C2 0.0201 (9) 0.0168 (8) 0.0209 (9) −0.0056 (7) 0.0025 (7) −0.0084 (7)

C3 0.0182 (8) 0.0153 (8) 0.0237 (9) −0.0037 (7) −0.0016 (7) −0.0022 (7)

C4 0.0185 (8) 0.0199 (8) 0.0157 (8) −0.0097 (7) −0.0028 (6) −0.0008 (7)

C5 0.0234 (9) 0.0257 (9) 0.0102 (7) −0.0143 (7) −0.0004 (6) −0.0055 (7)

C6 0.0247 (9) 0.0242 (9) 0.0139 (8) −0.0139 (7) 0.0046 (6) −0.0109 (7)

C7 0.0193 (8) 0.0168 (8) 0.0169 (8) −0.0070 (7) 0.0013 (6) −0.0081 (7)

C8 0.0164 (8) 0.0136 (7) 0.0102 (7) −0.0078 (6) 0.0000 (6) −0.0038 (6)

N81 0.0203 (7) 0.0120 (6) 0.0112 (7) −0.0016 (5) −0.0034 (5) −0.0053 (5)

N82 0.0178 (8) 0.0126 (7) 0.0131 (7) −0.0026 (6) −0.0018 (6) −0.0044 (6)

C9 0.0160 (8) 0.0151 (8) 0.0116 (7) −0.0080 (6) 0.0011 (6) −0.0052 (6)

C10 0.0180 (8) 0.0184 (8) 0.0122 (7) −0.0111 (6) −0.0013 (6) −0.0031 (6)

Cl1 0.0258 (3) 0.0132 (2) 0.0176 (2) −0.00356 (17) −0.00399 (16) −0.00546 (17) Cl2 0.0202 (2) 0.0218 (2) 0.0137 (2) −0.00540 (17) 0.00096 (16) −0.00665 (17)

O1W 0.0211 (7) 0.0165 (6) 0.0183 (6) −0.0021 (5) −0.0021 (5) −0.0091 (5)

Geometric parameters (Å, º)

N1—C2 1.325 (2) C6—H6 0.95

N1—C9 1.369 (2) C7—C8 1.371 (2)

N1—H1 0.78 (2) C7—H7 0.95

C2—C3 1.398 (3) C8—N81 1.409 (2)

C2—H2 0.95 C8—C9 1.423 (2)

C3—C4 1.370 (3) N81—N82 1.432 (2)

C3—H3 0.95 N81—H81 0.91 (2)

C4—C10 1.414 (2) N82—H82 0.91 (2)

C4—H4 0.95 N82—H83 0.87 (2)

C5—C6 1.367 (3) N82—H84 0.89 (3)

C5—C10 1.416 (2) C9—C10 1.414 (2)

C5—H5 0.95 O1W—H1W 0.84 (3)

C6—C7 1.410 (2) O1W—H2W 0.76 (3)

C2—N1—C9 123.19 (15) C6—C7—H7 119.4

C2—N1—H1 117.0 (16) C7—C8—N81 126.43 (15)

C9—N1—H1 119.7 (16) C7—C8—C9 118.32 (14)

N1—C2—C3 120.21 (16) N81—C8—C9 115.20 (14)

N1—C2—H2 119.9 C8—N81—N82 115.00 (13)

C3—C2—H2 119.9 C8—N81—H81 111.7 (13)

C4—C3—C2 119.24 (16) N82—N81—H81 106.8 (13)

(7)

supporting information

sup-5

Acta Cryst. (2002). E58, o1070–o1071

C2—C3—H3 120.4 N81—N82—H83 108.6 (13)

C3—C4—C10 120.66 (15) H82—N82—H83 116.2 (19)

C3—C4—H4 119.7 N81—N82—H84 107.1 (15)

C10—C4—H4 119.7 H82—N82—H84 108 (2)

C6—C5—C10 119.82 (15) H83—N82—H84 106 (2)

C6—C5—H5 120.1 N1—C9—C10 118.57 (15)

C10—C5—H5 120.1 N1—C9—C8 120.56 (14)

C5—C6—C7 121.10 (15) C10—C9—C8 120.87 (15)

C5—C6—H6 119.4 C4—C10—C9 118.04 (15)

C7—C6—H6 119.4 C4—C10—C5 123.25 (15)

C8—C7—C6 121.11 (16) C9—C10—C5 118.71 (15)

C8—C7—H7 119.4 H1W—O1W—H2W 104 (2)

C9—N1—C2—C3 0.6 (2) N81—C8—C9—N1 0.5 (2)

N1—C2—C3—C4 −2.9 (3) C7—C8—C9—C10 3.2 (2)

C2—C3—C4—C10 2.3 (2) N81—C8—C9—C10 −179.41 (13)

C10—C5—C6—C7 0.6 (2) C3—C4—C10—C9 0.5 (2)

C5—C6—C7—C8 0.1 (2) C3—C4—C10—C5 −179.92 (16)

C6—C7—C8—N81 −179.04 (15) N1—C9—C10—C4 −2.8 (2)

C6—C7—C8—C9 −1.9 (2) C8—C9—C10—C4 177.10 (14)

C7—C8—N81—N82 0.2 (2) N1—C9—C10—C5 177.62 (14)

C9—C8—N81—N82 −177.01 (13) C8—C9—C10—C5 −2.5 (2)

C2—N1—C9—C10 2.3 (2) C6—C5—C10—C4 −178.98 (15)

C2—N1—C9—C8 −177.57 (14) C6—C5—C10—C9 0.6 (2)

C7—C8—C9—N1 −176.98 (15)

Hydrogen-bond geometry (Å, º)

D—H···A D—H H···A D···A D—H···A

N1—H1···O1Wi 0.78 (2) 2.05 (2) 2.817 (2) 165 (2)

N81—H81···Cl1ii 0.91 (2) 2.32 (2) 3.1983 (16) 164.5 (18)

N82—H82···Cl2ii 0.91 (2) 2.25 (2) 3.1476 (18) 169.8 (18)

N82—H83···O1Wiii 0.87 (2) 1.94 (2) 2.808 (2) 178.7 (19)

N82—H84···Cl2iv 0.89 (3) 2.39 (3) 3.1805 (17) 149.1 (19)

O1W—H1W···Cl1v 0.84 (3) 2.21 (3) 3.0348 (17) 164 (2)

O1W—H2W···Cl2iii 0.76 (3) 2.47 (3) 3.180 (2) 158 (2)

Figure

Figure 1Molecular configuration and atom-numbering scheme for the title compound, showing 50% probability ellipsoids

References

Related documents

This retrospective study was carried out to identify the frequency and pattern of chromosomal aberrations among patients referred to the Division of Genetics, Department of

Materials and Methods: Whole blood sera samples from a total of 5781 patients suspected of various viral diseases (chikungunya, dengue, hepatitis A, hepatitis

The network evaluation methods introduced are based on examining the network response to each left context, available in the training corpus.. An effective way

We extended this mechanism to the universal principles: the constraints on a certain type were only checked, once certain attributes were sufficiently

We represent operators as elementary trees in LTAG, and use TAG op- erations to combine them; we give the meaning of each tree as a formula in an ontologically

tegration dynamics and volatility spillover effects of European and US

For those observations with a low debt ratio, the groups are further splitted on the basis of Debt/ GDP ratio; Inflation rate, Short term debt/ Foreign Reserves ratio; Short

We specify a VEC model based on six main macroeconomic imbalances to explain the Great European Recession, in Germany, France, Spain and Italy, from 1999 to 2013,