963
Electrical And Structural Study Of Metal Based
Nano Material: Iron Nickel Oxide
(Nano-Fe
2
O
3
.Nio)
Kapil Pandey, Chandra Kumar Dixit
Abstract: Magnetic Nano-Fe2O3.NiO nanoparticles exhibit idiosyncratic properties due to their reduced size i.e. nano size. In order to explore these distinctive properties, These particles with a size range of 40 – 60 nm has been characterized by X-ray Diffraction (XRD) Powder Method to confirm crystallographic structure consequently it has been found that the typical particle size is of 48.53 nm and the crystallographic structure is amorphous. The surface morphology of the studied compound has been investigated by Scanning Election Microscopy (SEM) indicating the homogeneous particle size and characteristic range of diameters 40 – 60 nm. Further, the electrical studies of the studied compound have been examined in order to acquire the electrical parameters (mainly dielectric permittivity, loss, conductivity, loss-tangent, impedance, and admittance). Appreciable rise in the conductivity (with frequency dependent) has been observed due to the decrease in the particle size of the material.it is also observed that the relative permittivity (e'), relative loss (e'') and dissipation factor (Tan d) decreases with increase in frequency. Finally, the Raman shift variation with the intensity which shows of studied compound has been analysed by Raman Spectroscopy.in which peaks are obtained at 144 cm-1, 283 cm-1 480 cm-1 and 685 cm-1 using laser at 785 nm.
Index Terms: Metal Based Nano Material, XRD, SEM, Raman spectroscopy, Loss tangent and Electrical Conductivity.
————————————————————
Introduction
Magnetic nanoparticles, having diameters up to hundreds of nanometers, are below wide-ranging analysis currently for biomedical applications, from MRI contrast agents, microwave imaging enhancement to drug delivery [1–4]. The magnetic nanoparticles exhibit such applications because their sizes are significantly smaller than target cells. The metal based nanoparticles have wide range of disciplines in chemistry, materials, sensors, electronics, storage devices, communication, aerospace, biological systems, drug delivery systems,[5] etc. Nanomaterials which have critical dimensions <100 nm they show very attention-grabbing and remarkable properties a part from their bulk counterparts. An outstanding challenge to enable such applications has been a thorough understanding of the Nano-Fe2O3.NiO Nano powder’s electrical response at high
frequencies. However, values of the required parameters are often an open question as they could be significantly affected by the material, size, and measuring device fabrication process [6]. To efficiently utilize Nano-Fe2O3.NiO
for biomedical applications over the frequencies of concern (often in the microwave regime), it is important to accurately characterize not only the magnetic response quantified by the permeability of the nanoparticles but also the electric response ascertained by the permittivity [7]. Currently, studies are working on nanostructured metal oxides due to their wide application in different fields of science. Among various metal oxide, Nano-Fe2O3.NiO is used for magnetic,
and conductivity applications.
The present the variation of Electrical parameters such as relative permittivity dissipation factor (Tan electrical conductivity relative loss ( ) with the frequency. In our study, Nano-Fe2O3.NiO nanoparticles were
characterized by X-ray diffraction (XRD), scanning election microscopy (SEM), and Raman spectroscopy to identify the structure and crystallite size, to identify the chemical bonds in a molecule and to know the purity of the element by chemical analysis [8].
Experimental Analysis
The nano Fe2O3.Nio powder X-ray diffraction was
conducted on a Philips Analytical XPERT-3 diffractometer using a Cu Kα radiation (λ = 1.54056 A°) with a MINIPROP detector and operating at 40 kV and 30 mA. X-ray diffraction patterns were recorded between 2θ = 5◦ and 109◦ with a step of 0.013◦ and a scan step time of 18.87 s by step. The crystallographic data of the resulting iron nickel oxide powders were collected by using the BBHD_MPPS_1D.xrdmp, Identifier Diffraction software. Surface morphologies of the specimens were observed with a scanning electron microscope (SEM, JEOL JEC3000FC) in which coating time is 60 sec operating from 1kv to 5kv and using 70% inert gas. In the Raman spectroscopy the experiment time is 30sec, laser power is used 0.5% and the range is selected from 100-2000 cts using Renishaw model of Raman spectroscopy. The dielectric measurements for the samples have been carried out with the dielectric cells in the form of parallel-plate capacitor. For unaligned, the dielectric cell has been prepared using indium tin oxide-coated glass plates, having surface resistance less than 1.0-1.5 ΩSq-1
The material has been filled in the cell at room temperature with the novo impedance analyser. The measurement of conductivity is based upon the formula given as following R = (ρd) / A R is proportional to the separation (d) between the electrodes, resistivity (ρ) of the material and inversely proportional to the cross-sectional area of the sample (A) Conductance (G) = 1 / R = Aσ / d (conductivity σ = 1/ρ). Using CA = A ε0 / d. Here, σ = G ε0 /
CA = ε0/ RCA The tan delta or dissipation factor of the
investigated compound has been determined in the
_________________________
Kapil pandey is currently pursuingPh. D. degree program in physics Department in Dr. Shakuntala Misra National Rehabilitation University,Lucknow, India, Mob-7351851480. E-mail: [email protected]
following way Dissipation factor or Tan = 1/2 fCR. The Various Electrical Parameters viz. Impedance (Z), Admittance (Y), Dielectric Permittivity ( '), Dielectric Loss
( ''), Electrical Conductivity ( ), and Loss Tangent (Tan ) of Metal Based Nano Materials: Iron Nickel Oxide at Room Temperature 32.1 ºC
Result and Discussion
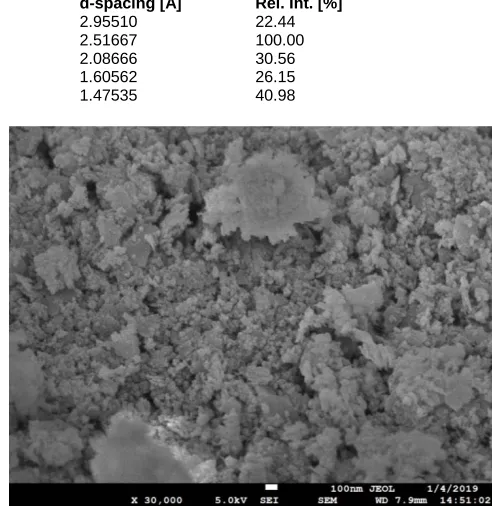
TABLE 1: Various Electrical Parameters viz. Pos. [°2θ], Height [cts], FWHM Left [°2θ] d-spacing [Å], and d-spacing [Å] of Metal Based Nano Materials: Iron Nickel Oxide at Room Temperature
Pos. [°2θ] Height [cts] FWHM Left [°2θ] d-spacing [Å] Rel. Int. [%]
30.2450 227.75 0.5117 2.95510 22.44
35.6767 1015.02 0.3582 2.51667 100.00
43.3645 310.16 0.5117 2.08666 30.56
57.3904 265.45 0.4093 1.60562 26.15
63.0064 415.96 0.6140 1.47535 40.98
Figure 1. The diffractogram of nanoparticle.
The figure 1 depicts the X-ray diffraction (Cu Kα radiation) spectrum of the nano Fe2O3.Nio powder. The synthesized
magnetic nanoparticles oxide shows good nanoparticles structure and are stable in hydrocarbon solvents against air oxidation. Figure 1 show the XRD patterns of nano Fe2O3.Nio powder at room temperature. The nano-sized
Iron nickel oxide powders are in amorphous structure. Its average particle size was 48.53 nm. That calculated through the Scherrer's formula D=kλ/βcosθ [9] Scanning electron microscopy (SEM) micrograph of agglomerated nanocrystalline iron nickel oxide particles produced. Scanning electron microscopy (SEM) images of iron nickel oxide nanoparticles (figure 2, 3 & 4) indicating the homogeneous size, agglomeration of particles, with diameters ranging from 40 to 60 nm. The morphology of the prepared iron nickel oxide nanoparticles was characterized by SEM images as shown in Figure 2-4. From images results, we can observe a large quantity of uniform nanoparticles (NPs) with average particle size of 40-60 nm.
Figure 2. SEM image of of the investigated sample Metal Based Nano Material: Iron Nickel Oxide nano Fe2O3.NiO.
965 Figure 4. SEM image of the investigated sample Metal
Based Nano Materials: Iron Nickel Oxide nano Fe2O3.NiO.
In the Raman spectroscopy the experiment time is 30sec, laser power is used 0.5% and the range is selected from 100-2000. The raman shifts for the peaks is observed at 144 cm-1, 283 cm-1 480 cm-1 and 685 cm-1 . The intensity relative to these peaks are 3511, 1225, 721, 3662. In this
study of nano Fe2O3.Nio nanoparticles, there is no
significant change in the peak position and intensity. The Raman shifts are consistent with those of nano Fe2O3.Nio
nanoparticles which are good agreement with XRD results.
Figure 5: Variation of raman shift (cm-1) vs. intensity of the investigated sample Metal Based Nano Materials: Iron
Nickel Oxide at Room Temperature.
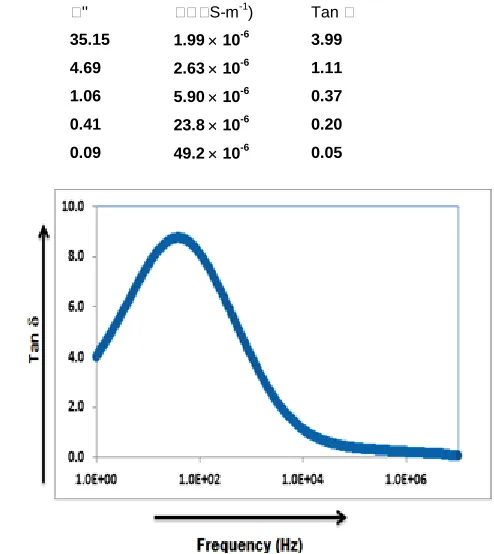
TABLE 2: Various Electrical Parameters viz. Impedance (Z), Admittance (Y), Dielectric Permittivity ( '), Dielectric Loss ( ''), Electrical Conductivity ( ), and Loss Tangent (Tan ) of Metal Based Nano Materials: Iron Nickel Oxide at Room Temperature
32.1 ºC
Frequency (Hz) Z () Y ()-1 ' '' S-m-1
) Tan
1 kHz 7.05 105 1.42 10-6 8.80 35.15 1.99 10-6 3.99 10 kHz 5.33 105 1.88 10-6 4.24 4.69 2.63 10-6 1.11 100 kHz 2.38 105 4.20 10-6 2.89 1.06 5.90 10-6 0.37
1 MHz 0.58 105 17.0 10-6 2.09 0.41 23.8 10-6 0.20 10 MHz 0.28 105 35.0 10-6 1.78 0.09 49.2 10-6 0.05
Figure 6: Variation of frequency (Hz) vs. relative permittivity investigated sample Metal Based Nano Materials: Iron Nickel Oxide (Nano-Fe2O3.NiO) at Room
Temperature 32.1 ºC.
Figure 7: Variation of frequency (Hz) vs. dissipation factor
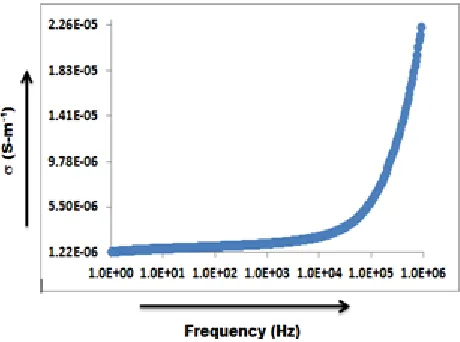
Figure 8: Variation of frequency (Hz) vs. electrical conductivity (} of the investigated sample Metal Based Nano Materials: Iron Nickel Oxide (Nano-Fe2O3.NiO) at
Room Temperature 32.1 ºC
Figure 9: Variation of frequency (Hz) vs. relative loss of the investigated sample Metal Based Nano Materials:
Iron Nickel Oxide (Nano-Fe2O3.NiO) at Room Temperature 32.1 ºC.
The figure 6 represents that the values of relative permittivity ( ) of the investigated sample Metal Based Nano Materials: Iron Nickel Oxide (Nano-Fe2O3.NiO) at
Room Temperature 32.1 ºC at 10 KHz, 100 KHz, 1MHz and100 MHz are 4.24, 2.89, 2.09, 1.78 respectively. Thus as frequency increases the relative permittivity ( ) decreases continuously and become minimum at very high frequencies. The figure 7 represents that the values of
Based Nano Materials: Iron Nickel Oxide (Nano-Fe2O3.NiO)
at Room Temperature 32.1 ºC at 10 KHz, 100 KHz, 1MHz and100 MHz are 1.11, 0.37, 0.20, 0.05 respectively. . Thus as frequency increases
increases up to a peak value and further on increasing the frequency it start to decrease and at very high frequencies becomes minimum. The figure 8 represents that that the values of electrical
and100 MHz are 2.63 10-6 , 5.9 10-6 23.8 10-6 and 49.2 10-6 S-m-1) respectively. Thus as frequency increases electrical conductivity also increases continuously. The figure 9 represents the values of relative loss ) of the investigated sample Metal Based Nano Materials: Iron Nickel Oxide (Nano-Fe2O3.NiO) at Room
Temperature 32.1 ºC at 10 KHz, 100 KHz, 1MHz and100 MHz are 4.69, 1.06, 0.41, 0.09 respectively. Thus as frequency increases relative loss ( ) decreases continuously and becomes minimum at very low high values of frequency.
Conclusion-
In this research it has described that at room temperature the structural and electrical study of Metal Based Nano Materials: Iron Nickel Oxide (Nano-Fe2O3.NiO) has done. It
is found that the Metal Based Nano Materials: Iron Nickel Oxide (Nano-Fe2O3.NiO) with homogeneous size, shape
distribution agglomeration of particles, with diameters ranging from 40 to 60 nm has been characterized by SEM, XRD and RAMAN SPECTROSCOPY. In addition, it is also observed that the relative permittivity ( ), relative loss ) and dissipation factor decreases with increase in frequency. Here Appreciable rise in the conductivity (with frequency dependent) has been observed due to the decrease in the particle size of the material (nanoscale). The Raman shift variation with the intensity which shows of studied compound has been analysed by Raman Spectroscopy.in which peaks are obtained at 144 cm-1, 283 cm-1 480 cm-1 and 685 cm-1 using laser at 785 nm.
Acknowledgement-
We are thankful to Director Birbal Shahni Institute of Paleoscience, Lucknow and to Dr. Ravindra Dhar ( prof. at Material science Depatment, University of Allahabad, India) to provide the infrastructure.
Ethical
Rules-1. This article does not contain any text recycling ( self plagrism).
2. In this article we did not use article spinning. 3. This article does not include any experiment on
sample of biological origin.
Conflict Of Interest- we have no conflict of interest about the fund and also for any other issue.
Refrences
[1]. Q.A. Pankhurst, J. Connolly, S.K. Jones, and J. Dobson, ―Applications of magnetic nanoparticles in biomedicine,‖ J Phys D: Appl Phys, vol.36, pp.167,2003.
https://iopscience.iop.org/article/10.1088/0022-3727/36/13/201
[2]. C.C. Berry and A.S.G. Curtis, ―Functionalisation of magnetic nanoparticles for applications in biomedicine‖, J Phys D: Appl Phys, vol. 36,
pp.198-203, 2003
https://iopscience.iop.org/article/10.1088/0022-967 [3]. A.K. Gupta and M. Gupta, ―Synthesis and surface
engineering of iron oxide nanoparticles for biomedical applications,‖ Biomaterials, vol. 26,
pp.3995-4021, 2005
https://doi.org/10.1016/j.biomaterials.2004.10.012 [4]. O.M. Bucci, L. Crocco, and R. Scapaticci, ―On the
optimal measurement configuration for magnetic nanoparticles-enhanced breast cancer microwave imaging,‖ IEEE Trans. Biomed. Eng, vol.62,
pp.407-414, 2015. DOI:10.1109/TBME.2014.2355411
[5]. D.S. Bai1, R.P. Suvarna, and C.B.M. Krishna, ―Characterization and DC Conductivity Studies of NiO Nano Particles,‖ I J Advs in Chem Sci, vol.
4,pp. 98-101, 2016.
http://www.ijacskros.com/artcles/IJACS-M177 [6]. P.C. Fannin, ―Use of ferromagnetic resonance
measurements in magnetic fluids,‖ J. Mol. Liq,
vol.114, pp.79-87, 2004. https://doi.org/10.1016/j.molliq.2004.02.020
[7]. G. Bellizzi and O.M. Bucci, ―A Novel Measurement Technique for the Broadband Characterization of Diluted Water Ferrofluids for Biomedical Applications,‖ IEEE Trans on Mags, vol. 49, pp.
2903 – 2912, 2013.
DOI: 10.1109/TMAG.2012.2235454
[8]. B.D. Hall, D. Zanchet and D. Ugarte, ―Estimating nano particle size from diffraction measurements,‖ J App Crytal, vol.33, pp.1335‑1341, 2000.
[9]. S.J. Davarpanah, R. Karimian and F. Piri ―Chemically Synthesis and Characterization of Iron and Nickel Oxide Nanoparticles for Biomedicine,‖ J Applied Biotech Reports, vol.2, no.1, pp. 207-209. 2015.
[10]. P.C. Panta and C.P. Bergmann, ―Raman Spectroscopy of Iron Oxide of Nanoparticles (Fe3O4),‖ J Mater Sci Eng . vol.5:217. 2015
doi:10.4172/2169-0022.1000217
[11]. E. Dilmukhambetov, T. Espolov, M. Ospanova and A. Ilyin, ―Reactivity to Oxidation of Metal Nanopowders after Electron Irradiation,‖ Journal of Materials Science Research, Vol. 2, no. 1, pp. 175-181, 2013. http://dx.doi.org/10.5539/jmsr.v2n1p175 [12]. B.M. Yao, Y.S. Gui, M. Worden, and T. Hegmann,
eds., ―Quantifying the complex permittivity and permeability of magnetic nanoparticles,‖ App Phy
Lett, 106:142406, 2015.