Scholarship@Western
Scholarship@Western
Electronic Thesis and Dissertation Repository
6-5-2012 12:00 AM
Top-Down Modulation of Category Specific Extrastriate Cortex in
Top-Down Modulation of Category Specific Extrastriate Cortex in
a Task-Switching Paradigm
a Task-Switching Paradigm
Katie Knapp
The University of Western Ontario
Supervisor
Dr. J. Bruce Morton
The University of Western Ontario
Graduate Program in Neuroscience
A thesis submitted in partial fulfillment of the requirements for the degree in Master of Science © Katie Knapp 2012
Follow this and additional works at: https://ir.lib.uwo.ca/etd
Part of the Cognitive Neuroscience Commons
Recommended Citation Recommended Citation
Knapp, Katie, "Top-Down Modulation of Category Specific Extrastriate Cortex in a Task-Switching Paradigm" (2012). Electronic Thesis and Dissertation Repository. 589.
https://ir.lib.uwo.ca/etd/589
This Dissertation/Thesis is brought to you for free and open access by Scholarship@Western. It has been accepted for inclusion in Electronic Thesis and Dissertation Repository by an authorized administrator of
TOP-DOWN MODULATION OF CATEGORY SPECIFIC EXTRASTRIATE CORTEX IN A TASK-SWITCHING PARADIGM
Title Page
(Spine Title: Modulation of Extrastriate Cortex During Task-Switching) (Thesis Format: Monograph)
by Katie Knapp
Graduate Program in Neuroscience
A thesis submitted in partial fulfilment of the requirements for the degree of
Master of Science
The School of Graduate and Postdoctoral Studies The University of Western Ontario
London, Ontario, Canada
ii
THE UNIVERSITY OF WESTERN ONTARIO School of Graduate and Postdoctoral Studies
CERTIFICATE OF EXAMINATION
Certificate of Examination
Supervisor
______________________________ Dr. J. Bruce Morton
Advisory Committee
______________________________ Dr. Stefan Everling
______________________________ Dr. Derek Mitchell
Examiners
______________________________ Dr. Melvyn Goodale
______________________________ Dr. Tutis Vilis
______________________________ Dr. Thilo Womelsdorf
The thesis by Katie Knapp
entitled:
Top-down modulation of category specific extrastriate cortex in a task-switching paradigm
is accepted in partial fulfillment of the requirements for the degree of
Master of Science
iii Abstract
During selective attention, visual stimuli compete for processing capacity. Increased activation is found in extrastriate regions that represent the attended stimulus. However, little research has been done looking at activation in extrastriate regions when attention is shifted between stimulus features. To address this, participants completed a switching task during fMRI scanning. They attended to the colour or motion of bivalent stimuli on different trials. It was hypothesized that attentional modulation would be seen in colour area V4 and motion area V5 and that this modulation would help explain switch costs, a term used to describe why we are slower and more error prone on switch trials. Attentional modulation was found in V4, with greater activity when colour was attended. No modulation was observed in V5. The level of competition between these regions did not differ across switch and repeat trials, suggesting that such competition does not explain switch costs.
Keywords: functional magnetic resonance imaging, top-down modulation, area V4,
iv Dedication
To my husband,
v Acknowledgments
I would like to extend my thanks and appreciation to a number of people who have assisted me throughout the completion of this thesis. To my supervisor, Dr. J. Bruce Morton, I appreciate the assistance and guidance that you have provided me throughout the course of this project. To my advisory committee members, Dr. Derek Mitchell and Dr. Stefan Everling, thank you for taking the time to consider my work and provide valuable insight and feedback. Thank you to Kim Krueger for working as the MRI technologist on this project throughout the course of data collection.
I would also like to thank the other members of the Morton lab (Rick Ezekiel, Heather Wilk, and Christian Battista) for creating a supportive, and at times
vi Table of Contents
Title Page i
Certificate of Examination ii
Abstract iii
Dedication iv
Acknowledgments v
Table of Contents vi
List of Tables viii
List of Figures ix
List of Appendices x
List of Abbreviations xi
Chapter 1 - Introduction 1
1.1 Cognitive Control 1
1.2 Task Switching 2
1.3 Selective Attention & Top-down Modulation 4 1.4 Evidence of Top-Down Modulation 6 1.5 fMRI Studies of Task Switching 10 1.6 The Role of Prefrontal and Parietal Regions in Top-Down Modulation 16
1.7 Area V4 and V5 19
1.8 Purpose and Hypotheses 21
Chapter 2 – Methods 28
2.1 Participants 28
2.2 Stimuli 28
2.3 Experimental Procedure 29
2.4 fMRI Data Acquisition 32
2.5 fMRI Data Preprocessing 32
vii
2.6.1 Whole Brain Analysis 33
2.6.2 Region of Interest Analyses 33
2.6.3 Follow-up Analyses 36
2.6.4 Psychophysiological Interaction Analysis 38
Chapter 3 – Results 39
3.1 Behaviour 39
3.2 fMRI 40
3.2.1 Whole Brain Analysis 40
3.2.2 ROI Analyses 42
3.2.3 Follow-up Analyses 50
3.2.4 Psychophysiological Interaction Analysis 52
Chapter 4 – Discussion 55
4.1 Task-Switching and the Cognitive Control Network 55 4.2 Top-Down Modulation of Area V4 and V5 56
4.2.1 Defining Area V5 57
4.2.2 Does Area V5 show feature selective modulation? Evidence from
Electrophysiology 59
4.2.3 The Role of Bottom-Up Mechanisms 62 4.3 Competition during Switch and Repeat Trials 65 4.4 The Role of Prefrontal and Parietal Regions in Top-Down Modulation 70
4.5 Future Directions 71
Chapter 5 - Summary and Conclusions 74
References 76
Appendix 1 – Ethics Approval 84
viii List of Tables
Table 1 Behavioural data: Mean response times and accuracy 40 Table 2 fMRI data: Brain regions more activated during switch than repeat trials 41
Table 3 Comparison of the mean location of V5 activation from the localizer and task
switching runs 52
Table 4 Brain regions showing connectivity with area V4 during the attend colour
ix List of Figures
Figure 1 A visual depiction of the three different ways in which competition between
areas V4 and V5 may play out during task switching on a colour relevant trial. 25 Figure 2 Schematic illustration of trial sequence. 30 Figure 3 Neural regions showing greater activation during task switch trials than task
repeat trials. 42
Figure 4 Regions of interest within category-specific extrastriate areas are shown in
an example subject. 43
Figure 5 Mean beta weights from category specific extrastriate regions a) V4 and b)
V5 depicting the main effect of trial type. 44 Figure 6 Mean beta weights from category specific extrastriate regions a) V4 and b)
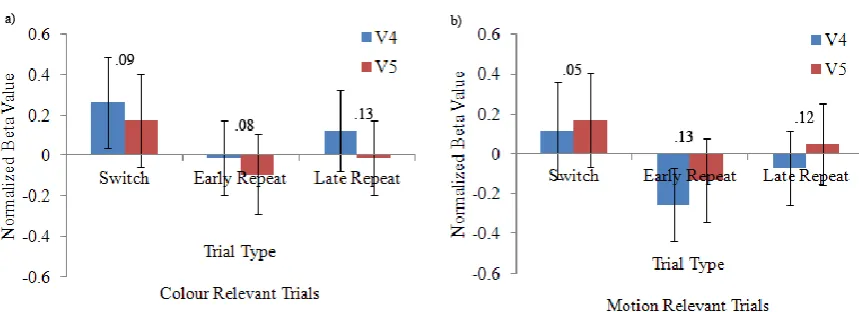
V5 depicting the main effect of dimension. 44 Figure 7 Normalized beta weights from category specific extrastriate regions showing
the significant interaction of trial type and dimension. 46 Figure 8 Normalized beta weights depicting the relationship between trial type and
the difference in activity between the ROIs for a) colour-relevant trials and b)
motion-relevant trials. 47
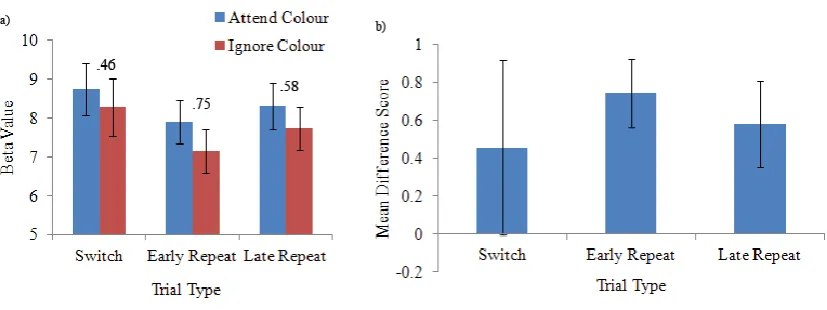
Figure 9 a) Mean beta weights from area V4 depicting the relationship between
dimension and trial type. b) Mean difference scores across trial type. 49 Figure 10 a) Mean beta weights from area V5 depicting the relationship between
dimension and trial type. b) Mean differences scores across trial type. 49 Figure 11 Mean beta weights from area V5 as defined using the task switching runs
depicting the main effect of a) dimension and b) trial type. 51 Figure 12 Brain regions whose time course was more correlated with area V4 in the
x List of Appendices
xi List of Abbreviations
ACC Anterior cingulate cortex AIC Anterior insular cortex ANOVA Analysis of variance
BOLD Blood oxygen level dependent DLPFC Dorsolateral prefrontal cortex dPMC Dorsal premotor cortex EEG Electroencephalography FDR False-discovery rate FFA Fusiform face area
fMRI Functional magnetic resonance imaging GLM General linear model
HRF Hemodynamic response function IFJ Inferior frontal junction
ITG Inferior temporal gyrus ITI Inter-trial interval
MEG Magnetoencephalography PET Positron emission tomography PFC Prefrontal cortex
PPA Parahippocampal place area PPC Posterior parietal cortex
PPI Psychophysiological interaction analysis pSMA Pre-supplementary motor area
Chapter 1 - Introduction
“The brain is the last and grandest biological frontier, the most complex thing we have yet discovered in our universe. It contains hundreds of billions of cells interlinked through trillions of connections. The brain boggles the mind.”
James D. Watson, 1992
1.1 Cognitive Control
One of the fundamental questions at the heart of neuroscience is how we, as human beings, are able to perform purposeful, planned behaviours. How is it that the result of the interaction of billions of neurons in the brain can lead to higher-order cognitive functions such as attention, planning and memory? The performance of such tasks requires cognitive control – the ability to guide thought and action based on internal goals (Miller & Cohen, 2001). Such control plays a vital component in our everyday lives. It becomes necessary when a habitual response must be overridden, when distracting stimuli must be ignored, or when we need to shift our attention depending on task requirements. Such behavioural flexibility is crucial as we have limited cognitive resources and we are constantly encountering changing
the road and conversing with your passenger. However, should a snow squall suddenly hit, you would need to stop the conversation and reallocate your full attention to the road to ensure safe arrival at your destination. The change in environmental demands required you to ignore the distracting conversation, inhibit your desire to respond to the passenger, and instead shift your attention to the road in order to successfully perform the task at hand. We are able to perform these selective attention, switching, and inhibition tasks with ease, but a full understanding of how the brain carries out these complex tasks remains to be elucidated.
1.2 Task Switching
While numerous paradigms have been created to assess cognitive control, one that is commonly used is the task switching paradigm. Task switching is the ability to flexibly shift ones attention as the demands of a task change. This ability was first measured in a laboratory setting by Jersild (1927). In a typical task switching experiment, participants are asked to perform a particular task on a discrete set of trials depending on a cue preceding stimulus presentation. The exact task to be performed switches throughout the experiment, so participants must attend to the cue on each trial in order to perform the correct task. Participants typically show switch costs on such tasks, with slower and more error prone responses on switch compared to repeat trials (Kiesel et al., 2010; Monsell, 2003, Vandierendonck, Liefooghe, & Verbruggen, 2010).
place, and this process requires time to readjust what it is that you are attending to. The other prominent hypothesis attempting to explain switch costs is the task-set inertia hypothesis which emphasizes the role of interference rather than
reconfiguration (Allport, Styles, & Hsieh, 1994). This theory suggests that switch costs reflect interference from competing stimulus-response mappings with the same stimuli that persist from instructions that were relevant on previous trials.
While both of these theories have been influential in encouraging a surge of research on this topic, neither one has come out as a clear leader. It has been suggested that both of these views are still somewhat incomplete and results do not support one view over the other (Meiran, 1996; Vandierendonck et al., 2010). In fact, one study in particular has demonstrated results which support some aspects of both theories (Cepeda, Kramer, & Gonzalez de Sather, 2001). When participants were given increased time to prepare for the task after a task cue was provided, switch costs were reduced. This result supports the reconfiguration view as when time was
1.3 Selective Attention & Top-down Modulation
More theoretical exploration would be useful in the task switching field, and the importance of selective attention in task switching should be considered. Selective attention is the ability to attend selectively to particular information in the
environment while ignoring any distracters (Schroeder, 1995). It seems clear that this ability would play an important role in task switching which involves switching one’s attention between two stimulus attributes based on which attribute is relevant on a particular trial. Despite the fact that it seems clear that selective attention would be one important component of task switching, surprisingly, these two constructs have been studied independently with little exchange occurring between these two fields of study. Only recently has it been suggested that the underlying processes of task switching and selective attention may be similar (Hanania & Smith, 2010; Meiran, 2000; Meiran, Dimov, & Ganel, 2012). Empirical models of selective attention should be considered in the quest to understand the underlying processes behind switch costs.
Given that we are capable of processing only a limited amount of visual information at a time, exactly how the brain decides what information should be processed is a question of paramount interest to both selective attention and task switching researchers. In an attempt to explore this question, the biased competition model of selective attention was proposed which suggests that objects in our visual field compete for processing capacity (Desimone & Duncan, 1995). Such competition is biased by both bottom-up mechanisms, such as the particular features of the
the activity of neurons representing the stimulus relevant to the current task, and the consequence of this for irrelevant information is inhibition (Miller & Cohen, 2001). The neurons with higher levels of activity ‘win’ the competition and the stimulus features that they represent gain further access to memory systems and motor systems where the ‘winning’ information guides action and behaviour (Kastner & Ungerleider, 2000).
There is some disagreement about whether the biasing of extrastriate regions by top-down control is achieved by the amplification of task-relevant features, the suppression of task-irrelevant features, or both. Theoretical models suggest that this competition is represented in visual regions as an enhancement of task-relevant information (Desimone & Duncan, 1995; Miller & Cohen, 2001), and some empirical support has been provided for this assertion (Egner & Hirsch, 2005). In contrast, other research points to the importance of suppression in the biasing of extrastriate regions (Gazzaley, Cooney, McEvoy, Knight, & D’Esposito, 2005). The different results found in these studies may be due to methodological differences in defining baseline activity to measure enhancement and suppression against. The current study hopes to provide some insight into the mechanisms at play during these competitive
1.4 Evidence of Top-Down Modulation
Preliminary evidence for the biased competition model of selective attention has emerged from a number of studies over the years. One of the earliest studies to find support for the idea that activity in perceptual visual regions is modulated by attention was a single cell recording study in monkeys (Moran & Desimone, 1985). This study demonstrated for the first time that visual area V4 could be modulated by attention. The response of V4 cells was determined not by the physical properties of all the visual stimuli in the array, but instead by the properties of the attended stimulus. This same attentional effect has also been found in area MT in monkeys (Treue & Maunsell, 1996).
More recent studies in humans using a variety of neuroimaging techniques have also provided support for the biased competition model of attention. Early studies used selective attention paradigms alongside positron emission tomography (PET; Corbetta, Miezin, Dobmeyer, Shulman, & Petersen, 1991), functional magnetic resonance imaging (fMRI; Buchel et al., 1998; Chawla, Rees, & Friston, 1999;
O’Craven, Rosen, Kwong, Treisman, & Savoy, 1997; Shibata et al., 2008),
stimulus motion was attended (Shibata et al., 2008). These identical visual stimuli produced different activation patterns in these extrastriate visual regions based on attentional goals. These regions are likely receiving top-down signals which are biasing attention towards stimuli that are relevant to the current task. This attention modulation effect has also been observed in other extrastriate brain regions such as the fusiform face area (FFA) when subjects are asked to selectively attend to faces, and the parahippocampal place area (PPA) when subjects are instructed to attend to houses (O’Craven, Downing, & Kanwisher, 1999). These studies provide support for the idea that the top-down modulation of extrastriate regions is reflected in an
enhancement of brain regions that represent information that is task relevant. More recent research has begun to look at the role of suppression in task irrelevant regions to further explore the competitive interactions of extrastriate visual regions during attention. Such research is particularly interesting because in addition to looking at the role of suppression in competition, these studies have focused on identifying the role of extrastriate regions during working memory, a more
challenging cognitive control task. Using both univalent and bivalent stimuli in the context of working memory paradigms, several studies have found evidence for top-down modulation in extrastriate regions (Gazzaley, Cooney, McEvoy et al., 2005; Gazzaley, Cooney, Rissman, & D’Esposito, 2005; Rutman, Clapp, Chadick, & Gazzaley, 2010; Zanto & Gazzaley, 2009; Zanto, Rubens, Bollinger, & Gazzaley, 2010; for review see Gazzaley, 2010 and Gazzaley, 2011).
In the context of working memory, competition in extrastriate regions takes place due to both the enhancement of task-relevant information and the suppression of task-irrelevant information. This finding was elucidated in a study which had
Cooney, McEvoy et al., 2005). On each trial, four stimuli were sequentially presented, 2 images of faces, and 2 images of scenes. Following this was a delay period and then a probe enquiring about a feature of the relevant stimulus dimension on that particular trial. On some trials participants were instructed to attend to the face, on other trials they were to attend to the scenes, and on others they were to just passively view the stimuli. Participants showed evidence of top-down modulation of the FFA when faces were to be recalled, and the PPA when scenes were the stimuli to be recalled. Both enhancement and suppression of these brain regions was found relative to the passive viewing baseline depending on the task instruction given such that, the PPA, a scene selective brain area, showed higher activity when scenes were attended compared to the passive view baseline, and also reduced activity compared to baseline when scenes were to be ignored. This study provides evidence for the hypothesis that competition in extrastriate visual regions is represented by both an enhancement of task-relevant information and a suppression of task-irrelevant information. In a similar working memory task, but substituting the face and scene stimuli for motion and colour stimuli, similar attentional modulation has been found in V4 when colour was to be remembered and V5 when direction of motion was to be recalled (Zanto et al., 2010).
working memory performance on the motion task was associated with a lack of modulation of the P1 component (Zanto & Gazzaley, 2009).
While these working memory experiments suggest that competition in extrastriate regions takes place due to both the enhancement of task-relevant regions and the suppression of task-irrelevant regions, other research suggests that this may not be the case. It has been suggested that instead, such competition is reflected by an enhancement of task-relevant information, but not a suppression of task-irrelevant information (Egner & Hirsch, 2005). This study examined modulation in the FFA while participants performed a variant of the Stroop task which involved
discriminating between actors and political figures. Faces with names superimposed on them were presented to participants, and on some trials participants categorized the face as actor or politician, and on other trials they categorized the name written over the face as actor or politician. When faces were the target stimuli, activity in the FFA was enhanced; however when faces served as the distracting stimuli, cognitive control had no effect on FFA responses, thus no suppression was found.
It is evident that modulation of extrastriate regions is present even on
challenging cognitive control tasks such as working memory and inhibition, and such modulation is tightly related to performance on such tasks. This presents the
1.5 fMRI Studies of Task Switching
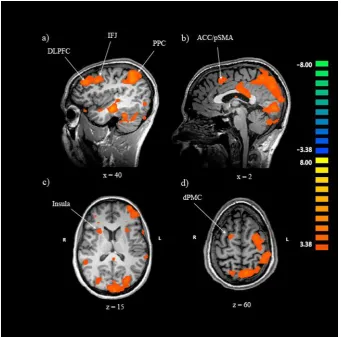
Before delving into studies which have begun to explore whether similar top-down modulation exists in extrastriate regions during task switching, it is important to note the other brain regions that are associated with performance on switching tasks. Functional neuroimaging studies have identified a distributed fronto-parietal network that is consistently activated during the performance of task switching in a variety of studies using different paradigms and stimuli (Badre & Wagner, 2006; Braver, Reynolds, & Donaldson, 2003; Dove, Pollmann, Schubert, Wiggins, & von Cramon, 2000; Gold, Powell, Xuan, Jicha, & Smith, 2010; Liston, Matalon, Hare, Davidson, & Casey, 2006; Liu, Slotnick, Serences, & Yantis, 2003; Morton, Bosma, & Ansari, 2009; Sohn, Ursu, Anderson, Stenger, & Carter, 2000; Yeung, Nystrom, Aronson, & Cohen, 2006). The key cortical regions involved in this network include the anterior cingulate cortex (ACC)/ pre-supplementary motor area (pSMA), the dorsolateral prefrontal cortex (DLPFC), the inferior frontal junction (IFJ), the anterior insular cortex (AIC), the dorsal pre-motor cortex (dPMC), and the posterior parietal cortex (PPC). These regions are consistently activated in studies of task switching, and they have also been found to form a functionally connected network (Cole & Schneider, 2007). These regions work together to implement cognitive control during switching tasks.
competition hypothesis was proposed which suggests that stimuli are processed according to all of the stimulus-response rules that have been learned in the past (Wylie, Javitt, & Foxe, 2003a, 2004a, 2004b). So, when bivalent stimuli are used, and a task is performed on each dimension of that stimulus, the processing pathways for the two dimensions will be activated on each trial regardless of which task is currently relevant. Some sort of competition will then occur and only the pathway that
performed in stage one. They had to respond to the faces and the thickness of the stimuli depending on which was presented. The stimuli presented in this third were exactly the same stimuli that were used in stage one. Activation during the third stage was contrasted with activation during the first stage to examine whether performing a different task on the same stimuli in stage 2 had any impact on performance. This experimental design allowed for the examination of the impact that adding a different stimulus-response mapping would have on behavioural performance and/or brain activation. Brain areas that were associated with motion and colour, which were irrelevant on both stage one and stage three, were more active on the third block than on the first block. Participants also showed larger switch costs on the third block compared with the first block even though the task they performed was identical. These results suggest that the tasks that were learned in stage two interfered with performance during stage three both at a behavioural and neural level. It appears that performance on switching tasks is impacted by interference from stimulus-response mappings that were once relevant, but are now irrelevant, consistent with the competition hypothesis.
Of particular interest though, is not whether some sort of interference is occurring, but what the effect of that interference is in specific regions of extrastriate cortex. Evidence for such competition within the extrastriate cortex during task switching has been found in the FFA and the PPA using fMRI (Serences,
the other dimension. Participants followed the instructions of these targets, and pressed a button to indicate that a target had been detected. Activity in the FFA was higher when participants were supposed to be attending to faces rather than houses. Similarly, the PPA was more active when participants were attending to houses rather than the faces. This modulation of FFA during task switching has been replicated, and attentional modulation in the inferior temporal gyrus (ITG) has also been observed when participants were performing a task that involved switching between attending to faces and attending to words (Yeung et al., 2006). The results of this study suggest that modulation can be observed in FFA, PPA, and ITG based on attentional goals.
individual colour and motion areas. While the fusiform gyrus showed attentional modulation when participants attended to the colour of the stimuli, this activation did not fall in area V4, an area that has been implicated in colour processing. While this study seems to suggest that modulation based on attention does occur in task
switching studies of motion and colour, the question still remains as to whether this modulation occurs in category specific areas V4 and V5.
Another study which was conducted to examine competition in motion and colour processing areas was interested in examining the conflict monitoring hypothesis of attention. This hypothesis suggests that the ACC monitors for any conflict in information processing while the DLPFC then acts to resolve that conflict (Botvinick, Braver, Barch, Carter, & Cohen, 2001). In order to test this hypothesis, an experimental paradigm designed to instigate conflict was used so that the mechanisms involved in resolving this conflict could be explored using fMRI (Liston et al., 2006). On each trial, participants were presented with a pair of square-wave gratings located on either side of the screen. These gratings were either red or blue and were moving up or down. On some trials, a cue instructed participants to press the button
competition takes place in regions responsible for processing the relevant stimulus dimensions. However, it still does not offer any indication of whether modulation takes place in area V4 or V5. Again, a functional localizer was not used to identify motion area V5 and colour area V4. A localizer task should be administered in order to address the question of whether competition is taking place in category specific extrastriate regions V4 and V5. Only with the use of such a methodology can modulation within these category specific regions be examined.
The need for a localizer scan to independently identify these extrastriate regions before examining modulation within them is clearly an important next step to determining whether top-down modulation and competition between early visual regions occurs in the context of task switching. Only one study to date has
independently localized area V4 and V5 before examining modulation within these regions using fMRI. However, the focus of this study was not on whether modulation occurs in these regions during stimulus presentation, but whether competition can be seen in these early visual areas prior to stimulus presentation during the preparation phase of a task switching study (Wylie, Javitt, & Foxe, 2006). The stimuli used in this study were coloured rotating rectangles. Depending on a cue preceding stimulus presentation, participants had to indicate whether the rectangle was red or blue, or whether it was moving slowly or quickly. The cue switched throughout the course of a run. In addition, univalent trials were included which were used to independently identify motion and colour areas of the brain. The analyses focussed solely on activation during cue presentation. Modulation in the regions identified by the
switching task as no switch costs were found during the colour task. In contrast, modulation was not found during the cue period in V5, suggesting that participants were less able to prepare for this task, and this was reflected in the behaviour of participants as they displayed large switch costs during the motion task. While these results are interesting, the researchers did not examine modulation in these same regions during the actual stimulus presentation. Studies have shown that baseline increases in activation in area V5 related to the expectation of motion do not predict the modulation of neural responses that occur when the actual stimulus is presented (McMains, Fehd, Emmanouil, & Kastner, 2007). Thus a key question of interest that remains unaddressed is whether modulation is seen in area V4 and area V5 when bivalent colour-motion stimuli are presented and different aspects of the stimuli are relevant on different trials. This study hopes to shed some light on this issue.
1.6 The Role of Prefrontal and Parietal Regions in Top-Down Modulation
An important question emerges from a consideration of these previous findings which suggest that you do see modulation in extrastriate regions based on attentional goals. The question of which brain regions are actually responsible for providing these biasing signals remains to be addressed. Miller and Cohen’s (2001) model of PFC function suggests that modulation takes place due to top-down
extensive anatomical connections would suggest that the PFC would be able to perform such a modulatory role.
In additional support of this idea, axonal tract-tracing studies in monkeys have shown that long range reciprocal cortico-cortical connections exist between the PFC and the visual association cortex, suggesting that it is certainly possible that the PFC may bias extrastriate regions (Cusick, Seltzer, Cola, & Griggs, 1995; Petrides & Pandya, 2002; Rempel-Clower & Barbas, 2000; Ungerleider, Gaffan, & Pelak, 1989). Reciprocal connections have been identified between the PFC and colour area V4 (Rempel-Clower & Barbas, 2000) as well as motion area V5 (Cusick et al., 1995). Other evidence in support of the assertion that the PFC biases extrastriate regions during selective attention comes from lesion studies in humans. It has been shown that people with DLPFC lesions have difficulty detecting visual targets, and importantly, this behavioural deficit is accompanied by diminished extrastriate responses (Barcelo, Suwazono, & Knight, 2000). This result suggests an important relationship between the PFC and extrastriate visual regions during visual attention tasks.
extrastriate regions, a functional connectivity analysis was conducted. The IFJ was found to be involved in modulating both area V4 and V5. The time course of activity in the IFJ showed a higher correlation with activity in area V4 during the attend colour condition compared to the ignore colour condition, and also showed a higher correlation with activity in area V5 during the attend motion condition compared with the ignore motion condition. Causal evidence has also been found for the role of the IFJ in top-down modulation. When transcranial magnetic stimulation (TMS) was applied to the right IFJ, creating a virtual lesion in this area, modulation of extrastriate regions was reduced (Zanto, Rubens, Thangavel, & Gazzaley, 2011). This reduced modulation was also accompanied by poorer working memory accuracy on the working memory colour task. These results suggest that the IFJ plays a vital role in modulating both area V4 and V5, and that this modulation is important for task performance.
Mangun, 2000; Herrington & Assad, 2010). Specifically, one study has shown that the supramarginal gyrus/angular gyrus plays an important role in modulating colour area V4 when participants are to attend to colour and ignore another stimulus dimension (Zanto et al., 2011). It seems that a network of fronto-parietal regions may be
responsible for providing top-down modulatory signals to extrastriate regions in order to bias processing in these regions towards information that is behaviourally relevant.
1.7 Area V4 and V5
Motion and colour were used as the stimulus features of interest in this study because distinct extrastriate regions respond selectively to each of these categories with area V4 responding to colour and area V5 to motion (Zeki et al., 1991). Area V4 and V5 are particularly useful extrastriate regions for examining competitive
Unlike colour, motion is processed by the dorsal visual pathway (Goodale & Milner, 1992; Ungerleider et al., 1998). One particularly important region for motion processing within this pathway is area V5 which is located in the temporo-parieto-occipital junction (Grill-Spector & Malach, 2004; Zeki et al., 1991). Using both PET and fMRI, it has been shown that this brain region displays greater activation when participants are passively viewing moving dots, moving square patterns or moving checkerboards than it does to these same stimuli when they are stationary (Dumoulin et al., 2000; Watson et al., 1993; Zeki et al., 1991). The importance of area V5 for motion processing was highlighted in a study which demonstrated that TMS to this area is effective in abolishing the perception of motion (Beckers & Zeki, 1995). While the location of area V5 does differ somewhat across subjects it usually falls just posterior to the meeting point of the ascending limb of the inferior temporal sulcus and the lateral occipital sulcus (Dumoulin et al., 2000; Watson et al., 1993). Area V5 is activated both while passively viewing moving objects and also when purposefully attending to the movement of objects (Chawla et al., 1999). This highlights the important role that this region plays in the visual perception of motion.
It is clear that area V4 and area V5 are separate regions, both anatomically, and functionally. In addition to this spatial and functional separation, area V4 and V5 also fall into different visual processing streams. Despite all of these factors
search tasks with both moving and coloured stimuli (Walsh, Ellison, Battelli, & Cowey, 1998). TMS applied to V5 had a detrimental effect on tasks which involved motion as the relevant stimulus dimension, with participants showing increased reaction times on these tasks. In contrast, the TMS actually facilitated performance on tasks in which colour was relevant, with reaction times decreasing on these trials. TMS to V5 may have been beneficial to performance on the colour task due to disinhibition of the colour area when the normal role of V5 was eliminated. These results suggest that area V4 and area V5 do compete for processing resources, and hold the type of competitive relationship proposed by Desimone and Duncan (1995). As such, motion and colour seemed to be ideal stimuli to use in order to examine whether competition between category specific regions takes place during task switching.
1.8 Purpose and Hypotheses
Having the ability to rapidly switch our attention between tasks is a vital part of our daily functioning. This study aimed to shed some light on the neural
mechanisms that underlie this ability by exploring whether the top-down attentional modulation of extrastriate visual regions seen in selective attention paradigms is also present during task switching. Another aim of this study is to determine whether such modulation may help to explain the existence of switch costs.
In order to explore the neural regions involved in switching and to elucidate the role of top-down modulation in such tasks, this study utilized a switching
to attend to the colour of the dots. The relevant feature switched throughout the experiment. An independent functional localizer was administered to independently identify area V4 and V5 in each individual subject so that modulation in these specific regions could be explored. Other brain regions recruited during the switching task were also examined. Using this paradigm, the question of whether top-down modulation can be observed in colour area V4 and motion area V5 based on
attentional goals was examined in the context of task switching. Another question of interest was whether this competition between extrastriate visual regions was greater on switch trials compared to when the task was repeated. If this was the case, this greater competition between visual regions processing both relevant and irrelevant features may explain why switch costs are found using such paradigms. While some studies have begun to examine these questions in the context of task switching, they have failed to use an independent localizer to identify category specific regions (Liu et al., 2003; Liston et al., 2006) or have not looked at modulation within these regions during stimulus presentation when one would expect competition to be strongest (Wylie et al., 2006). This study hopes to fill these gaps and shed more light on these important questions.
The first hypothesis predicted that activation would be seen in the network of brain regions that has been described as the cognitive control network when
Secondly, it was hypothesized that modulation would be expected in both area V4 and area V5 based on the goals at the time of encoding the stimulus. It was
expected that top-down modulation would enhance activity in the region specialized for processing the relevant stimulus dimension (Miller & Cohen, 2001). Modulation in these regions has been found in the context of simple selective attention tasks (Buchel et al., 1998; Chawla et al., 1999; O’Craven et al., 1997; Schoenfeld et al., 2007; Shibata et al., 2008), and also in more cognitively demanding working memory tasks (Zanto et al., 2010; Zanto et al., 2011). The explanation for why modulation was found in these working memory tasks was that it was due to the vital role that
selective attention plays in the completion of such tasks. It was expected that in the context of task switching, modulation in these regions will also be seen since selective attention also plays a key role in performance during switching.
would subsequently decrease with each repeat trial. This would fit nicely with the findings of Liston et al. (2006) which demonstrated greater competition between motion and colour relevant regions on switch trials relative to repeat trials. It also falls in line with the ideas presented by Wylie et al. (2004a, 2004b) who suggested that competition between stimulus-response mappings would take place on all trials when more than one response was associated with a given stimulus, but such
competition will be more pronounced on switch trials. It is expected that competition will be smallest on the late repeat trials when participants would have been
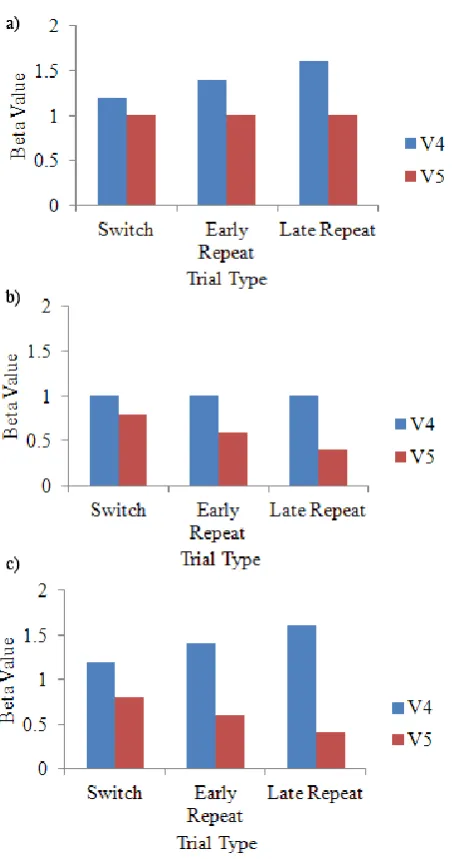
Figure 1. A visual depiction of three different ways in which competition between area V4 and area V5 may play out in the context of task switching on colour relevant trials. a) Enhancement of task-relevant information indexed by increased activation in V4, and no change in activation in V5. b) Suppression of task-irrelevant information indexed by no change in activity in V4, but a decrease in activity in V5. c) Both enhancement of task-relevant information and suppression of task-irrelevant
In addition to addressing the question of whether competition between V4 and V5 differed across trial type, differences in the degree of modulation within these extrastriate visual regions was examined. It is possible that differences in the level of competition between V4 and V5 would not be found between switch and repeat trials, but that differences in the degree of modulation across these different trial types would be found if activity within these regions was looked at independently. It was predicted that the smallest amount of modulation would occur on switch trials when top-down modulation is just beginning to modulate attention in the relevant
extrastriate region, and the greatest amount of modulation would occur on later repeat trials as participants become better at honing in on the relevant stimulus.
Finally, the fourth hypothesis deals with the question of which brain areas may be responsible for implementing biasing signals and modulating area V4 and V5. It is expected that the PFC will play an important role in this top-down modulatory
specifically, it is expected that the supramarginal gyrus and angular gyrus will be involved in modulating both area V4 and V5. These brain regions have been shown to play an important role in modulating these extrastriate regions in the context of
Chapter 2 – Methods
2.1 Participants
Twenty-one adults ranging in age from 18-28 (mean 23.86; 10 males) were recruited from the undergraduate and graduate faculties at Western University to participate in this study. All participants were right-handed, had normal or corrected to normal vision and reported no history of neurological or psychiatric illness. Data from three participants were excluded from the analyses, one due to excessive motion (greater than 3mm), one because their behavioural accuracy performance was more than 4 SD below the group mean, and one due to an inability to localize area V4 or V5 with the functional localizer. Thus, the data presented here are from 18
participants. All participants provided informed consent consistent with the policies of the Human Subjects Research Ethics Board at Western University.
2.2 Stimuli
throughout the experiment. The localizer task involved the presentation of univalent stimuli presented in different blocks. Some blocks contained stationary gray dots, other blocks contained stationary coloured dots (blue or red), and other blocks contained moving gray dots which moved either left or right.
2.3 Experimental Procedure
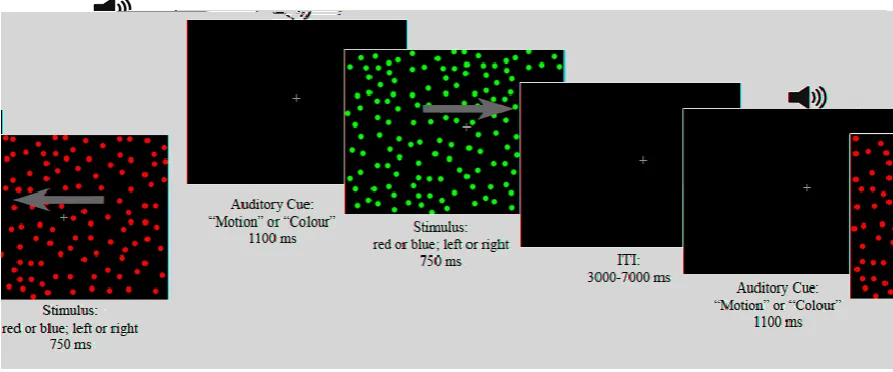
Participants completed two event-related task switching runs. Each trial within these runs involved the presentation of a bivalent stimulus. Participants had to attend to only one dimension of the stimulus (colour or direction of motion) on each trial however, the relevant dimension switched throughout the run. Participants were instructed to respond as quickly and accurately as possible to each trial based on an auditory cue that preceded the trial. The auditory cue was 600ms in length and was presented 500ms prior to the appearance of the stimulus. The cue instructed
Figure 2. Schematic illustration of trial sequence. Participants attended to either colour or motion depending on the auditory cue preceding stimulus presentation. They were required to make a behavioural choice based on the dimension of relevance as quickly and as accurately as possible. Gray arrows simply indicate direction of stimulus motion, and were not part of the stimulus administered during the task.
The relevant dimension switched throughout the run so participants were required to remain alert for the occurrence of switch trials which would require them to shift their attention. A particular dimension was relevant for 3 to 5 trials before a switch occurred. In total, 6 different trial types were included in the experiment. Switch trials were trials in which the relevant dimension changed from what was previously relevant. Repeat 1 was the first trial following the switch in which the relevant dimension repeated for the first time. Trials in which the relevant dimension repeated for the second time were referred to as repeat 2, followed by repeat 3, repeat 4, and repeat 5 which was the fifth time that the relevant dimension repeated.
were also an equal number of congruent and incongruent, and colour- and motion-relevant trials in each of the 6 trial types mentioned above. To desynchronize the timing of events with respect to the acquisition of brain slices and to ensure requisite variability in signal time courses to permit event-related modelling, inter-trial
intervals (ITI) of different durations were included, ranging from 3000-7000ms with a mean ITI of 5000ms. An additional sixty-two null events, the timing of which
equalled that of the task events, were distributed randomly across the two runs. During null events, participants maintained fixation and no response was required. These events were included to increase the variability in signal time courses to allow for event-related modelling.
Subjects practiced both the task switching and localizer tasks before the main experiment commenced and all reported that they understood the task and were ready to proceed. All stimuli were projected from a Windows PC running E-Prime 2.0 software (Psychology Software Tools, Pittsburgh, PA) at a resolution of 1024 x 768. Stimuli were projected onto the centre of a screen which was mounted outside of the magnet. Participants viewed the display through a mirror which was placed above the head coil. The visual display was 15cm in height and 20cm in width and was located 25cm away from the mirror, which subtends approximately 43.6° of visual angle.
2.4 fMRI Data Acquisition
Functional and structural images were collected using a 3-Tesla Siemens Tim Trio scanner, using a Siemens 32-channel head coil. T2*- weighted functional scans were acquired using an echo-planar imaging pulse sequence. Thirty seven slices per volume were collected using an ascending, interleaved slice acquisition order which provided coverage of the whole brain (repetition time (TR) = 2000 ms, echo time (TE) = 30 ms, FOV = 210mm x 210mm, flip angle = 90 degrees, 70x70 matrix, 3x3x3mm voxel resolution). A high-resolution anatomical scan (192 slices,256 x 256 matrix, 1 x 1 x 1 mm voxel resolution) was also obtained from each participant using a 3D pulse sequence weighted for T1 contrast.
2.5 fMRI Data Preprocessing
and temporal high-pass filtering (GLM with Fourier basis set, 2 cycles) were also performed. T1-weighted anatomical scans were aligned to the ACPC axis, and normalized to Talairach and Tournoux (1998) stereotaxic space. Each functional image was then coregistered to the participant’s anatomical image, transformed into Talairach space, and finally smoothed using an 8 mm full width at half maximum Gaussian smoothing kernel.
2.6 fMRI Analysis
2.6.1 Whole Brain Analysis
In order to test the first hypothesis, an initial analysis was run to determine which brain areas showed evidence of switch-related activity. A random-effects general linear model (GLM) analysis was applied to the functional data collected during the two task switching runs using separate regressors for colour switch trials, motion switch trials, colour repeat trials, and motion repeat trials. Separate regressors were also included for both error and post-error trials. Regions that showed switch-related activity were identified with the contrast of the estimates of the beta
coefficients of switch and repeat predictors. The resulting map was corrected for multiple comparisons by means of a random-field theory based estimate of false-discovery rate (FDR), where q (FDR) < 0.03. For all event-related predictors, epochs spanning the entire duration of the stimulus presentation were convolved with a sum of two gammas model of the hemodynamic response function (HRF).
2.6.2 Region of Interest Analyses
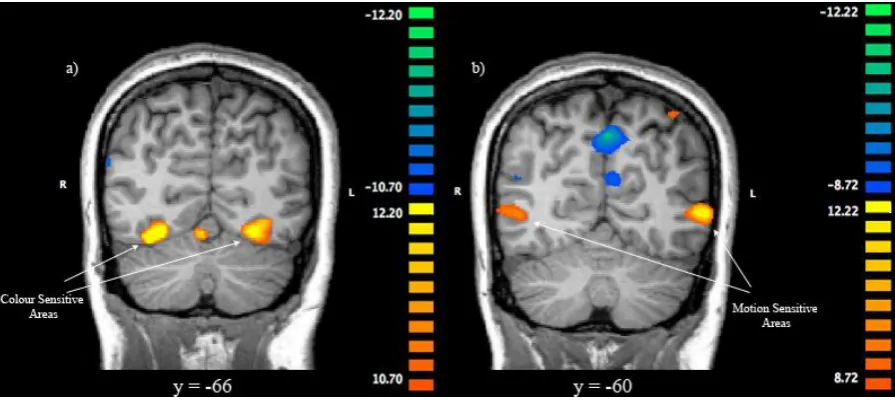
identified subject-wise by means of a colour-motion localizer. In order to identify these ROIs, BOLD responses in the localizer were estimated by means of a GLM with separate regressors for motion blocks, colour blocks, and stationary gray dot rest blocks. To identify area V5, the beta coefficient estimate for motion was contrasted against the stationary dots. Regions of interest in the left and right hemisphere were defined as regions in which this difference was significantly greater than zero and whose Talairach coordinates corresponded with anatomical estimates of the localization of V5 (Dumoulin et al., 2000; Watson et al., 1993). Similarly, V4 was identified by contrasting the beta coefficient estimate for colour against the stationary gray dots. V4 ROIs in the left and right hemisphere were defined as regions in which this difference was significantly greater than zero, and whose Talairach coordinates corresponded with previous estimates of the localization of V4 (McKeefry & Zeki, 1997; Schoenfeld et al., 2007). Statistical thresholds for both of these contrasts were set at an individual subject level, but all thresholds were less than q (FDR) < 0.05. Activity within these ROIs formed the basis for subsequent analyses.
trials while late repeat trials were a combination of repeat 3, 4, and 5 trials. Due to the similarity in beta values, betas extracted from V4 in the left and right hemisphere were collapsed, as were the betas extracted from the left and right hemispheres comprising area V5.
In order to assess the third hypothesis with regards to differences in the level of competition between area V4 and V5 across trial type, the beta weights of area V4 and V5 were normalized so that they could be directly compared. The beta weights from area V4 and area V5 were z-normalized, using the equation z =
, where x was
the raw score to be standardized, was the mean of the beta weights in the relevant brain region, and sd was the standard deviation of those beta weights. Before the difference scores were calculated, the relationship between these brain regions and their activation patterns based on which dimension was relevant was explored using a 3 (trial type; early repeat, late repeat, switch) x 2 (dimension; colour-relevant versus motion-relevant) x 2 (Brain Region; area V4 versus area V5) repeated measures ANOVA.
As an index of competition, difference scores were then calculated in order to determine whether the difference in brain activity between area V4 and V5 differed across trial types depending on whether colour or motion was relevant. When colour-relevant trials were investigated, difference scores were calculated as the beta weight from area V5 subtracted from the beta weight from area V4. When motion-relevant trials were investigated, difference scores were calculated as the beta weights in V4 subtracted from those beta weights extracted from V5. These difference scores were then subjected to a repeated-measures ANOVA to determine if the level of
Following this, the second part of hypothesis 3 was then investigated. In order to assess differences in the degree of modulation within a particular extrastriate region across trial type, difference scores were again calculated for each individual subject. Since these differences were between colour and motion relevant trials within a particular brain region, the non-normalized data was used. When difference scores were calculated in area V4, beta weights associated with trials in which the participant was to ignore colour were subtracted from those associated with trials in which the participants should attend to colour. Similarly, when difference scores were calculated in area V5, beta weights associated with trials in which the participant was to ignore motion were subtracted from those associated with trials in which they were to attend to motion. These difference scores were then subjected to a repeated-measures ANOVA to determine if the degree of modulation differed across trial type such that modulation was smallest on switch trials and largest on later repeat trials.
2.6.3 Follow-up Analyses
right hemisphere were defined as regions in which this difference was significantly greater than zero and whose Talairach coordinates corresponded with anatomical estimates of the localization of area V5 (Dumoulin et al., 2000; Watson et al., 1993). Statistical thresholds for this contrast were set at an individual subject level, but all thresholds were less than q (FDR) < 0.05. Activity within these ROIs formed the basis for subsequent analyses.
The separate regressors created for the original analysis for all levels of trial type (repeat 1-5, switch), congruency (congruent/incongruent), and dimension (colour-relevant/motion-relevant) as well as variables of non-interest (error, post-errors trials) were utilized once again. Estimates of the beta coefficients of these predictors were computed in the context of a whole-brain RFX GLM. Beta coefficient estimates were then extracted from the 2 subject-level ROIs created using the task switching runs (left V5 and right V5) and compared offline by means of a 3 (trial type; early repeat, late repeat, switch) x 2 (congruency; congruent versus incongruent) x 2 (dimension; colour-relevant versus motion-relevant) repeated-measures ANOVA. Due to the similarity in beta values, betas extracted from V5 in the left and right hemisphere were collapsed.
In order to determine if the V5 ROIs defined by the localizer analysis were in different locations than the V5 ROIs defined using the task switching runs, the Euclidean distance between the peak voxels of area V5 as defined by these two different methodologies was calculated. The equation used to calculate the Euclidean distance between the coordinates can be seen below.
2.6.4 Psychophysiological Interaction Analysis
One important question that remains is whether the enhanced response in area V4 to colour stimuli was a result of top-down modulation from frontal and parietal areas as suggested by hypothesis four. If this were the case, regions involved in top-down modulation would show increased connectivity with V4 when participants were attending to colour as compared to when they were ignoring colour. To address this, a psychophysiological interaction analysis (PPI) was conducted. A PPI analysis can determine whether the correlation in activity between distinct brain regions is
different in different psychological contexts (Friston et al., 1997). Regions across the entire brain can be identified whose activity is more highly correlated with a specified seed region in one experimental condition compared to another.
To conduct this analysis, two seed regions were created in each subject; left V4 and right V4. These seed regions were defined using the peak coordinates of area V4 from each hemisphere yielded from the localizer analysis (coloured dots >
Chapter 3 – Results
3.1 Behaviour
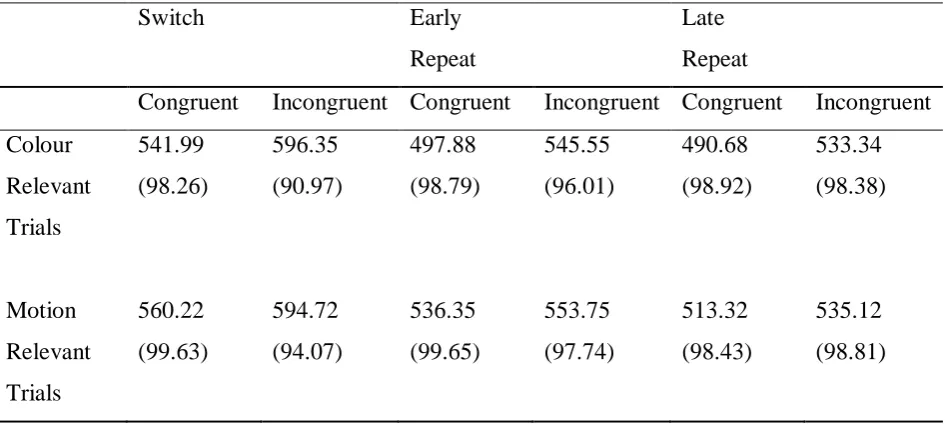
Response time and accuracy data are displayed in Table 1. A 3 (trial type; early repeat, late repeat, switch) x 2 (congruency; congruent versus incongruent) x 2 (dimension; colour-relevant versus motion-relevant) repeated-measures ANOVA showed a significant switch cost for both reaction time, F (1.2, 19.8) = 40.97, p <.001, and accuracy, F (2, 34) = 10.39, p <.001. Bonferroni-corrected post-hoc tests revealed that participants were significantly faster and more accurate at responding to early and late repeat trials than to switch trials. They were also significantly faster at responding to late repeat trials than early repeat trials. There was a main effect of congruency for both reaction time, F (1, 17) = 34.71, p = .001, and accuracy, F (1, 17) = 42.77, p
<.001, with participants responding more rapidly and more accurately to congruent trials relative to incongruent trials. While participants responded at a similar speed to both colour and motion-relevant trials, they were significantly more accurate on the motion-relevant trials (F (1, 17) = 4.66, p = .046). For accuracy, a significant trial type by congruency interaction was also found, F (2, 34) = 23.81, p <.001.
Table 1
Mean response times (ms) and accuracy (in %; in parentheses) across trial types,
congruency, and relevant dimension.
Switch Early
Repeat
Late Repeat
Congruent Incongruent Congruent Incongruent Congruent Incongruent Colour Relevant Trials 541.99 (98.26) 596.35 (90.97) 497.88 (98.79) 545.55 (96.01) 490.68 (98.92) 533.34 (98.38) Motion Relevant Trials 560.22 (99.63) 594.72 (94.07) 536.35 (99.65) 553.75 (97.74) 513.32 (98.43) 535.12 (98.81) 3.2 fMRI
3.2.1 Whole Brain Analysis
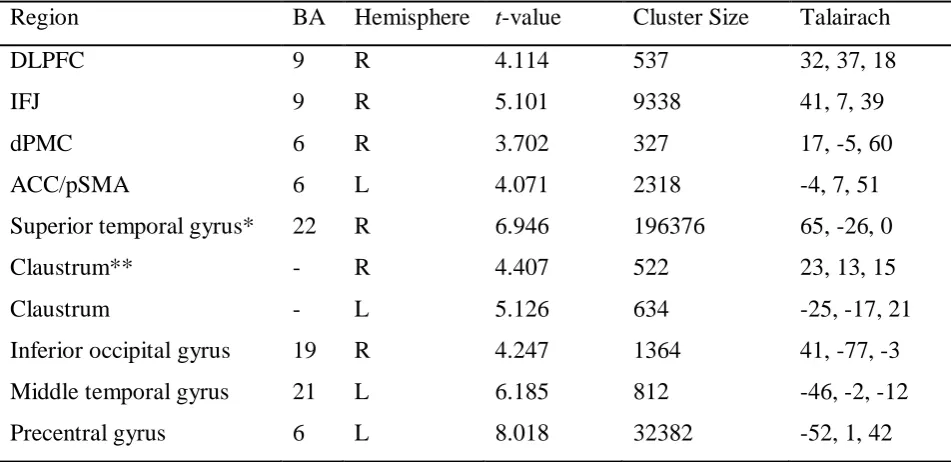
Table 2
Brain regions more activated during task switch trials than task repeat trials.
Region BA Hemisphere t-value Cluster Size Talairach
DLPFC 9 R 4.114 537 32, 37, 18
IFJ 9 R 5.101 9338 41, 7, 39
dPMC 6 R 3.702 327 17, -5, 60
ACC/pSMA 6 L 4.071 2318 -4, 7, 51
Superior temporal gyrus* 22 R 6.946 196376 65, -26, 0 Claustrum** - R 4.407 522 23, 13, 15 Claustrum - L 5.126 634 -25, -17, 21 Inferior occipital gyrus 19 R 4.247 1364 41, -77, -3 Middle temporal gyrus 21 L 6.185 812 -46, -2, -12 Precentral gyrus 6 L 8.018 32382 -52, 1, 42 Talairach coordinates are for the peak voxel within each cluster. Cluster size is
measured in mm3.
* this was a large bilateral cluster also encompassing superior and medial parietal cortex.
Figure 3. Neural regions showing greater activation during task switch trials than task repeat trials, q (FDR) < .03.
3.2.2 ROI Analyses
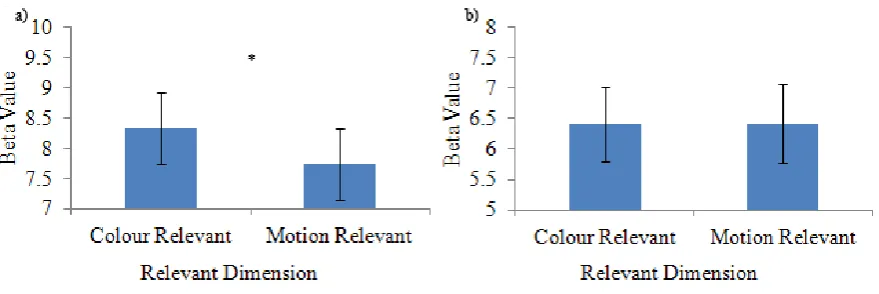
al., 2000; McKeefry & Zeki, 1997; Watson et al., 1993). The location of each ROI in an example subject can be seen in Figure 4. When area V4 was examined using a 3 x 2 x 2 repeated measures ANOVA, a main effect of trial type emerged, F (2, 34) = 10.81, p < .001, such that activity was significantly greater on switch trials than early repeat trials, and activity was also significantly greater on late repeat trials than early repeat trials as determined by Bonferroni-corrected post-hoc tests (Figure 5a). A main effect of dimension was also observed in area V4, F (1, 17) = 10.20, p = .005. As expected, participants displayed significantly greater activation in this region on colour-relevant trials than on motion-relevant trials (Figure 6a).
The same 3 x 2 x 2 repeated measures ANOVA was run on the beta estimates extracted from area V5, and a main effect of trial type was found, F (2, 34) = 9.15, p
= .001. Bonferroni-corrected post-hoc tests revealed that activation in area V5 was significantly higher on switch trials than early repeat trials (Figure 5b). There was however, no main effect of dimension in this area, F (1, 17) = .005, p = .944, and thus no modulation based on attention (Figure 6b). Similarly, no significant interactions were found. Congruency did not have an effect in either V4 or V5.
Figure 5. Mean beta weights from category specific extrastriate regions a) V4 and b) V5 depicting the main effect of trial type. Bars indicate standard error of the mean.
Figure 6. Mean beta weights from category specific extrastriate regions a) V4 and b) V5 depicting the main effect of dimension. Bars indicate standard error of the mean.
repeat trials, the data were normalized so that activity from area V4 could be directly compared to that of area V5. Before getting to the question of whether competition between the regions differs across the trial types, these normalized beta weights were explored across the two brain regions to see how they interact. In order to explore the relationship between area V4 and V5 and their activation patterns based on which dimension was relevant, a 3 x 2 x 2 repeated measures ANOVA was conducted on the normalized beta weights. This analysis revealed a main effect of trial type, F (2, 34) = 11.39, p <.001. Bonferroni-corrected post-hoc tests revealed that activity was
significantly higher on switch trials than early repeat trials, and activity was also significantly higher on late repeat than early repeat trials. This result was to be expected and merely replicates the findings from the non-normalized betas. This ANOVA also revealed a significant interaction between dimension and brain area, F
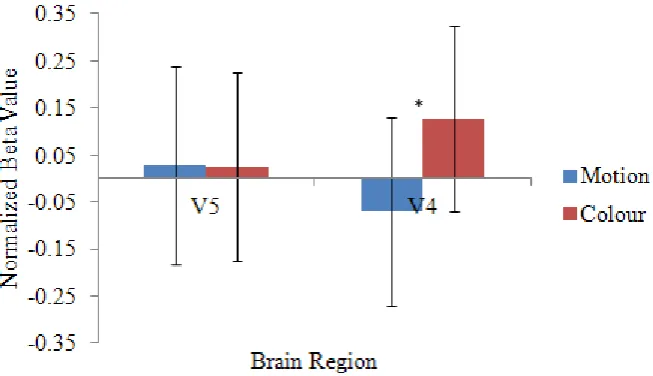
(1, 17) = 20.09, p <.001. Bonferroni-corrected post-hoc simple effects tests revealed that for area V5, there was no significant difference in brain activity when motion was relevant versus when colour was relevant. In contrast, in area V4, this difference was significant. Participants showed significantly higher activity in area V4 when they were attending to colour than they did when they were attending to the motion of the stimulus. This interaction is depicted in Figure 7 and highlights the finding
Figure 7. Normalized beta weights from category specific extrastriate regions, showing the significant interaction of trial type and dimension.
In order to determine whether there were differences in the level of activation between area V4 and area V5 across the different trial types, as an index of
competition, difference scores were calculated on the normalized betas. The proposed hypotheses for this analysis are depicted in Figure 1. When motion was relevant, difference scores were calculated as the beta weight in area V4 subtracted from the beta weight in area V5. When colour was relevant, the difference score was calculated as the beta weight in area V5 subtracted from the beta weight in area V4. Such
difference scores for the motion-relevant trials can be seen in Figure 8b. The repeated measures ANOVA conducted on these difference scores also indicated that there were no significant differences between the difference scores across trial type, F (2, 34) = .99, p = .38. This analysis on the normalized beta weights from area V4 and V5 indicates that contrary to the third hypothesis, there does not seem to be any difference in the magnitude of competition between switch and repeat trials. Thus, none of the proposed hypotheses from Figure 1 appear to be supported. It seems instead that competition between area V4 and V5 does not play a role in the generation of switch costs since competition between these regions is similar regardless of whether the trial is a switch or a repeat trial.
Figure 8. a) Normalized beta weights for the colour-relevant trials depicting the relationship between trial type and activity in area V4 and V5. The numerical values displayed in the graph indicate the difference in beta values between area V4 and area V5. b) Normalized beta weights for the motion-relevant trials depicting the
The third hypothesis also postulated that if a difference in the degree of competition between V4 and V5 did not exist, perhaps differences in the level of modulation within these regions would differ across trial type, and perhaps this would shed some light on switch costs. Contrary to this hypothesis, no significant interaction of trial type by dimension was found in either area V4 or V5 as described above. This result indicated that there was no difference in modulation across the various trial types. In order to delve into this question further, difference scores were calculated on the beta weights from both area V4 and V5 to verify that there was indeed no
difference in the magnitude of modulation between switch and repeat trials. These difference scores in area V5 were calculated as the beta value for colour-relevant trials subtracted from the beta for motion-relevant trials. For area V4, the difference score was calculated as the beta for motion-relevant trials subtracted from that for colour-relevant trials. Difference scores were calculated separately for each different level of trial type.
Figure 9.a) Mean beta weights from area V4 depicting the relationship between dimension and trial type. The numerical values displayed in the graph indicate the difference in beta values between attend colour and ignore colour conditions. b) Mean differences scores across the different trial types. These scores were not significantly different from each other. Bars indicate standard error of the mean.
3.2.3 Follow-up Analyses
Since no modulation was found in area V5 contrary to the second hypothesis, additional analyses were run to see if this was due to the way in which area V5 was defined in the current study. To determine if this was indeed the case, new V5 ROIs were defined using the task switching runs similar to the methodology used in previous studies (Liston et al., 2006; Liu et al., 2003). Using a statistical threshold of
q(FDR) < 0.05, only 7 of the 18 participants showed activation of area V5 in the contrast of motion trials greater than colour trials during the switching task. The betas extracted from these 7 participants were examined in more depth using a 3 x 2 x 2 repeated measures ANOVA. A main effect of trial type emerged, F (2, 12) = 20.6, p < .001, such that activity was significantly higher on switch trials than early repeat trials, and activity was also significantly higher on late repeat trials than early repeat trials as determined by Bonferroni-corrected post-hoc tests (Figure 11b). This result replicates the main effect that was found when the localizer was used to define area V5. A main effect of dimension was also observed in area V5, F (1, 6) = 87.06, p
Figure 11. Mean beta weights from area V5 as defined using the task switching runs depicting the main effect of a) dimension and b) trial type. Bars indicate standard error of the mean.
Table 3
Comparison of the mean location of V5 activation from the localizer and task
switching runs.
Localizer Run Task Switching Runs Distance Between Peak Voxels (mm) Motion > Stationary Motion > Colour
Left V5 -48, -67, 2 -42, -59, 5 10.44 Right V5 43, -66, 1 42, -68, 2 2.45 Mean Talairach coordinates are for the peak voxel within each region.
3.2.4 Psychophysiological Interaction Analysis
Table 4
Brain areas showing significant connectivity with area V4 during the attend colour
condition compared with the ignore colour condition.
Brain Region BA Hemisphere Z Score Cluster Size Talairach Supramarginal/Angular Gyrus 40 L 5.12 294 -40, -50, 36 Supramarginal/Angular Gyrus 39 R 4.29 78 45, -53, 31 Inferior Frontal Junction 6 R 4.56 15 30, 8, 43 Inferior Frontal Gyrus 44 L 4.16 22 -56, 17, 10 Middle Frontal Gyrus 46 R 4.33 26 54, 28, 25 Anterior Cingulate Cortex 32 L 4.32 19 -15, 17, 40 Anterior Cingulate Cortex 32 R 4.07 7 16, 24, 34 Precentral Gyrus 6 L 4.71 41 -37, -7, 34 Cingulate Gyrus 24 L 4.17 14 -1, -24, 36 Posterior Cingulate Cortex 30 L 4.03 8 -26, -66, 11 Substantia Nigra - R 5.08 52 7, -19, -13 Superior Temporal Gyrus 22 R 5.17 107 34, -54, 14
Cuneus 18 L 4.33 13 -18, -86, 21
Lingual Gyrus 17 L 5.24 115 -14, -81, 1 Lingual Gyrus 18 R 4.09 14 10, -81, 1 Talairach coordinates are for the peak voxel within each cluster. Cluster size is
Chapter 4 – Discussion
4.1 Task-Switching and the Cognitive Control Network
This study sought to examine whether attentional modulation could be observed in colour area V4 and motion area V5 in the context of task switching. Modulation in these category specific extrastriate regions has been found during selective attention tasks and during more cognitively demanding working memory tasks. However, to date, no study has examined modulation in area V4 and V5, as defined by an independent functional localizer in the context of task switching. In order to examine whether such modulation takes place, participants performed a switching task during fMRI scanning. Behaviourally, participants performed as expected, displaying the switch costs that are a hallmark of human performance on such tasks (Kiesel et al., 2010; Vandierendonck et al., 2010). Participants were significantly slower and more error prone on switch trials when they were required to shift attention from one feature dimension to another as compared to repeat trials when they attended to the same dimension across multiple trials.