Discrimination of Epileptic and Normal EEG
Using Euclidean Distance Method
Sangeetha Prasannaram
1, Chaitali Prabhudesai
2Associate Professor, Dept. of Instrumentation & Control Engineering, VESIT, Mumbai, Maharashtra, India 1 PG Student, Dept. of Instrumentation & Control Engineering, VESIT, Mumbai, Maharashtra India 2
ABSTRACT: The Electroencephalograph (EEG) signal is widely used to analyse neural activity within the human brain for detection of abnormalities like Epilepsy, sleep disorders, tumor and encephlopathies. Epilepsy is a group of related disorders characterized by a tendency for recurrent seizures. In this paper we have tried to classify normal and epileptic EEG using the Euclidean distance method. The dataset for both normal and epileptic conditions has been obtained for a group of patients in varied age groups. This EEG data is analysed using the Welch method of power spectrum density. The Welch method is useful for estimating the maximum power of the signal at different frequencies. Then Euclidean distance analysis is performed on this feature and classification is done.
KEYWORDS: Brain Waves, Epilepsy, Power Spectrum Density, Euclidean Distance.
I.INTRODUCTION
EEG or Electroencephalogram is used to represent the electrical activity of the brain. The brain generates rhythmical potential charges, which can be picked up with by suitably placing surface electrodes on the scalp. [5]
These recordings demonstrate that there is continuous electrical activity in the brain. Both the intensity and pattern of this electrical activity depends upon level of excitation of different parts of brain resulting from sleep, wakefulness or brain disease such as epilepsy. [1]
Monitoring the EEG has proven to be an effective method of diagnosing many neurological illness and diseases such as epilepsy, tumour, cerebrovascular lesions, sleep disorders and problems associated with trauma. [2]
Although today there are other methods to measure brain activity such as functional magnetic resonance imaging (fMRI), positron emission tomography (PET), EEG remains one of the most widely used, primarily due to its relatively low cost ,wide availability, high temporal resolution, and frequency specification [3]
II.LITEARTURE SURVEY A. Physiological Background
The human brain contains around 100 billion nerve cells. These nerve cells, or neurons, carry out the functions of the brain and make thought possible. They operate by sending electrical signals to one another. [3] Each neuron produces electrical activity based on its own independent cellular basis, and is continually interacting with other neurons within a local network and via long range interactions [6] This exchange involves the passing of anions and cations through the membranes of the neurons, causing a change in electric potential that can be measured.
B. Brain Waves
Electrical recordings are obtained from the surface of the brain or even from the outer surface of the head with the help of scalp electrodes using the 10-20 electrode system. These recordings demonstrate that there is continuous electrical
activity in the brain [1] The characteristic of the EEG signal may change in many different situations, particularly with level of vigilance, alertness, rest, sleep and dream [5] The undulations in the recorded electrical potentials are called brain waves .
The intensities of brain waves recorded from the surface of the scalp range from 0 to 200 microvolt, and their
frequencies range from once every few seconds to 50 or more per second.
Fig.1 Brain waves [8]
C.Epilepsy
Epilepsy (also called "seizures") is characterized by uncontrolledexcessive activity of either part or all of the central nervous system. These seizures lead to a discharge in the brain, generating a disturbance in the EEG [7]
A person who is predisposed to epilepsy has attacks when the basal level of excitability of the nervous system (or of the part that is susceptible to the epileptic state) rises above a certain critical threshold. As long as the degree of
excitability is held below this threshold, no attack occurs [1].
Epilepsy has many possible causes. It could be illness, brain injury and abnormal brain development. In many cases, the cause is unknown. The analysis of EEG looking for these spikes over background activity is the main method of epilepsy diagnosis and treatment [7]
III.EEG WAVEFROM ANALYSIS
Classifying EEG data is an important part of brain research, and creates a basis for understanding causes and treatments of disorders. [7] In order to classify the EEG dataset features are from the data These features are then fed into a pattern classification algorithm in an attempt to correctly classify the data as being normal or epileptic.
A. Data obtained
For the analysis of EEG waveform for normal and epileptic conditions, EEG dataset has been obtained from the EEG Department of Shushrusha Hospital; Dadar (w).The data obtained is for the following EEG conditions:
Normal EEG ( 4 patients)
Epileptic EEG (7 patients)
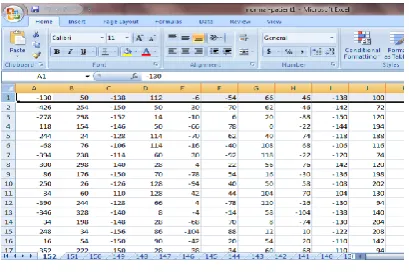
Fig. 2 Normal EEG data (single page)
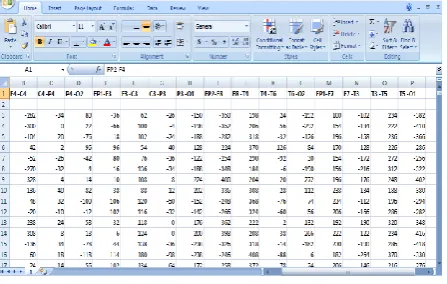
Fig. 3 Epileptic EEG Data (single page)
Each page of the data is then exported to an excel worksheet .Each channel of the EEG recording will appear as a column in the excel worksheet. Thus the excel worksheet contains 16 columns to represent 16 channels of EEG. Since the sampling rate of the EEG data is 256 there are 2560 rows in the excel worksheet. Thus dimension of each excel worksheet are 2560 *16
B .Methodology: The software used for the project is the Matlab Software. The following analysis is done on the given dataset.
1. Power spectral Density: The EEG data is pre-processed and analysed using the Welch method of power spectrum density for both the normal and epileptic dataset. Power spectral density (Psd) describes how the power of a signal or time series is distributed over the different frequencies. Here, power can be the actual physical power, or more often, for convenience with abstract signals, can be defined as the squared value of the signal. The power spectral density is defined as the DTFT of the covariance sequence.
Welch's method splits the data into overlapping segments, computes modified periodograms of the overlapping segments, and averages the resulting periodograms to produce the power spectral density estimate. The power spectral density is calculated in units of power per radians per sample. The corresponding vector of frequencies w is computed in radians per sample.
Thus here for the given dataset the powers spectral density is calculated per page for excel worksheet i.e for a matrix of dimension (2560*16). The resulting output of the Power spectral density for each page is a matrix of dimension (513*16) .Further the addition of all the 513 rows is done so that the output is reduced to a matrix of dimension ( 1*16 ) per page. The same procedure is carried out for all the remaining pages. Later the result of all the pages is combined together and saved. Thus if there are 152 pages in the dataset of a patient the output will be a matrix of dimension (152*16).
The above analysis is carried out for all the normal as well as epilepsy patients
Fig. 5 patient 1 data as a excel worksheet
2. Euclidean Distance: Euclidean distance is the distance between two points defined as the square root of the sum of the squares of the differences between the corresponding coordinates of the points; for example, in two-dimensional Euclidean geometry, the Euclidean distance between two points a = (a1,a2)and b = (b1,b2) is defined as: d(a ,b)= (𝑎1 − 𝑏1)2+ (𝑎2 − 𝑏2)2
Here the Euclidean distance analysis is performed on the PSD result obtained for each patient in the database.
For the Euclidean distance analysis 1st the dataset (PSD output) of one normal patient is treated as the test data. The PSD output of the all the remaining patients normal as well as epilepsy belong to the combined dataset. The test patient’s data is compared with every patient in the combined dataset using the Euclidean distance method. Thus the Euclidean distance is calculated by comparing the 1st row in the test patient’s data with each row of 1st patient in the database, similarly the 2nd row in the test patient’s data is compared with each row of 1st patient in the database and the same process of comparison is continued with the remaining rows of the test patient’s data. Thus if the test patients data has dimensions( 200*16) whereas the 1st patients data in the combined dataset has dimensions (256*16) the output of the Euclidean distance analysis will be a matrix of dimension (200*256). The minimum value of Euclidean distance is found per row. Thus we get a matrix of dimension (200*1). Now addition of all the rows is done to get a single minimum Euclidean distance result for comparison between the test patient and 1st patient in the database. Similarly the minimum Euclidean distance is also calculated between the test patient and the 2nd patient in the data base .The process continues till the test patient’s data is compared with all the patients in the combined dataset.
After this comparison the minimum Euclidean distance between the test patient and the nth patient in the database will give the closet match for the test patient. If the patient under test is a normal patient then the closet matching patient comes out to be a normal patient. The same is true for an epilepsy patient also.
Test patient data
⁞ Test Patient Data ⁞ Patient 1 of combined dataset
Test Patient Data Patient 10 of combined dataset
Patient 1 Patient 2 ⁞ Patient 10 R C
1 2 ……. 16
1 1,1 1,2 ……. 1,16
2 ⁞
2,1 2,2 ……. I 2,16
200 200,1 200,2 …… 200,16
R C
1 2 ……. 16
1 1,1 1,2 …… 1,16
2 ⁞
2,1 2,2 ……. I 2,16
256,1 256,1 256,3 ……. 256.16
R C
1 2 ……. 16
1 1,1 1,2 ……. 1,16
2 ⁞
2,1 2,2 ……. I 2,16
200 200,1 200,2 …… 200,16
R C
1 2 ……. 16
1 1,1 1,2 …… 1,16
2 ⁞
2,1 2,2 ……. I 2,16
IV.RESULT
The Euclidean distance result for two test patients out of which one is a normal patient and the other is epileptic is tabulated below.
Table 1 Euclidean distance result of Normal patient 1 with the entire database
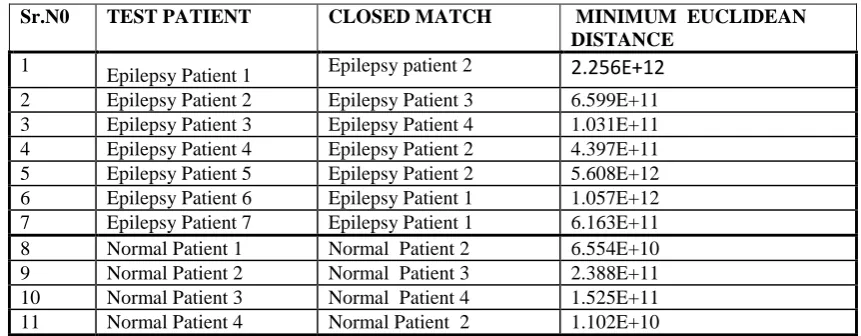
As seen from the above table we get the minimum Euclidean distance of 6.55E+10 for the Normal Patient 1 with the Normal Patient 2.Thus the closest matching patient for normal patient 1 is Normal patient 2.Similarly the closest matching patients for all the normal test patients comes out to be a normal patient from the database.
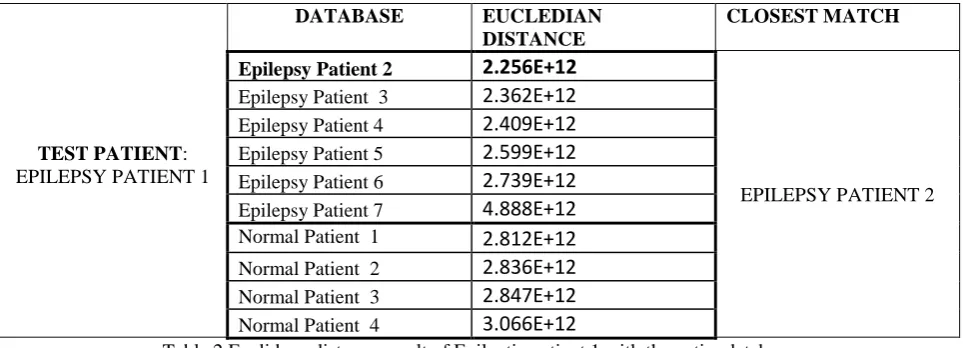
TEST PATIENT: EPILEPSY PATIENT 1
DATABASE EUCLEDIAN
DISTANCE
CLOSEST MATCH
Epilepsy Patient 2
2.256E+12
EPILEPSY PATIENT 2 Epilepsy Patient 3
2.362E+12
Epilepsy Patient 4
2.409E+12
Epilepsy Patient 52.599E+12
Epilepsy Patient 62.739E+12
Epilepsy Patient 74.888E+12
Normal Patient 12.812E+12
Normal Patient 22.836E+12
Normal Patient 32.847E+12
Normal Patient 43.066E+12
Table 2 Euclidean distance result of Epileptic patient 1 with the entire database
The test patient taken now is an epileptic patient, and its minimum Euclidean distance with the entire database is calculated. We get the minimum Euclidean distance of 2.256E+12 for the Epilepsy Patient 1 with the Epilepsy patient 2.Thus the closest matching patient for Epilepsy patient 1 is Epilepsy patient 2.Similarly the closest matching patients for all the epileptic test patients comes out to be a epileptic patient from the database.
Similarly the results for all the patients in the database are displayed in the table given below. From the results
tabulated below we can see that Euclidean distance method helps us to correctly classify the given patients as normal and epileptic.
TEST PATIENT:
NORMAL PATIENT 1
DATABASE EUCLEDIAN DISTANCE CLOSEST MATCH
Epilepsy Patient 1 6.561E+10
NORMAL PATIENT 2 Epilepsy Patient 2 8.261E+10
Epilepsy Patient 3 8.989E+10 Epilepsy Patient 4 1.433E+11 Epilepsy Patient 5 3.598E+11 Epilepsy Patient 6 4.449E+11 Epilepsy Patient 7 2.543E+12
Normal Patient 2 6.554E+10
Table 3 Euclidean distance result of the entire database
The classification of patients as normal or epileptic is done here for a database of 11 patients out of which 4 are normal and 7 are epileptic. From the above obtained results we can see that for this database the percentage of result obtained is hundred percent.
V.CONCLUSION
The EEG is an important clinical tool for diagnosing, monitoring and managing neurological disorder. Detecting and classifying the EEG record is a complex and time consuming operation. Also such EEG records require highly trained professionals who are in general small in number. [4] Hence there is a requirement for automatic analysis and classification of EEG. Thus in this paper we have used the Welch method of power spectrum density and Euclidean distance method for classification of EEG for a group of 11 patients for which the result obtained is 100 percent. In future we wish to extend this analysis for more no of patients and verify that similar results are obtained.
REFERENCES [1] Guyton & hall, “Textbook of medical physiology”.11th Edition
[2] R.S.Khandpur “Handbook of Biomedical Instrumentation” Tata McGraw-Hill.2nd Edition
[3] Chestnutt, Catherine. "Feature Generation of EEG Data Using Wavelet Analysis.",Thesis, Texas Tech University,May, 2012
.
[4] H. N. Suresh1 and Vinay Balasubramanyam, “Wavelet Transforms and Neural Network Approach for Epileptical EEG”3rd
IEEE International Advance Computing Conference (IACC), pp.12-16, 2013.
[5] Rosni Abu Kassim, Ahmad Shahran Ibrahim, Norlida Buniyamin, Zunairah Hj Murat, Indonesia, “Analysis of Human’s Brainwave Pattern among Active and Inactive Person”, International Conference on System Engineering and Technology, pp.421-425, 2012. [6] Stephen Fried,Solomon L. Moshé,”Basic physiology of the EEG” ,Neurology Asia,vol.16,Issue S,p23,2011.
[7] Algimantas Juozapaviciusa, Gytis Baceviciusa, Dmitrijus Bugelskisa,Ruta Samaitien,“EEG analysis-
automatic spike detection”,Nonlinear Analysis: Modelling and Control, Vol. 16, Issue No. 4, pp.375–386,2011.
[8] Carlos Guerrero-Mosquera1, Armando Malanda Trigueros2 and Angel Navia-Vazquez1, “EEG Signal Processing for Epilepsy” Epilepsy - Histological, Electroencephalographic and Psychological Aspects, ISBN: 978-953-51-0082-9, InTech, pp.49-74, 2012
Sr.N0 TEST PATIENT CLOSED MATCH MINIMUM EUCLIDEAN
DISTANCE
1