Available online: http://edupediapublications.org/journals/index.php/IJR/ P a g e | 860
Modeling And Analysis Of Electrical Discharge Michining
Process Parameters Using Fuzzy Logic
O. Rajender1, Mahender Koduri2 & M. Bhargav3
1,2Asst. Professor Department of Mechanical Engineering, Anurag Group of Institution (cvsr),
Gatkeshar, Hyderabad, Telangana, India,
3 Asst. Professor Department of Mechanical Engineering, VNRVJIET Bachupally,
Hyderabad, Telangana, India.
Abstract:
Electrical Discharge machining (EDM) is a non-traditional machining process where intricate and complex shapes can be machined. Only electrically conductive material can be machined by this process and is one of the important machining processes for machining high strength alloys. For achieving the best performance of the EDM process, it is crucial to carry out parametric design responses such as material removal rate, tool wear rate, and surface roughness. For the work piece material is conducted by taking three levels of the peak Current, Pulse on time and Pulse off time and Voltage on Hastelloy C-276 by using electrode as copper material. It is essential to consider number of input parameters such as current, voltage, Pulse on time, Pulse of time etc., to get the better result of responses.
In this paper Fuzzy Logic technique, Modeling of experiments, analysis of variance is used to select the parameters of experimentation for EDM process of very hard and tough materials such as Hastelloy C-276. This is not possible to machine by the conventional machining process planning of experiments is based on a Box Behnkine Design and analysis of variance to determine an optimal setting. The process parameters include four control factors those are current, pulse on time, pulse off time,
Voltage. The performance parameters are MRR, TWR and SR are selected as the evaluation criteria in this study.
This study investigates the model of EDM process is developed by using Fuzzy logic, which can be used to predict the process parameters. The datasets used in modeling study will be taken from experimental study. According to the results of estimating the parameters of all models will be compared in terms of statistical performance.
Keywords:
Hastelloy C-256, Material removal rate, Tool wear rate, copper electrode, Design of Experiment, Fuzzy logic.
1.
Introduction
Electrical discharge machining is considered as one of the main non-conventional machining processes used for manufacturing geometrically complex or hard material parts that are extremely difficult to machine by conventional machining processes. New developments in the field of material science have lead to new engineering metallic materials, composite materials, and ceramics, having good mechanical properties and thermal characteristics as well as sufficient electrical conductivity so that they can readily be machined by spark erosion. Electrical discharge machine (EDM) technology is increasingly being used in tool, die and mould making industries, for machining of heat treated tool steels and advanced materials (super alloys, ceramics, and metal matrix composites) requiring high precision, complex shapes and high surface finish.
Available online: http://edupediapublications.org/journals/index.php/IJR/ P a g e | 861
off time, voltage, current and duty factor are the optimized with considerations of the multiple performance characteristics MRR, TWR and SR.
Rajyalakshmi.G, Venkata Ramaiah. P [2] the study on the Optimization of Process Parameters of Wire Electrical Discharge Machining Using Fuzzy logic integrated with Taguchi Method. This paper discusses the application of the Taguchi method with fuzzy logic to optimize the machining parameters for Wire electrical discharge machining of Inconel 825 with multiple characteristics. A multi-response performance index (MRPI) was used for optimization. The machining parameters viz., pulse on time, pulse off time, corner servo voltage, flushing pressure, wire feed, wire tension, spark gap voltage, servo feed were optimized with consideration of multiple performance characteristics. The results from confirmation runs indicated that the determined optimal combination of machining parameters improved the performance of the machining process.
T. Rajmohan, R. Prabhu, G. Subba Rao, K. Palanikumar [3]. Study on Optimization of machining parameters in EDM of 304 stainless steel. In this study, it is found that different combination of EDM process parameters are required to achieve higher MRR for 304 stainless steel. Signal to noise ratio (S/N) and analysis of variance (ANOVA) is used to analyze the effect of the parameters on MRR and also to identify the optimum cutting parameters.B.S. Reddy et al. [4] carried out a study on the effect EDM parameters over MRR, TWR, SR and hardness. Mixed factorial design of experiments and multiple regression analysis techniques had been employed to achieve the desired results. The parameters in the decreasing order of importance for; MRR: servo, duty cycle, current and voltage; TWR: current, servo and duty cycle; SR: current; HRB: [7] investigated the effect of the peak current and pulse duration on the performance characteristics
Available online: http://edupediapublications.org/journals/index.php/IJR/ P a g e | 862
electrode were influenced by current and pulse on time, higher values of these parameters increased the surface roughness. Lower current and pulse time and higher pulse off time produced a better surface finish. Lin et al. [10] has presented the use of grey relational analysis based on an orthogonal array and the fuzzy-based Taguchi method for the optimization of the electrical discharge machining process with multiple process responses. Both the grey relational analysis method without using the S/N ratio and fuzzy logic analysis are used in an orthogonal array table in carrying out experiments. Experimental results have shown that both approaches can optimize the machining parameters (pulse on time, duty factor, and discharge current) with considerations of the multiple responses (electrode wear ratio, material removal rate, and surface roughness) effectively and can greatly improve process responses. It seems that the grey relational analysis is more straightforward than the fuzzy-based Taguchi method for optimizing the EDM process with multiple process responses.
2.
Experimental Details
Experiments were carried out on die sinking EDM of type Askar microns model V3525 with servo head constant gap voltage positive polarity. Commercial 30 Grade EDM Oil was used as Dielectric fluid. The investigation was done on Titanium super alloys with hardness 90 HRC. The chemical composition of work material is given in table.1 the size of work pieces are 50mmX30mmX6mm and the copper electrode of 12mm diameter was used for the experimentation because of higher MMR and lower TWR In the present investigation the effect of the four process parameters had been studied, those are the Pulse Current(Ip), Pulse ON time(Ton), Pulse OFF time(Toff) and Tool LIFT time(Tlift).Machining is carried out for 10 minutes for all the experiments and MRR and TWR are calculated for one minute for each experiment. The MRR and TWR are
calculated by measuring the weight difference of work piece and electrode before and after machining using a digital weighing balance of type AY220 with precision 0.001gm. The MRR and TWR are calculated by the formula given below.
MRR =
g/min
Where wp1 and wp2 are the weights of the work piece before and after machining, T is the machining time.
TWR =
g/min
Where wt1 and wt2 are the weights of the
work piece before and after machining, T is the machining time. Workpiece and the tool materials are hastelloy c-276 and copper (99.9% of Cu) respectively. The composition of the work piece is given in table.1.
2.1
Selection of the work piece:
Hastelloy C-276 is one of the most widely used materials in all industrial applications and consumption. Because of its aesthetic view in architecture, superior physical and mechanical properties, resistance against corrosion and chemicals, weld ability; it has become the most preferred material over others. Many conventional and non-conventional methods for machining Hastelloy C-276 are available.
Hastelloy C-276 is a Nickel-Molybdenum-Chromium alloy with the addition of Tungsten, has excellent corrosion resistance in a wide range of corrosive media and is especially resistant to pitting and crevice corrosion. It is
Excellent Resistance to Corrosion:
Available online: http://edupediapublications.org/journals/index.php/IJR/ P a g e | 863
in the weld heat-affected zone, thus making it suitable for most chemical process applications in the as-welded condition. However, in environments where attack of the C-276 alloy weld joint is experienced, C-22 weld filler materials should be considered. C-276 alloy has excellent resistance to localized corrosion and to both oxidizing and reducing media. Because of its versatility, C-276 alloy can be used where "upset" conditions are likely to occur or in multipurpose plants.
HASTELLOY C-276 alloy has excellent resistance to a wide variety of chemical process environments, including strong oxidizers such as ferric and cupric chlorides, hot contaminated media (organic and inorganic), chlorine, formic and acetic acids, acetic anhydride, and seawater and brine solutions. It is used in flue gas desulfurization systems because of its excellent resistance to sulfur compounds and chloride ions uncounted in most scrubbers. C-276 alloy has excellent resistance to pitting and to stress-corrosion cracking. It is also one of the few materials that with stand the corrosive effects of wet chlorine gas, hypochlorite, and chlorine dioxide.
Heat treatment: Wrought forms of HASTELLOY C-276 alloy are furnished in the solution heat-treated condition unless otherwise specified. C-276 alloy is normally solution heat-treated condition unless otherwise specified. C-276 alloy is normally solution heat-treated at 2050°F (1121°C) and rapid quenched. If possible, parts which have been hot-formed should be solution heat-treated prior to final fabrication or installation.
Table1: Chemical composition of Hastelloy C-276 in percentages:
Ni Co Cr Mo W Fe Si Mn Cr other s 57 2.5 16 17 4 5 .08 1 .01 v-.35
The process parameters are selected based on the preliminary experiments and
machine operating conditions. The levels of the process parameters are given in table.2. And the results of MRR and TWR got from experiments are given in table.3.
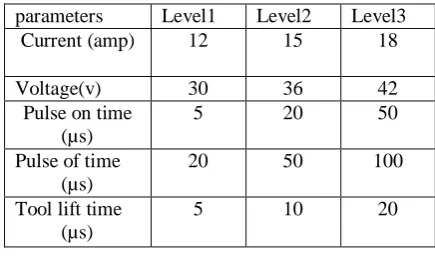
Table 2: Process parameters and their levels.
parameters Level1 Level2 Level3 Current (amp) 12 15 18
Voltage(v) 30 36 42
Pulse on time (µs)
5 20 50
Pulse of time (µs)
20 50 100
Tool lift time (µs)
5 10 20
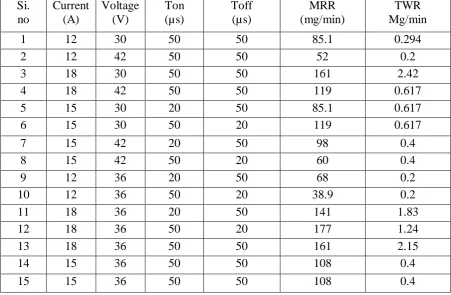
Table 3: Experimental Results of MRR and TWR
SI No
Current A
Voltage (v)
Ton (µs)
Toff (µs)
MRR
Mg/min Mg/minTWR
1 12 30 50 85.6 85.6 0.3
2 12 42 50 52.8 52.8 0.2
3 18 30 50 168 168 2.4
4 18 42 50 117.4 117.4 0.61
5 15 30 20 82 82 0.6
6 15 30 50 118.6 118.6 0.6
7 15 42 20 100 100 0.4
8 15 42 50 61.6 61.6 0.4
9 12 36 20 69.6 69.6 0.21
10 12 36 50 39.4 39.4 0.21
11 18 36 20 143.2 143.2 1.8
12 18 36 50 178.4 178.4 1.2
13 18 36 50 161 161 2.2
14 15 36 50 108.2 108.2 0.42
Available online: http://edupediapublications.org/journals/index.php/IJR/ P a g e | 864
2.2 Analysis and discussion of
MRR:
1. The MRR increases as the current increases throughout the entire range as shown in the fig 2.1
Fig.2.1. Graph Representing the Variation of MRR with current
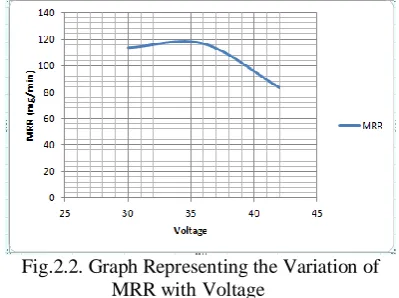
2. The MRR first slightly increases up to voltage 36 and then decreases in a similar fashion till voltage 42 as shown in the fig. 2.2
Fig.2.2. Graph Representing the Variation of MRR with Voltage
3. The MRR increases as the Ton increases throughout the entire range as shown in the fig 2.3
Fig.2.3. Graph Representing the Variation of MRR with Ton
4. The MRR increases as the Toff increases throughout the entire range as shown in the fig 2.4
Fig.2.4. Graph Representing the Variation of MRR with Toff
2.4 Analysis and discussion of TWR
1. The Tool Wear Rate increases with the increasing the current within the given range of values as shown in below Fig. 2.5
Available online: http://edupediapublications.org/journals/index.php/IJR/ P a g e | 865
Same as to be draw the graph of TWR with voltage, TWR with Ton and TWR with Toff.
3.
fuzzy logic technique:
3.1 Fuzzy logic modeling:
Fuzzy based system consists of the various steps such as Data definition, fuzzification of inputs, implication, aggregation and defuzzification. They are described briefly as follows.
3.1.1 Data definition:
The designer has to determine which process attributes should be taken as inputs and outputs to the model. In the present study Current Pulse on time, Pulse off time and Voltage have been taken as input parameters and MRR, TWR and SR as the output parameters.
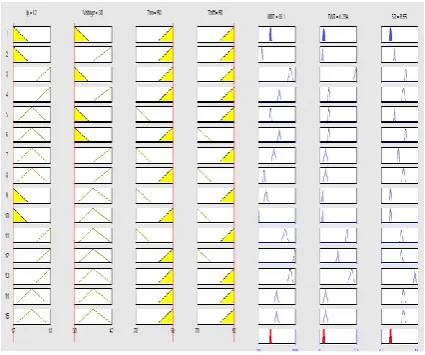
3.1.2 Fuzzifications inputs:
The fuzzification process maps input numbers into corresponding fuzzy memberships. This is required in order to activate rules that are in terms of linguistic variables. The fuzzifier takes input values and determines the degree to which they belong to each of the fuzzy sets via membership functions. It is to be noted that, so far there is no standard for choosing the proper shape of Fuzzy membership functions. Hence trial and- error methods are usually exercised. The most widely used membership functions are triangular, trapezoidal and arcs. In the present study, triangular membership functions are chosen. The relationship between inputs and outputs in a fuzzy system is characterized by linguistic statements which are called fuzzy rules they are defined based on experimental work, expert and engineering knowledge. The number of fuzzy rules in a fuzzy system is related to the number of fuzzy sets for each input variable. In the present study there are three inputs they are Current (3 states), Pulse on time (3 states), Pulse off time (3 states) and Voltage (3 states). Therefore the maximum numbers of
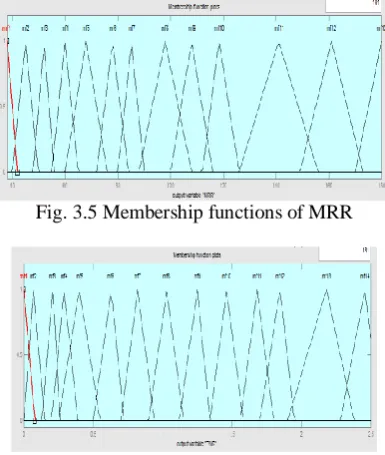
rules for this system can be 81. The set of fuzzy rules extracted from the experimental data. The Fuzzy member functions for Input variables are shown in Fig.3.1to fig.3.4 and membership functions for MRR are shown in fig.3.5. Similarly triangular functions are used as the membership functions for TWR
is shown in Fig. 3.6
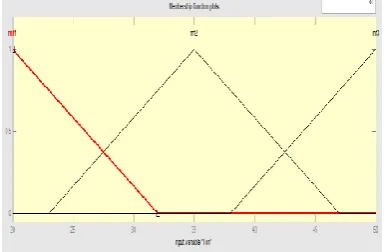
Fig. 3.1 Membership functions of Current
Fig.3.2 Membership functions of Voltage
Available online: http://edupediapublications.org/journals/index.php/IJR/ P a g e | 866 Fig. 3.4 Membership functions of Toff
Fig. 3.5 Membership functions of MRR
Fig. 3.6 Membership functions of TWR
3.1.3 Implication:
The implication is used for shaping the consequent (the final or than the part of a fuzzy rule), based on the antecedent the initial or if it of the fuzzy rule. The input to the implication process is a single number given by the antecedent, and the output is a fuzzy set. Two commonly used method of implication are the minimum and the product. Illustration of Implication diagram is shown in fig.3.8
Fig.3.8 Implication Diagram of MRR
3.1.4 Aggregation:
The process of combining output fuzzy sets in to a single set is called aggregation, a process that unifies the output of all the rules. The inputs to the aggregation process are truncated or modified output fuzzy sets obtained as the output of the implication process. The output of aggregation process is single output fuzzy set that represents the output variable. Aggregation occurs only once for each output variable. Since the aggregation method is commutative the order in which the rules are executed is not important. The commonly used aggregation method is maximum method. Illustration of Aggregation method for MRR, TWR and SR are shown in figure.3.9
Fig. 3.9 Rules view of Aggregation method for MRR, TWR and SR output.
3.1.5 Defuzzification
Available online: http://edupediapublications.org/journals/index.php/IJR/ P a g e | 867
techniques have been proposed in the literature, the most commonly used are Centroid and Bisector methods. The fuzzy model developed is consistent with the experimental observations.
3.2 FUZZIFICATION PARAMETERS
SI. No
Process parameter
s
Input or output
Range No. Of members
hip functions
1 current input 12-18 3 2 voltage input 30-42 3
3 Ton input 20-50 3
4 Toff input 20-50 3
5 MRR output 38-180 13 6 TWR output 0-0.25 14
Table 3.1 Fuzzification parameters.
3.3 MODELING RESULTS
Table.3.2. fuzzy developing results of MRR, TWR and SR:
Si. no
Current (A)
Voltage (V)
Ton (µs)
Toff (µs)
MRR (mg/min)
TWR Mg/min
1 12 30 50 50 85.1 0.294
2 12 42 50 50 52 0.2
3 18 30 50 50 161 2.42
4 18 42 50 50 119 0.617
5 15 30 20 50 85.1 0.617
6 15 30 50 20 119 0.617
7 15 42 20 50 98 0.4
8 15 42 50 20 60 0.4
9 12 36 20 50 68 0.2
10 12 36 50 20 38.9 0.2
11 18 36 20 50 141 1.83
12 18 36 50 20 177 1.24
13 18 36 50 50 161 2.15
14 15 36 50 50 108 0.4
15 15 36 50 50 108 0.4
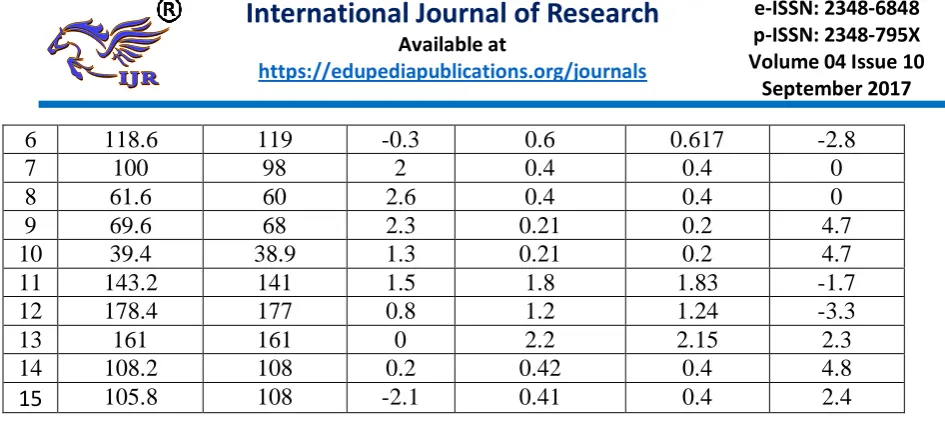
Table 3.3 Comparison of experimental and modeling results of MRR and TRR:
SI N O.
MRR Exp.
MRR Modeling
% Of Error
TWR Exp
TWR modeling
% of Error
1 85.6 85.1 0.4 0.3 0.294 2
2 52.8 52 1.5 0.2 0.2 0
3 168 161 4.2 2.4 2.42 -0.8
4 117.4 119 -1.4 0.61 0.617 -1.14
Available online: http://edupediapublications.org/journals/index.php/IJR/ P a g e | 868
6 118.6 119 -0.3 0.6 0.617 -2.8
7 100 98 2 0.4 0.4 0
8 61.6 60 2.6 0.4 0.4 0
9 69.6 68 2.3 0.21 0.2 4.7
10 39.4 38.9 1.3 0.21 0.2 4.7
11 143.2 141 1.5 1.8 1.83 -1.7
12 178.4 177 0.8 1.2 1.24 -3.3
13 161 161 0 2.2 2.15 2.3
14 108.2 108 0.2 0.42 0.4 4.8
15 105.8 108 -2.1 0.41 0.4 2.4
3.4 THE COMPARISON THE EXP. RESULTS AND MODELING RESULTS FOR MRR & TWR:
The fuzzy model has been developed for modeling the MRR, TWR and SR in terms of intensity, open circuit Voltage, servo and duty cycle. The comparison of modeling values of MRR and TWR using fuzzy logic controller with the Exp. values for different set of input values are shown in Fig.
Fig.3.10 Comparison of results between Exp. and Modeling MRR
Fig.3.11 Comparison of results between Exp. and Modeling MRR
3.5. SURFACE OUTPUT
The surface is plotted to study the effect of process variables on the material Removal Rate and Tool Wear Rate shown in figers3.13 to 3.14. From fig.3.13 the material removal rate is found to have an increasing trend with the increase current and Voltage the MRR first increased till voltage 36 and then decreased. From the fige.3.14 the TWR increased along with the increase in current. Finally for Voltage, TWR slightly increased but only up to voltage 36 and then started decreasing.
Available online: http://edupediapublications.org/journals/index.php/IJR/ P a g e | 869 Fig. 7.14 (3-D surface plots of the TWR main
effects of the peak current and voltage)
3.6. FUZZY LOGIC RULES:
Fig.3.16. Developing the Fuzzy Rules
3.7 OUTPUT RESULTS RULES VIEW
Fig.3.17 Output Modeling Results in FUZZY
4. CONCLUSION
In this study the experiment was conducted by considering three variable parameters namely current, Voltage and duty cycle. The objective was to find the Material Removal Rate, Surface Roughness and TWR and to study the effects of the variable parameters on these characteristics. The tool material was taken as copper and the work piece was chosen as Hastelloy C-276. The parameters taken from the Box Behnkine Design L15 was created and the experiments were performed accordingly. The following conclusions were drawn:
(1)For the MRR increased nonlinearly with the increase in current. For Voltage the MRR first increased till voltage 36 and then decreased. The MRR increases linearly with the increase in Ton and Toff. (2)For the SR increased significantly with the increase in current in a nonlinear fashion. For increase in Voltage, SR increased up to voltage 36 and then there was no significant increase.(3) For the TWR increased along with the increase in current. For increase in pulse on time, TWR increased linearly. Finally for Voltage, TWR slightly increased but only up to voltage 36 and then started decreasing.
Available online: http://edupediapublications.org/journals/index.php/IJR/ P a g e | 870
5.ACKNOWLEDGEMENTS
The authors with gratitude thank the Chairman, Director and department of HOD, ANURAG GROUP OF INSTITUTION (CVSR) for permitting us to pursue the work at Gatkeshar, Venkatapur, Hyderabad, Telangana, India
REFERENCES
[1] J. Laxman, Dr. K. Guru raj (2014), “Modeling and analysis of EDM process parameters using Taguchi Technique and Fuzzy based Modeling” Journal of International Advanced Mechanical Engineering.
[2] Chen-Chun Kao, Albert J. Shih (2008), “Fuzzy Logic Control of Microhole Electrical
Discharge Machining”, Journal of
Manufacturing Science and Engineering
copyright @ 2008 by ASME
[3] M. R. Shabgard, M. A. Badamchizadeh, G. Ranjbary, K. Amini (2013), “Fuzzy approach to select machining parameters in EDM and ultrasonic-assisted EDM process”, Journal of manufacturing system ELSEVIER
[4] Subramanian Gopalakannan,
Thiagarajan Senthilvelan (2012), “Effect of Electrode Materials on Electric Discharge Machining of 316L and 17-4 PH Stainless Steel”, Journal of Minerals and Materials Characterization and Engineering
[5] P. Janmanee, A. Muttamara (2010), “Performance of Difference Electrode Materials in Electrode Materials in EDM of Tungsten Carbide” Journal of Energy Research 1(2); 87-90.
[6] P. Srinivasa, K. Eswara Prasad and B. Sidda Reddy (2011), “Fuzzy modeling for Electrical Discharge Machining of Aluminum Alloy”, Journal of IJRRAS 9 (1)
[7] S. H. Tomadi, M. A. Hassan, Z. Hamedon (2009), “Analysis of the Influence of EDM parameters on Surface Quality, MRR and TWR of Tungsten Carbide”, Journals of International Multiconference of Engineers and Computer Scientist.
[8] J. L. Lin, K. S. Wang, B. H. Yan, Y. S. Tarng(2000), “Optimization of the Electrical Discharge Machining process based on the Taguchi method with Fuzzy logic” Journal of
Materials processing Technology102,
ELSEVIER.
[9] A.K.M. Asif Iqbal and Ahsan Ali Khan (2010), “Modeling and Analysis of MRR, EWR and Surface Roughness in EDM Milling 68 through Response Surface Methodology” American journal of engineering and applied science.
[10] C.K. Biswas and Shailesh Dewangan “optimization of EDM process with
Fuzzy logic technique”. International
conference on Metallurgical, manufacturing and Mechanical Engineering (ICMMME’ 2012), DUBAI, UAE.
[13] Chin-Teng Lin, I-Fang Chung, Shih-Yu Huang (2001), “Improvement of machining accuracy by fuzzy logic at corner parts for wire-EDM” Journal of manufacturing system ELSEVIER. Machining accuracy by fuzzy logic at corner parts for wire-EDM” Journal of manufacturing system ELSEVIER.
[14] G. Krishna MohanRao, S.
Satyanarayana & M. Praveen “Influence of machining parameters on Electric Discharge Machining of maraging steels. An experimental investigation” Processing of the world congress on Engineering 2008 Vol. II (WCE 2008), July 2-4, 2008, London, U.K.
[15] Rahman M.M., Khan Md. A.R., Noor M.M., Kadirgama K. and Bakar R.A. (2011) “Optimization of machining parameters on surface roughness in EDM of Ti-6Al-4V. parts for wire-EDM” Journal of manufacturing
system ELSEVIER.
[11] T. Rajmohan, R. Prabhu, G. Subba Rao and K. Palanikumar (2012), “Optimization of machining parameters in electrical discharge machining of 304 stainless steel” Journal of
international conference on modeling
optimization and computing ICMOC 2012. [12] Mohd Amri Lajis, H.C.D. Mohd Radzi and A.K.M. Nurul Amin (2009), “The
Implementation of Taguchi Method on EDM Process of Tungsten Carbide” European Journal of Scientific Research.