An Efficient Kernel Mapping Hubness Based Neighbor
Clustering In High-Dimensional Data
C.DeepikaP
1
P
, R.RangarajP
2
Research Scholar, PG & Research Department of Computer Science, Hindusthan College of Arts & Science, Coimbatore, IndiaP
1
Associate Professor, PG & Research Department of Computer Science, Hindusthan College of Arts & Science, Coimbatore,
IndiaP
2
Abstract: High-dimensional data arise naturally in a lot
of domains, and have regularly presented a great confront
for usual data mining techniques. In this paper, we take a
novel perspective on the problem of Hubness (data in the
direction of contain points) in Clustering
high-dimensional data. The proposed method called “kernel
mappings” and “Neighbor clustering”, which takes as
input measures of correspondence between pairs of data
points. Real-valued hubs are exchanged between data
points until a high-quality set of patterns and
corresponding clusters gradually emerges. To validate
our theory by demonstrating that hubness is a
quality measure of point centrality within a
high-dimensional information cluster, and by proposing
several hubness-based clustering algorithms, showing
that main hubs can be used effectively as cluster
prototypes or as guides during the search for
centroid-based cluster patterns. Experimental results demonstrate
the good performance of our proposed algorithms in
manifold settings, mainly focused on large quantities of
overlapping noise. The proposed methods are modified
mostly for detecting approximately hyper spherical
clusters and need to be extended to properly handle
clusters of arbitrary shapes.
Keywords: Clustering, curse of dimensionality, nearest neighbors, hubs, kernel mapping.
I. INTRODUCTION
Clustering in general is an unsupervised process of grouping elements together, so that elements assigned to the same cluster are more similar to each other than to the remaining data points [1].
This goal is often difficult to achieve in practice. Over the years, various clustering algorithms have been proposed, which can be roughly divided into four groups: partitional, hierarchical, density based, and subspace algorithms. Algorithms from the fourth group search for clusters in some lower dimensional projection of the original data, and have been generally preferred when dealing with data that are high dimensional [2], [3], [4], [5].
The motivation for this preference lies in the observation that having more dimensions usually leads to the so-called curse of dimensionality, where the performance of many standard machine-learning algorithms becomes impaired.
The difficulties in dealing with high-dimensional data are omnipresent and abundant. However, not all phenomena that arise are necessarily detrimental to clustering techniques. We will show in this paper that hubness, which is the tendency of some data points in high-dimensional data sets to occur much more frequently in k-nearest neighbor lists of other points than the rest of the points from the set, can in fact be used for clustering.
II. RELATED WORK
A. Density Based Clustering
Density based clustering [8] differentiates regions which have higher density than its neighborhood and does not need the number of clusters as an input parameter. Regarding a termination condition, two parameters indicate when the expansion of clusters should be terminated: given the radius of the volume of data points to look for a minimum number of points for the density calculations has to be exceeded. Local scaling is a technique which makes use of the local statistics of the data when identifying clusters. This is done by scaling the distances around each point in the dataset with a factor proportional to its distance to its kP
th
P
nearest neighbor. Locally scaled density based clustering algorithm clusters points by connecting dense regions of space until the density falls below a threshold determined by the center of the cluster. In high-dimensional spaces this is often not easy to estimate, due to data being very sparse. There is also the issue of choosing the proper neighborhood size, since both small and large values of k can cause problems for density based approaches [9].
B. K-means++
The K-means++ is a specific way of choosing centers for the k-means algorithm. The relationship between k-means++ clustering and hubness was briefly examined in [10], where it was observed that hubs may not cluster well using conventional prototype-based clustering algorithms (K-means ++) [7], since they not only tend to be close to points belonging to the same cluster (i.e., have low intra-cluster distance) but also tend to be close to points assigned to other clusters (low inter-cluster distance). The demonstrable gains of k-means++ over random initialization is precisely in the constantly updated non-uniform selection. The algorithm that works in a small number of iterations, selects more than one point in each iteration but in a non-uniform manner, and has provable approximation guarantees. Hubs can, therefore, be viewed as (opposing) analogues of outliers, which have high inter- and intra-cluster distance, suggesting that hubs should also receive special attention [10].
III. PROPOSED SYSTEM
The proposed method identifies the patterns among data points and forms clusters of data points around these patterns. It operates by simultaneously considering all data point as potential patterns and exchanging messages between data points (hubs) until a good set of patterns and clusters emerges. The kernel mapping and neighbor cluster is used to find the fitness value hubs are exchanged between data points until a high-quality set of patterns and corresponding clusters gradually emerges.
A.Feature Selection
A “feature” or “attribute” or “variable” refers to a portion of the data points. Typically before collecting data, features are specified or preferred. Features can be discrete, continuous, or insignificant. Feature selection for high-dimensional data clustering is the task of disregarding irrelevant and redundant terms in the vectors that represent the hubs, aiming to find the smallest subset of terms that reveals “natural” clusters of hubs. To Searching for the small subset figure: 1 of relevant terms will speed up the clustering process, while avoiding the curse of dimensionality.
Fig: 1. Dimensionality Reduction
B. Correlation of kernel mapping Hubs to Data Clusters
A correlation between low hubness elements (i.e., anti-hubs) and outliers was also observed. A low-hubness score indicates that a point is on average far from the rest of the points and hence probably an outlier. In high-dimensional spaces, however, low data point elements are expected to occur by the very nature of these spaces and data resource. The kernel mapping can be applied using more general notions of similarity, and the similarities may be positive or negative. The output of the algorithm is unchanged if the similarities are scaled and/or offset by a constant (as long as the preferences are scaled and/or offset by the same constant). To compute fitness measure over the set of possible clusters and then chooses among the set of cluster candidates points (hubs) those that optimize the measure used. To identify the cluster of a specific vertex or to group all of the vertices into a set of clusters, and then present possible cluster fitness measures that serve for methods that produce the clustering by comparing different groupings and selecting one that meets or optimizes a certain criterion. The ratio of the cluster is to minimum sums of degrees either inside the cluster or outside it. A fitness function is evaluated for all neighbors and the outcome is used to choose to which neighbor the search will proceed.
C. Neighbor clustering Algorithm
The neighbor clustering algorithm works message passing among data points. Each data points (hubs) receive the availability from others data points (from pattern) and send the responsibility message to others data points (to pattern). Sum of responsibilities and availabilities for data points identify the cluster patterns.
The high-dimensional data point availabilities A (i, k) are zero: A(i, k) = 0, R (i, k) is set to the input similarity between point i and point k as its pattern, minus the largest of the similarities between point i and other candidate patterns.
The cluster responsibilities are computed using the equation,
𝑅(𝑖,𝑘)← 𝑆(𝑖,𝑘)− 𝑚𝑎𝑥
𝑘′𝑠.𝑡.𝑘′≠𝑘{𝐴(𝑖,𝑘′) +𝑆(𝑖,𝑘′)} (1)
In later iterations, when some hub points are effectively assigned to other patterns, their availabilities will drop below zero. These negative availabilities will decrease the effective values of some of the input similarities S (i, k′) in the above rule, removing the corresponding candidate hubs from competition.
The above responsibility in equation (1) is update lets all data point patterns are compete for ownership of a data point, the following availability update gathers confirmation from data points as to whether each hubs would make a good pattern:
𝐴(𝑖,𝑘)← 𝑚𝑖𝑛 �0,𝑅(𝑘,𝑘) + � max {0,𝑅(𝑖′,𝑘)}
𝑖′𝑠.𝑡.𝑖′∈{𝑖,𝑘}
� (2)
The hub links are sent from cluster members (data points) to candidate patterns (data points), indicating how well-suited the data point would be as a member of the candidate pattern cluster. The kernel mapping and Neighbor clustering is iteratively computes data responsibilities and data availabilities to overcome the outlier points. The algorithm terminates if decisions for the patterns and the cluster boundaries are unchanged for convict’s iterations, or if maximum iterations are reached. The responsibilities and availabilities are messages that provide evidence for whether or not each data point should be in hubs and if not to what outlier that data point should be assigned.
Algorithm 1: Neighbor Clustering Algorithm
Require: A, R, i, k
1: Initialize A (i, k) =0, R (i, k) = 0, k=0, and S (i, k) = 0 randomly
2: repeat
3: Update the data point responsibility by (1) where S (i, k) is the similarity of data points (hubs) and kernel map pattern k.
4: Update the data point availabilities by (2) 5: Update self-availability by using (3)
6: Compute sum = A (i, k) + R (i, k) for data point i and find the value of k that maximize the sum to identify the hubs.
IV. EXPERIMENTAL RESULTS
We test our proposed kernel mapping with neighbor clustering algorithm on Real-world data are usually much more complex and difficult to cluster, therefore such tests are of a higher practical significance. As not all data exhibit hubness, we tested the algorithms both on intrinsically high-dimensional, high-hubness data and intrinsically low-to-medium dimensional, low-hubness data. There were two different experimental setups. In the first setup, a single data set was clustered for many different K-s (number of clusters), to see if there is any difference when the number of clusters is varied. In the second setup, 20 different data sets were all clustered by the number of classes in the data (the number of different labels).
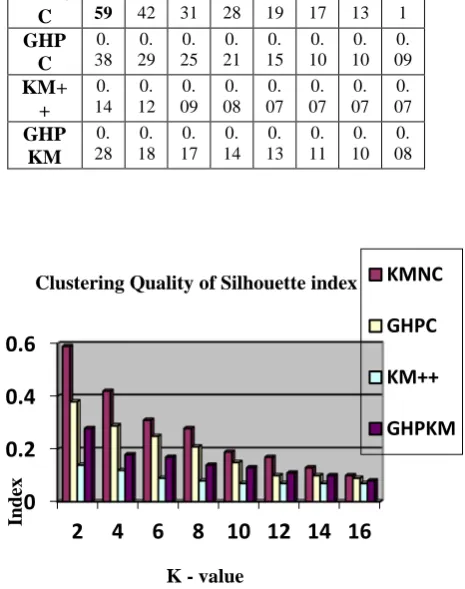
The clustering quality in these experiments was measured by two quality indices, the silhouette index and the isolation index [11], which measures a percentage of k-neighbor points that are clustered together. In the experimental setup, the two-part Miss-America data set (cs.joensuu.fi/sipu/datasets/) was used for evaluation. Each part consists of 6,480 instances having 16 dimensions. Results were compared for various predefined numbers of clusters in algorithm calls. Each algorithm was tested 50 times for each number of clusters. Neighborhood size was 5. The highest level of noise for which we tested was the case when there was an equal number of actual data instances in original clusters and noisy instances. At every noise level, KMNC (kernel map with neighbor cluster), KM++, GHPC, and Global Hubness-Proportional K-Means (GHPKM) were run 50 times each.
The results for both parts of the data set are given in Table 1 and Table 2. The kernel map and neighbor cluster (KMNC) is clearly outperformed GHPC, KM and other hubness-based methods. This shows that hubs can serve as good cluster center prototypes.
Table 1: Clustering Quality of Silhouette index on the Miss-America Data Set
K 2 4 6 8 10 12 14 16 KMN C 0. 59 0. 42 0. 31 0. 28 0. 19 0. 17 0. 13 0. 1 GHP C 0. 38 0. 29 0. 25 0. 21 0. 15 0. 10 0. 10 0. 09 KM+ + 0. 14 0. 12 0. 09 0. 08 0. 07 0. 07 0. 07 0. 07 GHP KM 0. 28 0. 18 0. 17 0. 14 0. 13 0. 11 0. 10 0. 08
Table 2: Clustering Quality of Isolation index on the Miss-America Data Set
K 2 4 6 8 10 12 14 16 KMN C 0. 94 0. 92 0. 79 0. 58 0. 51 0. 49 0. 36 0. 29 GHP C 0. 91 0. 89 0. 71 0. 53 0. 42 0. 33 0. 30 0. 26 KM+ + 0. 62 0. 46 0. 34 0. 23 0. 19 0. 16 0. 13 0. 12 GHP KM 0. 85 0. 54 0. 45 0. 38 0. 29 0. 26 0. 24 0. 23
0
0.2
0.4
0.6
2 4 6 8 10 12 14 16
Inde
x
K - value
Clustering Quality of Silhouette index
KMNC
GHPC
KM++
V. CONCLUSION
In this paper, proposed method of KMNC method had proven to be more robust than the GHPKM and K-Means++ baseline on both synthetic and real-world data, as well as in the presence of high levels of artificially introduced noise. The kernel map with neighbor clustering can easily be extended to incorporate additional pair-wise constrains such as requiring points with the same label to come into view in the same cluster with just an extra layer of function hubs. The model is flexible enough for information other than explicit constraints such as two points being in different clusters or even higher-order constraints (e.g., two of three points must be in the same cluster).
REFERENCES
[1] J. Han and M. Kamber, Data Mining: Concepts and Techniques, second ed. Morgan Kaufmann, 2006.
[2] C.C. Aggarwal and P.S. Yu, “Finding Generalized Projected Clusters in High Dimensional Spaces,” Proc. 26th ACM SIGMOD Int’l Conf. Management of Data, pp. 70-81, 2000.
[3] K. Kailing, H.-P. Kriegel, P. Kro¨ ger, and S. Wanka, “Ranking Interesting Subspaces for Clustering High Dimensional Data,” Proc. Seventh European Conf. Principles and Practice of Knowledge Discovery in Databases (PKDD), pp. 241-252, 2003.
[4] K. Kailing, H.-P. Kriegel, and P. Kroger, “Density-Connected Subspace Clustering for
High-Dimensional Data,” Proc. Fourth SIAM Int’l Conf. Data Mining (SDM), pp. 246-257, 2004.
[5] E. Muller, S. Gu¨nnemann, I. Assent, and T. Seidl, “Evaluating Clustering in Subspace Projections of High Dimensional Data,” Proc. VLDB Endowment, vol. 2, pp. 1270-1281, 2009.
[6] E. Agirre, D. Martı´nez, O.L. de Lacalle, and A. Soroa, “Two Graph-Based Algorithms for State-of-the-Art WSD,” Proc. Conf. Empirical Methods in Natural Language Processing (EMNLP), pp. 585-593, 2006.
[7] D. Arthur and S. Vassilvitskii, “K-Means++: The Advantages of Careful Seeding,” Proc. 18th Ann. ACM-SIAM Symp. Discrete Algorithms (SODA), pp. 1027-1035, 2007.
[8] E. Bic¸ici and D. Yuret, “Locally Scaled Density Based Clustering,” Proc. Eighth Int’l Conf. Adaptive and Natural Computing Algorithms (ICANNGA), Part I, pp. 739-748, 2007.
[9] S. Hader and F.A. Hamprecht, “Efficient Density Clustering Using Basin Spanning Trees,” Proc. 26th Ann. Conf. Gesellschaft fur Klassifikation, pp. 39-48, 2003.
[10] M. Radovanovic, A. Nanopoulos, and M. Ivanovic, “Hubs in Space: Popular Nearest Neighbors in High-Dimensional Data,”
J. Machine Learning Research, vol. 11, pp. 2487-2531, 2010.
[11] G. Frederix and E.J. Pauwels, “Shape-Invariant Cluster Validity Indices,” Proc. Fourth Industrial Conf. Data Mining (ICDM), pp. 96-105, 2004.
BIOGRAPHY