Scholarship@Western
Scholarship@Western
Electronic Thesis and Dissertation Repository
8-23-2016 12:00 AM
Photo-Isomerizable Self-Complementary Hydrogen Bond Arrays
Photo-Isomerizable Self-Complementary Hydrogen Bond Arrays
Iamnica Janic Linares Mendez The University of Western Ontario
Supervisor James A. Wisner
The University of Western Ontario Graduate Program in Chemistry
A thesis submitted in partial fulfillment of the requirements for the degree in Doctor of Philosophy
© Iamnica Janic Linares Mendez 2016
Follow this and additional works at: https://ir.lib.uwo.ca/etd
Part of the Organic Chemistry Commons, and the Physical Chemistry Commons
Recommended Citation Recommended Citation
Linares Mendez, Iamnica Janic, "Photo-Isomerizable Self-Complementary Hydrogen Bond Arrays" (2016). Electronic Thesis and Dissertation Repository. 3999.
https://ir.lib.uwo.ca/etd/3999
This Dissertation/Thesis is brought to you for free and open access by Scholarship@Western. It has been accepted for inclusion in Electronic Thesis and Dissertation Repository by an authorized administrator of
The combination of photoswhitchable molecules and supramolecular complexes has
provided valuable contributions to materials science. The scope of applications where these
smart materials could contribute drives the efforts toward developing systems that provide a
range of responses, sensibilities and stabilities. This thesis exploits the use of a well-known
photochromic system in a self-complementary hydrogen bond array; i.e. the azo group,
R-N=N-R. The novelty of the approach described in this thesis resides in the double function
of the azo group within the array: as a hydrogen bond acceptor site and as a functional element
that promotes a structural change capable of disrupting the complexation equilibrium when
irradiated with light.
The photo-isomerizable self-complementary hydrogen bond arrays presented in this
document are obtained by a general and practical synthetic method from inexpensive starting
materials. Their self-complementary recognition was corroborated by 1H NMR dilution experiments and single crystal X-ray structures. In the course of these studies, it was observed
that the electron withdrawing character of the substituents employed, the presence of
solvent-solute interactions and the disposition of the binding sites have a significant effect over the
dimerization constants obtained.
Likewise, some photochemical properties of these systems were studied, such as their
UV-Vis absorption spectra, the cis/trans ratio at their photostationary state after trans- to cis- photoisomerization, the stability of the complexes present in solution after UV- light
ii
From these speciation diagrams we were able to confirm that the mathematical approach
employed to describe the systems’ equilibria provided us a reliable approximation of all
complexation constants in solution after photoisomerization.
Keywords
azoheteroaromatic compounds, photoisomerization, self-complementary arrays, smart
iii
Co-Authorship Statement
Jeffrey S. Pleizier synthesized and crystallized compound 4a. All X-ray crystal
structure were solved by Dr. Paul D. Boyle (X-Ray facility manager). Mass spectrometry of
all compounds presented in this work was carried out by Doug Hairsine (Mass Spec facility
manager).
Scheme 1.5 and Figure1.13 were reproduced with permission from: John Wiley & Sons
(License number 3910300843589) and Royal Society of Chemistry (License number
3910310008235)
iv
Acknowledgments
“Science, my lad, is made up of mistakes, but they are mistakes which it is useful to make, because they lead little by little to the truth”
-Jules Verne
This thesis is the result of a five years journey where I had the opportunity to work and
learn in the company of many people. I want to take these lines to publicly acknowledge their
contribution to this project.
Foremost, I want to thank Professor James A. Wisner for letting me work under his
supervision, for trusting in my capabilities to overcome all daily difficulties. His
understanding, encouragement and patience towards my performance as a Chemist have
created a significant impact in my professional development. I take to the heart all the advice
and experience I earned working for him.
Likewise, I am thankful to the members of the examination committee: Dr. Paul J.
Ragogna, Dr. Michael A. Kerr, Dr. Giovanni Fanchini and Dr. Donal Macartney. Thanks for
the time employed reading and outlining the areas where I can polish the quality of the work
presented. To Dr. Paul J. Ragogna for keeping track of my progress all this time and being
coherent with the forms and procedures that rule the Graduate Program in Chemistry. To Dr.
Michael A. Kerr for pushing me to think outside the box during the courses I had the
opportunity to take with him.
I am grateful to Bhanu Mudrboyina and Jeffrey S. Pleizier (former and present labmates
v
ideas and comments on this project and for all the fun we had (regardless that most of the times
it was he making fun of my “Mexicanity”). I am glad to have you at my side sharing the ups
and downs of grad school.
The project I am presenting through these pages would not be possible without all the
faculty and staff from the Chemistry Department. Thanks to Mathew Willans (NMR facility
manager), Doug Hairsine (Mass Spec facility manager) and Paul D. Boyle (X-Ray facility
manager) for their aid towards in the characterization of the compounds obtained. Likewise, I
want to thank to Dr. Estefania Ruiz for her assistance in the mathematical model approach and
the statistics figures employed.
Por último, y no por ello menos importante, a mis padres Lucia Méndez Delgado y José
Luis Linares García por apoyarme en estos ocho años lejos de casa. Por mantener una estrecha
comunicación constante con la cual los siento tan cerca como si estuvieran todos los días a mi
lado. Por insistir en enseñarme a perseguir mis sueños con la vista fija en la meta y la mente
abierta a aprender de los errores que tendré que cometer para madurar y salir adelante. Y por
nunca perder la fe en mí, a pesar de que en veces yo misma no la tenga. A mi hermano Elder
Linares Méndez por enseñarme a aferrarme menos a lo que tengo y puedo lograr, porque,
citando sus palabras, “eso no es todo lo que me define”. Gracias por ser mi cómplice y
vi
Table of Contents
Abstract ... i
Co-Authorship Statement... iii
Acknowledgments... iv
Table of Contents ... vi
List of Tables ... x
List of Figures ... xiii
List of Schemes ... xxv
List of Abbreviations and Symbols... xxviii
Chapter 1 ... 1
1 Introduction ... 1
1.1 Supramolecular Chemistry... 1
1.2 Molecular Recognition... 2
1.3 Intermolecular Interactions ... 3
1.4 Hydrogen Bond. ... 5
1.4.1 Definition. ... 5
1.4.2 Classification... 6
1.4.3 Strength of the Hydrogen Bond in Supramolecular Arrays. ... 8
1.5 Supramolecular Complexes. ... 14
1.6 Preorganization ... 16
1.7 Tautomerization ... 18
1.8 Solvent Effect... 21
1.9 Smart Materials. ... 24
1.10Supramolecular Photochemistry. ... 25
vii
1.11.2 Fatigue or Photodegradation. ... 34
1.12Azoaromatic Compounds... 36
1.12.1 Azoaromatic Compounds in Self-Assembly Systems. ... 41
1.13Scope of the Thesis ... 45
1.14References ... 46
Chapter 2 ... 53
2 Synthesis and Characterization of Photoswitchable Self-Complementary DDAAA Hydrogen Bond Arrays ... 53
2.1 Introduction ... 53
2.2 Design of Photoswitchable Self-Complementary Hydrogen Bond Arrays ... 57
2.3 Results and Discussion ... 61
2.3.1 Synthesis of Photoswitchable Self-Complementary Hydrogen Bond Arrays ... 61
2.3.2 1H NMR Dilution Experiments: Stability of trans-trans dimers. ... 65
2.3.3 X-Ray Analysis of Self-Complementary Arrays. ... 79
2.4 Summary and Conclusion ... 94
2.5 Experimental Methodology ... 95
2.5.1 Generalities ... 95
2.5.2 Synthetic Methods ... 97
2.5.3 1H NMR Dilution Experiments ... 128
2.6 References ... 129
Chapter 3 ... 132
3 Photochemistry of Photoswitchable Self-Complementary DDAAA Hydrogen Bond Arrays ... 132
3.1 Introduction ... 132
viii
3.2.2 Photoisomerization Trans to Cis. ... 145
3.2.3 Complexation Constants in Solution After Photoisomerization ... 151
3.2.4 Cis to Trans Reversion Kinetics ... 174
3.3 Summary and Conclusions ... 178
3.4 Experimental Methodology ... 179
3.4.1 Generalities ... 179
3.4.2 Photostationary State Experiments ... 180
3.4.3 Synthesis of (Z)-4-(pyridin-2-yldiazenyl)-1,3,5-triazin-2-amine derivatives ((c)-4c, (c)-4f and (c)-4k). ... 181
3.4.4 1H NMR Reversion Experiments ... 181
3.5 References ... 182
Chapter 4 ... 184
4 Synthesis and Characterization of Second Generation Photoswitchable Self-Complementary DDAAA Hydrogen Bond Arrays. ... 184
4.1 Introduction: Design of Second Generation Photoswitchable Self-Complementary Hydrogen Bond Arrays. ... 184
4.2 Results and Discussion. ... 190
4.2.1 Synthesis of Second Generation Photoswitchable Self-Complementary Hydrogen Bond Arrays. ... 190
4.2.2 1H NMR Dilution Experiments: Stability of trans-trans dimers. ... 192
4.2.3 X-Ray Analysis of Self-Complementary Arrays ... 201
4.2.4 UV-Vis Characterization ... 215
4.2.5 Photoisomerization Trans to Cis ... 218
4.2.6 Complexation Constants in Solution After Photoisomerization ... 224
4.2.7 Cis to Trans Reversion Kinetics ... 234
4.3 Summary and Conclusions ... 237
ix
4.4.2 Synthetic Methods ... 240
4.4.3 Synthesis of (Z)-4-butoxy-6-((2-methoxyphenyl)diazenyl)-1,3,5-triazin-2-amine, (c)-7c. ... 246
4.5 References ... 247
Chapter 5 ... 248
5 Conclusions and Outlook ... 248
5.1 Conclusions ... 248
5.2 Outlook ... 250
x
List of Tables
Table 1.1 Intermolecular Interactions. ... 4
Table 1.2 Categories of hydrogen bond interaction and some of their important properties. .. 6
Table 1.3 Comparison of the effect of electron-withdrawing functional groups attached to DDD
units on the association constant (Ka) in CDCl3 at 298 K. ... 10
Table 1.4 Association constant of the six modalities of the 1∙2 complex in CDCl3 at
296 K. ... 42
Table 2.1 Reactants, yields of intermediates 2a-p and overall yields of photoswitchable self-complementary hydrogen bond arrays 4a-p. ... 64
Table 2.2 Dimerization constants, free energies of dimerization, calculated chemical shifts of
monomer (𝜹𝒎) and dimer (𝜹𝒅) species studied, and the total change in chemical shift (∆𝜹𝒎𝒂𝒙) in CDCl3 at 298 K. ... 68
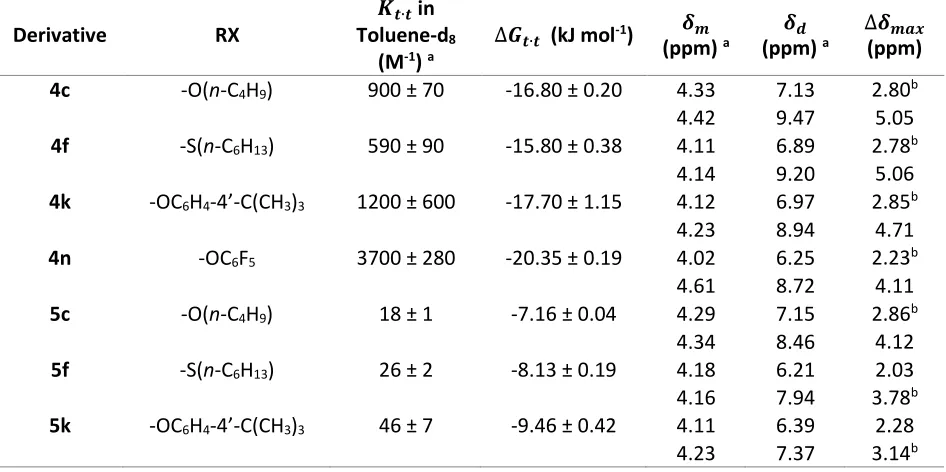
Table 2.3 Dimerization constants, free energies of dimerization, calculated chemical shifts of
monomer (𝜹𝒎) and dimer (𝜹𝒅) species studied, and the total change in chemical shift (∆𝜹𝒎𝒂𝒙) in Toluene-d8 at 298 K. ... 76
Table 2.4 Crystallographic parameters for 4a, 4d, 4f and 4k crystals. ... 80
Table 2.5 Hydrogen bond distances and angles of complex 4a∙4a X-ray crystal structure data. ... 82
Table 2.6 Hydrogen bond distances and angles of complex 4d∙4d X-ray from the crystal structure data. ... 85
Table 2.7 Hydrogen bond distances and angles of complex 4f∙4f X-ray from the crystal structure data. ... 88
xi
planes angles of 4a, 4d, 4f and 4k from their crystal structure data. ... 93
Table 3.1 Characteristic n→* and →* transition bands of derivatives (t)-4a-p from UV-Vis spectroscopy in acetonitrile at 298 K. ... 141
Table 3.2 Characteristic n→* and →* transition bands of derivatives (c)-4 from UV-Vis spectroscopy in acetonitrile at 298 K. ... 142
Table 3.3 Trans to cis interconversion yields at PSS after irradiation with UV Light (360 nm) at 298 K. ... 148
Table 3.4 Complexation constants, free energies of complexation and chemical shifts of the
trans-isomer in the complex 𝜹𝒕𝒄 studied in Toluene-d8 (at 298 K). ... 164
Table 3.5 Rate constants calculated for cis to trans thermal reversion of derivatives 4c, 4f and
4k studied in Toluene-d8 at 298 K. ... 175
Table 4.1 Ranges and mean values of the lengths (Å) and angles (º) of hydrogen bonds in
crystal structures of purines and pyrimidines, nucleosides, and nucleotides.a ... 188
Table 4.2 Reactants and overall yields of photoswitchable self-complementary hydrogen bond
arrays 7. ... 191
Table 4.3 Dimerization constants, free energies of dimerization, chemical shifts of monomer
(𝜹𝒎) and dimer (𝜹𝒅) species studied, and the total change in the chemical shift (∆𝜹𝒎𝒂𝒙) in CDCl3 at 298 K. ... 192
Table 4.4 Dimerization constants, free energies of dimerization, chemical shifts of monomer
(𝜹𝒎) and dimer (𝜹𝒅) species studied, and the total change in the chemical shift (∆𝜹𝒎𝒂𝒙) in toluene-d8 at 298 K. ... 198
Table 4.5 Crystallographic parameters for 7c, 7f, 7k and 7n crystals. ... 202
xii
structure data. ... 207
Table 4.8 Hydrogen bond distances and angles of the array 7k X-ray from the crystal structure data. ... 211
Table 4.9 Hydrogen bond distances and angles of complex 7n∙7n X-ray from the crystal structure data. ... 213
Table 4.10 Summary of hydrogen bond distances, intramolecular and intermolecular ring’s
planes angles of 7c, 7f, 7k and 7n from their crystal structure data. ... 214
Table 4.11 Comparison of intermolecular distances in 4f and 7f dimer structures in the solid state. ... 215
Table 4.12 Characteristic n→* and →* transition bands of derivatives (t)-7 from UV-Vis spectroscopy in acetonitrile at 298 K. ... 216
Table 4.13 Characteristic n→* and →* transition bands of derivative (c)-7c from UV-Vis spectroscopy in acetonitrile at 298 K. ... 218
Table 4.14 Trans to cis interconversion yields at PSS after irradiation with UV Light (360 nm) at 298 K. ... 221
xiii
List of Figures
Figure 1.1 Types of hydrogen bond arrays: Linear, Bent, Donating Bifurcated, Accepting
Bifurcated, Trifurcated, and Three Center Bifurcated. ... 8
Figure 1.2 DDD-AAA hydrogen bond arrays studied by Wisner and coworkers. ... 9
Figure 1.3 The effect of the number of hydrogen bonding sites on the stability (Ka) of different arrays. ... 11
Figure 1.4 Hydrogen Bond Arrays studied by Jörgensen and Pranata. ... 12
Figure 1.5 Secondary hydrogen bond interactions in triply hydrogen bonded arrays. ... 13
Figure 1.6 Triple hydrogen bond complexes studied by Zimmerman and Murray. ... 13
Figure 1.7 Nucleotide base pairs in DNA. ... 15
Figure 1.8 (A) A guanidine tetramer reported by Sundquist and Klung; (B) A molecular duplex reported by Chu and coworkers. ... 15
Figure 1.9 Murray and Zimmerman DAA-ADD complex structures. Association constants (Kass) calculated in a 5% DMSO-d6-CDCl3 solvent system. ... 17
Figure 1.10 Generalized profile of hydrogen bond interactions between solute and solvent. 23 Figure 1.11 Absorption spectra of A and B………...33
Figure 1.12 Cyclization plots of a (A) fatigue resistant material and (b) a non-fatigue resistant material after 10 cycles ………35
Figure 1.13 Changes in the absorption spectrum of trans-azobenzene (E isomer) upon irradiation with 316 nm light. ... 37
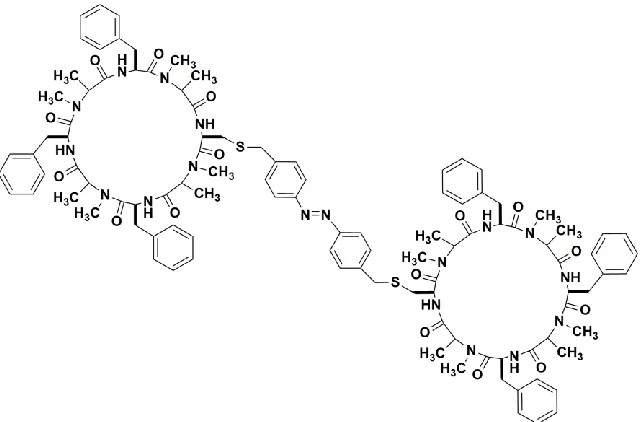
Figure 1.14 Ghadiri’s peptide photoswitchable system. ... 44
xiv
... 56
Figure 2.3 (A) Schematic representation of 2,6-diaminopyridinium
tetraphenylborate-1,2-bis(5,7-dimethyl-1,8-naphthyridin-2-yl)diazene (1/1) complex. (B) Solid state structure
obtained by X-Ray diffraction of single crystal. ... 56
Figure 2.4 Structures of the different locations of a donor group in an azoheteroaromatic
backbone and their putative dimers using six-membered azoheteroaromatics. ... 59
Figure 2.5 (A) Selective systematic substitution of cyanuric chloride at different temperatures.
(B) Selective systematic substitution strategy employed... 60
Figure 2.6 1H NMR spectra displaying the concentration-dependent behavior of 4o in CDCl3
at 298 K. (i) 5.59 x 10⁻⁴ M, and (ii) 1.61 x 10⁻² M. ... 69 Figure 2.7 1H NMR spectra displaying the concentration-dependent behavior of 4f in
Toluene-d8at 298 K. (i) 2.45 x 10⁻³ M (Ha signal covered by the toluene reference signal), (ii) 8.56 x
10-3 M, and (iii) 1.61 x 10⁻² M. ... 69 Figure 2.8 Amino’s proton assignment based on chemical shift in compounds 4a-p. ... 70
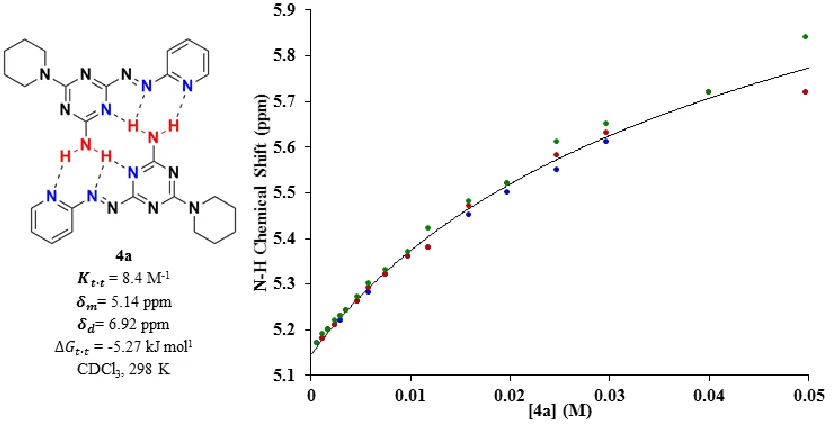
Figure 2.9 Dimerization isotherm of 4a with 𝑲𝒕∙𝒕 value and free energy calculated from fitting of the data to a 1:1 dimerization model. Blue, green and red dots correspond to first, second
and third separate dilution experiments, respectively. Solid line corresponds to the theoretical
dilution curve obtained from the average 𝑲𝒕∙𝒕 of three separate dilution experiments. ... 71
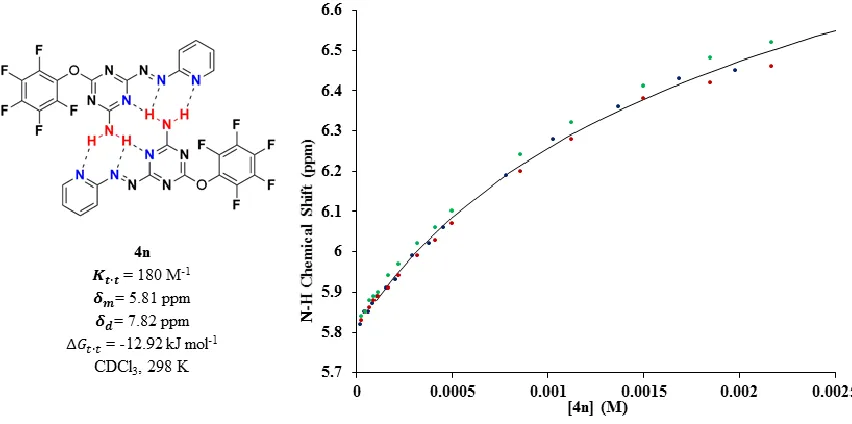
Figure 2.10 Dimerization isotherm of 4n with 𝑲𝒕∙𝒕 value and free energy calculated from
fitting of the data to a 1:1 dimerization model. Blue, green and red dots correspond to first,
second and third separate dilution experiments, respectively. Solid line corresponds to the
theoretical dilution curve obtained from the average 𝑲𝒕∙𝒕 of three separate dilution
experiments. ... 72
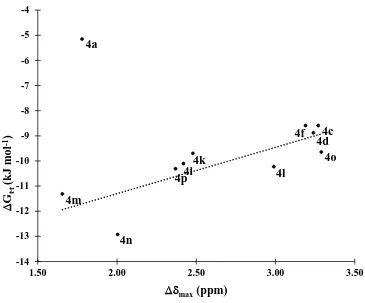
Figure 2.11 Plot of ∆𝑮𝒕∙𝒕 vs ∆𝜹𝒎𝒂𝒙 for derivatives 4a-p in CDCl3 at 298 K. Dotted line
xv
∆𝑮𝒕∙𝒕 𝝈𝒎 3
Dotted line corresponds to the least squares correlation line (r = -0.9861). ... 74
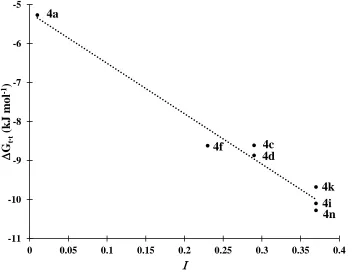
Figure 2.13 Plot of ∆𝑮𝒕∙𝒕 vs I of derivatives 4a, 4c, 4d, 4f, 4i, 4k and 4n in CDCl3 at 298 K.
Dotted line corresponds to the least squares correlation line (r = -0.9848). ... 74
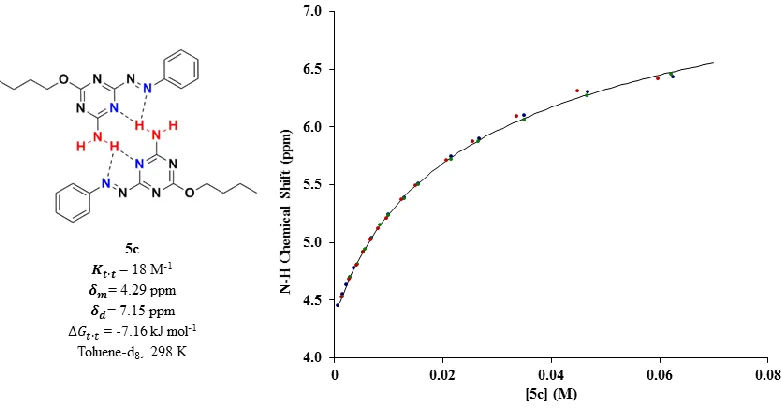
Figure 2.14 Dimerization isotherm of 5c with 𝑲𝒕∙𝒕 value and free energy calculated from fitting of the data to a 1:1 dimerization model. Blue, green and red dots correspond to first, second
and third separate dilution experiments, respectively. Solid line corresponds to the theoretical
dilution curve obtained from the average 𝑲𝒕∙𝒕 of three separate dilution experiments. ... 78
Figure 2.15 Dimerization isotherm of 4c with 𝑲𝒕∙𝒕 value and free energy calculated from fitting of the data to a 1:1 dimerization model. Blue, green and red dots correspond to first, second
and third separate dilution experiments, respectively. Solid line corresponds to the theoretical
dilution curve obtained from the average 𝑲𝒕∙𝒕 of three separate dilution experiments. ... 78
Figure 2.16 Stick representation of the X-ray crystal structure of 4a dimer with intermolecular hydrogen bonds indicated (dashed orange lines). Blue, grey and white correspond to nitrogen,
carbon and hydrogen atoms, respectively. ... 82
Figure 2.17 Stick representation of the X-ray crystal structure of 4d dimers with intermolecular hydrogen bonds indicated (dashed orange lines). Blue, grey, white and red correspond to
nitrogen, carbon, hydrogen and oxygen atoms, respectively. ... 84
Figure 2.18 Stick representation of the X-ray crystal structure of 4d with C-H∙∙∙N interactions indicated (dashed orange lines). Blue, grey, white and red correspond to nitrogen, carbon,
hydrogen and oxygen atoms, respectively. ... 86
Figure 2.19 Stick representation of the X-ray crystal structure of 4f dimer with intermolecular hydrogen bonds indicated (dashed orange lines). Blue, grey, white and yellow correspond to
nitrogen, carbon, hydrogen and sulfur atoms, respectively. ... 88
Figure 2.20 Stick representation of the X-ray crystal structure of 4f with indicating C-H∙∙∙N interactions (dashed orange lines). Blue, grey, white and yellow correspond to nitrogen,
xvi
hydrogen bonds indicated (dashed orange lines). Blue, grey, white and red correspond to
nitrogen, carbon, hydrogen and oxygen atoms, respectively. ... 91
Figure 2.22 Stick representation of the X-ray crystal structure of 4k with indicating C-H∙∙∙ interactions (dashed orange lines). Blue, grey, white and red correspond to nitrogen, carbon,
hydrogen and oxygen atoms, respectively. ... 92
Figure 2.23 Donor and acceptor sites assignment of 4a, 4d, 4f and 4k dimers. ... 93
Figure 3.1 Normalized UV-Vis Absorption Spectra of derivatives (t)-4a-p in acetonitrile at 298 K. ... 140
Figure 3.2 UV-Vis absorption spectra of (c)-4c and its thermal reversion to (t)-4c in acetonitrile at 298 K (4c total concentration =1.71 x 10⁻⁴ M). ... 143 Figure 3.3 UV-Vis absorption spectra of (c)-4f and its thermal reversion to (t)-4f in acetonitrile at 298 K (4f total concentration =1.67x10⁻⁴ M). ... 144 Figure 3.4 UV-Vis absorption spectra of (c)-4k and its thermal reversion to (t)-4k in acetonitrile at 298 K (4k total concentration = 3.72x10⁻⁵ M). ... 145 Figure 3.5 1H NMR spectra displaying derivative 4p at PSS in CDCl3 at 298 K. RX =
4’-tritylphenoxy. ... 146
Figure 3.6 1H NMR spectra displaying derivative 4d at (i) PSS, and (ii) after complete cis- to
trans- thermal reversion in CD3CN at 298 K. RX = n-octyloxy. ... 147
Figure 3.7 Cyclization plot of 4c ([4c] = 9.1 x 10⁻⁴ M). Purple areas correspond to the N-H chemical shift change after UV light irradiation (centered at 360 nm for 1h). White areas
correspond to the N-H chemical shift change after visible light irradiation ( > 400 nm for 10
minutes). Yellow area correspond to the N-H chemical shift observed after thermal reversion
of the solution over 72h………..149
xvii 𝑲𝒕∙𝒄 𝜹𝒕𝒄 𝜹𝑶𝒃𝒔
total concentration [4c] = 3.42 x 10⁻³ M. ... 158 Figure 3.10 1H NMR spectra displaying the concentration-dependent behavior of 4c in
toluene-d8at 298 K. Total concentration [4c] = 3.27 x 10⁻³ M, (i) [c]0/[t]0 = 1.73 (ii) [c]0/[t]0 = 0.93,
(iii) [c]0/[t]0 = 0.59, (iv) [c]0/[t]0 = 0.33, (v) [c]0/[t]0 = 0.22, and (vi) [c]0/[t]0 = 0. ... 159
Figure 3.11 Relationship between 𝜹𝑶𝒃𝒔 vs [𝒕]0during a thermal reversion experiment of
derivative 4c. Red dots correspond to a reversion experiments ([4c] = and 2.90 x 10⁻³ M). Solid line corresponds to the theoretical dilution curve obtained from the average of three separate
dilution experiments with (t)-4c... 160
Figure 3.12 Top Plot: Theoretical 𝑲𝒕∙𝒄 vs 𝜹𝒕𝒄 curves for the set of 𝜹𝑶𝒃𝒔 from the least squares line that describes third reversion experiment of derivative 4c (Green dots at Figure 3.10, [4c] = 3.42 x 10⁻³ M). Bottom Plot: Theoretical CV vs 𝜹𝒕𝒄 curve for the set of 𝑲𝒕∙𝒄 calculated from the third reversion experiment of derivative 4c (Green dots at Figure 3.8, [4c] = 3.42 x 10⁻³ M). ... 161
Figure 3.13 Top Plot: 𝑲𝒕∙𝒄 vs 𝜹𝒕𝒄 curves for the set of 𝜹𝑶𝒃𝒔 from the third reversion experiment
of derivative 4c (green dots at Figure 3.10, [4c] = 3.42 x 10⁻³ M). Bottom Plot: CV vs 𝜹𝒕𝒄 curve for the set of 𝑲𝒕∙𝒄 calculated from the third reversion experiment of derivative 4c (Green dots at Figure 3.8, [4c] = 3.42 x 10⁻³ M). ... 162 Figure 3.14 Relationship between 𝜹𝑶𝒃𝒔 vs [𝒕]0 for three reversion experiments of derivative
4c. Blue, red and green dots correspond to first, second and third separate reversion experiments, respectively. Blue, red and green dashed lines correspond to the calculated 𝜹𝑶𝒃𝒔
vs [𝒕]0 plots for the first, second and third reversion experiments with the 𝑲𝒕∙𝒄 and 𝜹𝒕𝒄 values with minimum CV (sample standard deviations of 0.003, 0.003 and 0.008 ppm, respectively).
Solid line corresponds to the dilution curve obtained for (t)-4c from the average of three separate dilution experiments. ... 164
Figure 3.15 Relationship between 𝜹𝑶𝒃𝒔 vs [𝒕]0 for three reversion experiments of derivative
xviii
[𝒕]0 𝑲𝒕∙𝒄 𝜹𝒕𝒄
with minimum CV (sample standard deviations of 0.01, 0.005 and 0.02 ppm, respectively).
Solid line corresponds to the dilution curve obtained for (t)-4f from the average of three separate dilution experiments. ... 165
Figure 3.16 Relationship between 𝜹𝑶𝒃𝒔 vs [𝒕]0 for three reversion experiments of derivative
4k. Blue, red and green dots correspond to first, second and third separate reversion experiments, respectively. Blue, red and green dashed lines correspond to the calculated 𝜹𝑶𝒃𝒔
vs [𝒕]0 plots for the first, second and third reversion experiments with the 𝑲𝒕∙𝒄 and 𝜹𝒕𝒄 values with minimum CV (sample standard deviations of 0.03, 0.02 and 0.04 ppm, respectively). Solid
line corresponds to the dilution curve obtained for (t)-4k from the average of three separate dilution experiments... 166
Figure 3.17 Structural similarities between trans-trans, cis-cis dimers and the trans-cis
complex in mixed solution of 4a-p. ... 167
Figure 3.18 Relationship between 𝜹𝑶𝒃𝒔 vs [𝒕]0 through three reversion experiments of the derivative 4k. Blue, red and green dots correspond to first, second and third separated reversion experiments, respectively. Blue, red and green dashed lines correspond to the predicted 𝜹𝑶𝒃𝒔
vs [𝒕]0 plots for the first, second and third reversion experiments with the expected ∆𝑮 values (sample standard deviations of 0.05, 0.12, 0.11 ppm, respectively). Solid line corresponds to
the dilution curve obtained from the average of three separated dilution experiments. ... 169
Figure 3.19 Potential N-H/ intermolecular interactions in (A) 4ktrans-cis complex structure; and (B) 5k dimer structure. ... 169
Figure 3.20 Theoretical speciation diagram of derivative 4c at the third reversion experiment (green dots at Figure 3.10, [4c] = 3.42 x 10⁻³ M) at 298 K. Solid lines correspond to the first scenario (𝑲𝒄∙𝒄 = 𝟎) and dotted-star marked lines correspond to the second scenario (𝑲𝒄∙𝒄 = 18 M-1) respectively. Blue, red, orange, yellow and brown colors correspond to [𝒕], [𝒕 ∙ 𝒕], [𝒕 ∙ 𝒄],
xix
(green dots at Figure 3.14, [4f] = 2.35 x 10⁻³ M) at 298 K. Solid lines correspond to the first scenario (𝑲𝒄∙𝒄 = 𝟎) and dotted-star marked lines correspond to the second scenario (𝑲𝒄∙𝒄 = 26
M-1) respectively. Blue, red, orange, yellow and brown colors correspond to [𝒕], [𝒕 ∙ 𝒕], [𝒕 ∙ 𝒄],
[𝒄], and [𝒄 ∙ 𝒄], respectively. Black dotted line corresponds to maximum cis/trans ratio in reversion experiment. Grey dotted line corresponds to cis/trans ratio at PSS... 172
Figure 3.22 Theoretical speciation diagram of derivative 4k at the third reversion experiment (green dots at Figure 3.15, [4k] = 1.84 x 10⁻³ M) at 298 K. Solid lines correspond to the first
scenario (𝑲𝒄∙𝒄 = 𝟎) and dotted-star marked lines correspond to the second scenario (𝑲𝒄∙𝒄 = 46
M-1) respectively. Blue, red, orange, yellow and brown colors correspond to [𝒕], [𝒕 ∙ 𝒕], [𝒕 ∙ 𝒄],
[𝒄], and [𝒄 ∙ 𝒄], respectively. Black dotted line corresponds to maximum cis/trans ratio in reversion experiment. ... 173
Figure 3.23 Decay profiles of (c)-4c isomer in toluene-d8 at 298 K. Blue, red and green dots
correspond to first, second and third separate reversion experiments (r = -0.9973, -0.9982
and -0.9981) respectively. Blue, red and green dashed lines correspond to the calculated values
obtained by linear least squares regression of the first, second and third separate reversion
experiments, respectively. ... 175
Figure 3.24 Decay profiles of (c)-4f isomer in toluene-d8 at 298 K. Blue, red and green dots correspond to first, second and third separate reversion experiments (r = -0.9995, -0.9981
and -0.9987) respectively. Blue, red and green dashed lines correspond to the calculated values
obtained by linear least squares regression of the first, second and third separate reversion
experiments, respectively. ... 176
Figure 3.24 Decay profiles of (c)-4k isomer in toluene-d8 at 298 K. Blue, red and green dots correspond to first, second and third separate reversion experiments (r = -0.9954, -0.9907
and -0.9962) respectively. Blue, red and green dashed lines correspond to the calculated values
obtained by linear least squares regression of the first, second and third separate reversion
experiments, respectively. ... 177
xx
DDAAA hydrogen bond arrays. ... 186
Figure 4.3 Dimerization isotherm of 7c with 𝑲𝒕∙𝒕 value and free energy calculated from fitting
of the data to a 1:1 dimerization model. Blue, green and red dots correspond to first, second
and third separate dilution experiments, respectively. Solid line corresponds to the theoretical
dilution curve obtained from the average 𝑲𝒕∙𝒕 of three separate dilution experiments. ... 193
Figure 4.4 Dimerization isotherm of 7g with 𝑲𝒕∙𝒕 value and free energy calculated from fitting of the data to a 1:1 dimerization model. Blue, green and red dots correspond to first, second
and third separate dilution experiments, respectively. Solid line corresponds to the theoretical
dilution curve obtained from the average 𝑲𝒕∙𝒕 of three separate dilution experiments. ... 194
Figure 4.5 Correlation plot of 𝒍𝒏𝑲𝒕∙𝒕 vs ∆𝜹𝒎𝒂𝒙 for all derivatives 7 in CDCl3 at 298 K (r =
0.8595). ... 195
Figure 4.6 Correlation plot of ∆𝑮𝒕∙𝒕 vs 𝝈𝒎 of derivatives 7c, 7f, 7g, 7i and 7k in toluene-d8at 298 K. Dotted line corresponds to the least squares correlation line (r = -0.91784). ... 196
Figure 4.7 Correlation plot of ∆𝑮𝒕∙𝒕 vs I of derivatives 7c, 7f, 7g, 7i, and 7k in CDCl3 at 298
K. Dotted line corresponds to the least squares correlation line (r = -0.86027). ... 196
Figure 4.8 Dimerization isotherm of 7n with 𝑲𝒕∙𝒕 value and free energy calculated from fitting
of the data to a 1:1 dimerization model. Blue, green and red dots correspond to first, second
and third separate dilution experiments, respectively. Solid line corresponds to the theoretical
dilution curve obtained from the average 𝑲𝒕∙𝒕 of three separate dilution experiments. ... 197
Figure 4.9 Dimerization isotherm of 7c with 𝑲𝒕∙𝒕 value and free energy calculated from fitting of the data to a 1:1 dimerization model. Blue, green and red dots correspond to first, second
and third separate dilution experiments, respectively. Solid line corresponds to the theoretical
dilution curve obtained from the average 𝑲𝒕∙𝒕 of three separate dilution experiments. ... 198
Figure 4.10 Dimerization isotherm of 7f with 𝑲𝒕∙𝒕 value and free energy calculated from fitting
xxi
dilution curve obtained from the average 𝑲𝒕∙𝒕 of three separate dilution experiments. ... 198
Figure 4.11 Stick representation of the X-ray crystal structure of 7c dimer with intermolecular hydrogen bond indicated (dashed orange lines). Blue, grey, white and red correspond to
nitrogen, carbon, hydrogen and oxygen atoms, respectively. ... 204
Figure 4.12 Stick representation of the X-ray crystal structure of 7f dimer A-A’ with intermolecular hydrogen bonds indicated (dashed orange lines). Blue, grey, white, red and
yellow correspond to nitrogen, carbon, hydrogen, oxygen and sulfur atoms, respectively. . 206
Figure 4.13 Stick representation of the X-ray crystal structure of 7f dimer B-B’ with intermolecular hydrogen bonds indicated (dashed orange lines). Blue, grey, white, red and
yellow correspond to nitrogen, carbon, hydrogen, oxygen and sulfur atoms, respectively. . 207
Figure 4.14 Selected molecules in the crystal lattice of 7f. Green and blue structures correspond to dimer A-A’ and dimer B-B’, respectively. ... 208
Figure 4.15 Stick representation of the X-ray crystal structure of 7f with C-H∙∙∙N interactions indicated (dashed orange lines). Blue, grey, white, red and yellow correspond to nitrogen,
carbon, hydrogen, oxygen and sulfur atoms, respectively. ... 208
Figure 4.16 Stick representation of the X-ray crystal structure of 7k array with intermolecular hydrogen bond indicated (dashed orange lines). Blue, grey, white and red correspond to
nitrogen, carbon, hydrogen and oxygen atoms, respectively. View perpendicular to ab plane. All C-H hydrogen atoms removed for clarity. ... 210
Figure 4.17 Stick representation of the X-ray crystal structure of 7k layout with intermolecular hydrogen bond indicated (dashed orange lines). Blue, grey, white and red correspond to
nitrogen, carbon hydrogen and oxygen atoms, respectively. View perpendicular to the bc plane. All C-H hydrogen atoms removed for clarity. ... 210
Figure 4.18 Stick representation of the X-ray crystal structure of 7n dimer with intermolecular hydrogen bond indicated (dashed orange lines). Blue, grey, white, red and green correspond to
xxii
Figure 4.20 Normalized UV-Vis Absorption Spectra of derivatives (t)-7 in acetonitrile at 298 K. ... 215
Figure 4.21 UV-Vis absorption spectra of (c)-7c and its thermal reversion to (t)-7c in acetonitrile at 298 K (7c total concentration = 1.26 x 10⁻⁴ M). ... 217
Figure 4.22 1H NMR spectra displaying derivative 7c at PSS in toluene-d8 at 298 K. RX = n -butoxy. ... 219
Figure 4.23 1H NMR spectra displaying derivative 7c at PSS in toluene-d
8 at 298 K. RX = n -butoxy. ... 220
Figure 4.24 Cyclization plot of 7c ([7c] = 9.11 x 10⁻⁴ M). Purple areas correspond to the N-H chemical shift change after UV light irradiation (centered at 360 nm for 1h). White areas
correspond to the N-H chemical shift change after visible light irradiation ( > 400 nm for 10
minutes). Yellow area correspond to the N-H chemical shift observed after thermal reversion
of the solution over 72h ………221
Figure 4.25 Complexation equilibria present in mixed cis/trans solutions of derivatives 7 in non-polar solvents. ... 224
Figure 4.26 Dimerization isotherm of 7c with 𝑲𝒕∙𝒕 value and free energy calculated from fitting of the data to a 1:1 dimerization model. Blue and green dots correspond to first and second
separate dilution experiments, respectively. Solid line corresponds to the theoretical dilution
curve obtained from the average 𝑲𝒕∙𝒕 of two separate dilution experiments. ... 227
Figure 4.27 1H NMR spectra displaying the concentration-dependent behavior of 7c in toluene-d8 at 298 K. Total concentration [7c] = 5.84 x 10⁻³ M, (i) [c]0/[t]0 = 1.11 (ii) [c]0/[t]0 = 0.33.
... 228
Figure 4.28 Relationship between 𝜹𝑶𝒃𝒔 vs [𝒕]0 during a thermal reversion experiment of derivative 7c. Blue dots correspond to a reversion experiment ([7c] = 8.8 x 10⁻⁴ M). Solid line corresponds to the theoretical dilution curve obtained from the average of two separate dilution
xxiii
𝑲𝒕∙𝒄 𝜹𝒕𝒄 𝜹𝑶𝒃𝒔
squares curve that describes the third reversion experiment of derivative 7c (red dots in Figure 4.31, [7c] = 1.47 x 10⁻³ M). Bottom Plot: Theoretical CV vs 𝜹𝒕𝒄 curve for the set of 𝑲𝒕∙𝒄
calculated from the third reversion experiment of derivative 7c (red dots at Figure 4.31, [7c] = 1.47 x 10⁻³ M). ... 230 Figure 4.30 Top Plot: 𝑲𝒕∙𝒄 vs 𝜹𝒕𝒄 curves for the set of 𝜹𝑶𝒃𝒔 from the third reversion experiment of derivative 7c (red dots in Figure 4.31, [7c] = 1.47 x 10⁻³ M). Bottom Plot: CV vs 𝜹
𝒕𝒄 curve
for the set of 𝑲𝒕∙𝒄 calculated from the third reversion experiment of derivative 7c (red dots at Figure 4.31, [7c] = 1.47 x 10⁻³ M). ... 231 Figure 4.31 Relationship between 𝜹𝑶𝒃𝒔 vs [𝒕]0 through three reversion experiments of the derivative 7c. Blue, green and red dots correspond to first, second and third separate reversion experiments, respectively. Blue, green and red dashed lines correspond to the predicted 𝜹𝑶𝒃𝒔
vs [𝒕]0 plots for the first, second and third reversion experiments with the expected ∆𝑮 values
(sample standard deviations of 0.006, 0.003, 0.01 ppm, respectively). Solid line corresponds
to the dilution curve obtained from the average of two separate dilution experiments. ... 232
Figure 4.32 Theoretical speciation diagram of derivative 7c at the third reversion experiment (red dots at Figure 4.31, [7c] = 1.47 x 10⁻³ M) at 263 K. Solid lines correspond to the first scenario (𝑲𝒄∙𝒄 = 0) and dotted-star marked lines correspond to the second scenario (𝑲𝒄∙𝒄 = 68 M-1) respectively. Blue, red, orange, yellow and brown colors correspond to [𝒕], [𝒕 ∙ 𝒕], [𝒕 ∙ 𝒄],
[𝒄], and [𝒄 ∙ 𝒄], respectively. Black dotted line corresponds to maximum cis/trans ratio in reversion experiment. Grey dotted line corresponds to cis/trans ratio at PSS... 233
Figure 4.33 Decay profiles of (c)-7c isomer in toluene-d8 at 298 K. Blue, red and green dots correspond to first, second and third separate reversion experiments (r = -0.9934, -0.9966,
-0.9981) respectively. Blue, red and green dashed lines correspond to the calculated values
obtained by linear least squares regression of the first, second and third separate reversion
experiments, respectively. ... 235
Figure 4.34 Decay profiles of (c)-7c isomer in toluene-d8 at 263 K. Blue, green and red dots correspond to first, second and third separate reversion experiments (r = -0.9816, -0.9574
xxiv
xxv
List of Schemes
Scheme 1.1 Hydrogen Bond Interaction. ... 5
Scheme 1.2 Preorganization Principle. ... 16
Scheme 1.3 Equilibria between tautomeric forms of 6[1H]-pyrimidinone. ... 19
Scheme 1.4 Zimmerman’s group system tautomers. ... 20
Scheme 1.5 Monomers desolvation upon complex formation. ... 21
Scheme 1.6 Photochromic compounds which transform via cis-trans (Z∕E) isomerization (h1<h2). ... 26
Scheme 1.7 Photochromic compounds which transform via intermolecular pericyclic reactions
(h1<h2). ... 26
Scheme 1.8 Photochromic compounds which transform via intramolecular pericyclic reactions
(h1<h2). ... 27
Scheme 1.9 Photochromic compounds which transform via intramolecular group transfer
(h1<h2). ... 28
Scheme 1.10 The visual cycle of Retinal/Retinol. ... 29
Scheme 1.11 Hecht and Gostl small molecules release system controlled via photoswitching.
... 30
Scheme 1.12 Branda and coworkers polymer with adhesive properties controlled by
photoswitching. ... 31
Scheme 1.13 Photodegradation of Spirooxazines and Spiropyrans. ... 34
Scheme 1.14 Photoisomerization of Azobenzene. ... 36
xxvi
Scheme 1.17 Photo-controlled assembly of pseudorotaxane. ... 43
Scheme 1.18 Aggregation pattern changes after photoisomerization. ... 44
Scheme 1.19 Photoswitchable catalyst by Pericas and coworkers. ... 45
Scheme 2.1 Supramolecular thermoplastic elastomer obtained by functionalizing
poly(ethylene-butylene) with self-associating ureidopyrimidinone ending groups. ... 54
Scheme 2.2 A proposed photoswitchable self-complementary DDAAA hydrogen bond array and its idealized function. ... 61
Scheme 2.3 Synthesis of photoswitchable self-complementary DDAAA hydrogen bond arrays
4a-p. ... 61
Scheme 2.4 Dimerization equilibrium of 4a-p. ... 65
Scheme 2.5 Synthesis of (E)- 6-(phenyldiazenyl)-1,3,5-triazin-2-amine, derivatives 5c, 5f and
5k. ... 75
Scheme 3.1 Takeshita’s photoreversible supramolecular polymer... 133
Scheme 3.2 Yokoyama’s indolylfulgimide – bis(acylamino)pyridine complex. ... 135
Scheme 3.3 Photoswitchable triple hydrogen bond motif studied by Hecht and coworkers. 135
Scheme 3.4 Photoisomerization of derivatives 4a-p. ... 136
Scheme 3.5 Complexation equilibria present in mixed cis/trans solutions of derivatives 4a-p
in non-polar solvents. ... 138
Scheme 3.6 Complexation equilibria involving the 4a-ptrans-isomer. ... 152
Scheme 3.7 Complexation equilibria involving the 4a-pcis-isomer. ... 153
xxvii
Scheme 4.3 Improved photoswitchable self-complementary AAADD hydrogen bond array.
... 191
Scheme 4.4 Amended photoswitchable self-complementary AAADD hydrogen bond array and its idealized function………...190
Scheme 4.5 Synthesis of second generation photoswitchable self-complementary DDAAA
hydrogen bond arrays………190
Scheme 5.1 Preorganized photo-isomerizable self-complementary hydrogen bond arrays. n =
1 or 2………..249
Scheme 5.2 Proposed inclusion of photo-isomerizable self-complementary hydrogen bond
xxviii
List of Abbreviations and Symbols
(+R) electron donating resonance effect (-I) electron withdrawing inductive effect
A hydrogen bond acceptor
hydrogen bond donor properties
hydrogen bond acceptor properties
molar fraction
CD3CN deuterated acetonitrile
CDCl3 deuterated chloroform
CV coefficient of variation
D hydrogen bond donor
Heat
chemical shift
D Donor
𝜹𝒅 chemical shift of dimer
∆𝑮 free energy
∆∆𝑮 free energy difference
𝜹𝒎 chemical shift of monomer
DMSO-d6 deuterated dimethylsulfoxide
DNA deoxyribonucleic acid
𝜹𝑶𝒃𝒔 chemical shift observed
𝜹𝒕𝒄 chemical shift of trans-cis complex
E entgegen or cis
extinction coefficient
EI-HRMS Electron Impact Ionization High Resolution Mass Spectrometry
eq. Equivalent
quantum yield
g Grams
h Hours
xxix
IR Infrared
IUPAC International Union of Pure and Applied Chemistry
K rate of reaction
K Kelvin
Ka association constant
𝑲𝒄∙𝒄 cis-cis dimerization constant
kcal Kilocalories
kJ kiloJoules
𝑲𝒕∙𝒄 trans-cis complexation constant
𝑲𝒕∙𝒕 trans-trans complexation constant
wavelength
LRAT Lechtin retinol acyltransferase
M Multiplet
m.p. melting point
M-1 per molar
min Minutes
mL mililiters
L Microliters
mmol Milimole
mol-1 per mole
NMR Nuclear Magnetic Resonance
NOESY Nuclear Overhauser Effect Spectroscopy
ºC Celsius
pi orbital
pH minus logarithm of proton concentration
ppm parts per million
PSS Photostationary State
R linear correlation coefficient
xxx
RNA Ribonucleic acid
RPE65 Retinoid isomeraze
R.T. room temperature
RX substituent group
S Singlet
m substituent constnat at meta-position
T Triplet
T Temperature
THF Tetrahydrofuran
TLC thin layer chromatography
UV ultraviolet light
Vis visible light
vs. Versus
Chapter 1
1
Introduction
1.1
Supramolecular Chemistry
In Jean-Marie Lehn’s words, Supramolecular Chemistry is “… a highly interdisciplinary field of science covering the chemical, physical, and biological features of chemical species of higher complexity, which are held together and organized by means of intermolecular (noncovalent) binding interactions”.1
The roots of this relatively young area can be traced back to the nineteenth century
with contributions from studies in organic chemical and biological systems. The synthesis
of the first (and arguably most employed) host molecules, the cyclodextrins by Antoine
Villiers in 1891,2 the introduction of “lock-and-key” concept by Emil Fischer in 1894,3 the “induced fit” concept by Daniel E. Koshland in 1958,4 and the description of an observed
carboxylic acid complex as “Übermoleküle” (supramolecule in German) by Karl Lothar
Wolf in 1937,5 were some of the earliest contributions that made possible the emergence
of more advanced tailored hosts such as the crown ethers of Charles Pedersen in 1967,6,7 the cation and anion cryptates of Jean-Marie Lehn in 19698,9 and the spherands of Donald J. Cram in 1973.10,11 The latter three were awarded the Nobel Prize for Chemistry in 1987 for their work in supramolecular chemistry.12
More recently, supramolecular chemistry has evolved and broadened its scope. It
mixtures such as the transportation of alkali metal ions through cell membranes,13,14 and the enzyme-substrate catalysis in living systems.13-16 Supramolecular chemistry now
creates its own subjects to study by developing sophisticated and complex arrays to serve
specific purposes in different fields.19-21
The aim of this first chapter is to provide the context to understand and locate the
contribution of the systems presented in the following chapters. It will cover basic concepts
that describe supramolecular complexes and the specific intermolecular interactions that
operate in our arrays. Likewise, this chapter will present the photochemical basis that
operates in our proposed arrays and the state of the art regarding the use of photochromic
compounds in supramolecular chemistry.
1.2
Molecular Recognition
Molecular recognition is known as the strong, selective and reversible stabilizing
interaction of one molecule with another to form a well-defined spatial arrangement
between them. Initially, the term molecular recognition was exclusively employed to
describe biological systems. However, it was discovered that the occurrence and effects of
this event were not limited to that discipline and that it could be applied in a wide range of
other scientific and technologic fields.22
Based on the definition provided in the previous paragraph, it could be said that
there are two main features that characterize molecular recognition: the intermolecular
1.3
Intermolecular Interactions
Also known as supramolecular and non-covalent interactions, intermolecular
interactions are the overall result of attractive and repulsive forces between identified
separated entities, i.e. molecules, chemical groups within the same molecule, ions, and/or
atoms. The energies associated with these interactions range from < 2 kJ mol-1 for dispersion interactions to 300 kJ mol-1 for ion – ion interactions in non-polar media23 (Table 1.1).
At a macroscopic level, these interactions are responsible for aspects of many
important physical properties of matter such as density, boiling point, solvation, surface
tension and redox potentials. In biology, intramolecular interactions explain the three
dimensional structures of proteins,24-26 DNA27 and RNA. Likewise, they participate in well-known processes such as carbohydrate recognition28,29 and the transport of cations in
biological systems.30,31 Lastly, these interactions are useful in materials science to create specific crystal packing systems (crystal engineering),32,33 molecular systems with
Table 1.1 Intermolecular Interactions.23
Interaction Strength (kJ mol-1) Example Directionality
Ion – ion 200 – 300 Tetrabutylammonium chloride Low
Ion – dipole 50 – 200 Sodium[15]crown-5 Medium
Dipole – dipole 5 – 50 Acetone Medium
Hydrogen
Bonding 4 – 120
Medium
Cation - 5 – 180 K+ in benzene Medium
- 0 – 50 Benzene and graphite Medium
van der Waals < 5 Argon, packing in molecular crystals
Low
Hydrophobic (solvophobic)
Related to solvent – solvent interaction
energy
Cyclodextrin inclusion compounds.
Low
From the intermolecular interactions listed above, hydrogen bonds have arguably
received the most attention since they are often a central interaction in determining
molecular recognition and aggregation in chemical and biological systems. Similarly, due
to their strength and directionality, hydrogen bonds have been one of the primary strategies
1.4
Hydrogen Bond.
1.4.1
Definition.
In 2011, IUPAC presented a technical report in which a new definition of hydrogen
bond was provided. This definition states that the hydrogen bond is an attractive interaction between a hydrogen atom from a molecule or a molecular fragment X-H in which X is more electronegative than H, and an atom or group of atoms in the same or a different molecule (Y), in which there is evidence of bond formation (Scheme 1.1).37
Scheme 1.1 Hydrogen Bond Interaction.
The definition provided by IUPAC is broad and requires evidence of bond formation.
According to IUPAC, there are some criteria of what is considered bond formation
evidence which includes:
1) Geometry: The angle formed between the three atoms that participate in the
hydrogen bond interaction usually tends to be linear.
2) The nature of the physical forces involved: Although a hydrogen bond is not
considered to be purely electrostatic, it is recognized for its substantial contribution
due to the directionality of this interaction. Other contributions to the hydrogen
bond are polarization, charge transfer, exchange repulsion and dispersion forces
3) Spectroscopy: The effects of the hydrogen bond in the absorption of different types
of energy is observed in the red shifting in the X-H vibrational frequency in an IR
spectrum and the deshielding of H in HX in a 1H NMR spectrum.
1.4.2
Classification.
Throughout the literature, the hydrogen bond has been classified into three main
categories based on geometry, energy, thermodynamics and function in nature, which are
summarized in Table 1.2.40-42
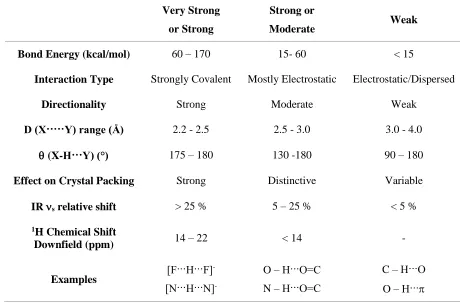
Table 1.2 Categories of hydrogen bond interaction and some of their important properties.
Very Strong
or Strong
Strong or
Moderate Weak
Bond Energy (kcal/mol) 60 – 170 15- 60 < 15
Interaction Type Strongly Covalent Mostly Electrostatic Electrostatic/Dispersed
Directionality Strong Moderate Weak
D (X·····Y) range (Å) 2.2 - 2.5 2.5 - 3.0 3.0 - 4.0
(X-H···Y) (°) 175 – 180 130 -180 90 – 180
Effect on Crystal Packing Strong Distinctive Variable
IR s relative shift > 25 % 5 – 25 % < 5 %
1H Chemical Shift
Downfield (ppm) 14 – 22 < 14 -
Examples [F···H···F]
-
[N···H···N]
-O – H···-O=C
N – H···O=C
C – H···O
This classification is meant to be a broad guide to the hydrogen bond interactions
observed in nature and used in the design and construction in crystal engineering and
supramolecular chemistry. The terminology employed would depend on the author
referred. Desiraju and Steiner classified hydrogen bonds as very strong, strong and weak
based on the observation that hydrogen bonds that fall into the category of strong are
interactions that are able to control crystal and supramolecular structure effectively. On the
other hand, Jeffrey named the same categories as strong, moderate and weak in order to be
in tune with biological literature since moderate hydrogen bond interactions are usually
observed in chemistry and nature, as the other two categories being the minority exception.
Another way to classify the hydrogen bond interaction is in accordance to the
different spatial arrays formed between the hydrogen bond donors (which are the molecular
fragments X-H), D, and the hydrogen bond acceptors (the counterparts Y), A (Scheme 1.1
and Figure 1.1). The appearance of different hydrogen bond arrays is explained due to the
attractive force of extra binding sites; i.e. donors and/or acceptors. The angles described
are often significantly different from linearity; therefore, these types of arrays are not
expected in very strong (or strong according to Jeffrey’s classification) hydrogen bond
interactions. These configurations are known as donating bifurcated, accepting bifurcated,
Figure 1.1 Types of hydrogen bond arrays: Linear, Bent, Donating Bifurcated, Accepting Bifurcated, Trifurcated, and Three Center Bifurcated.
1.4.3
Strength of the Hydrogen Bond in Supramolecular Arrays.
There are different ways to modulate the strength of the hydrogen bond interactions in
a supramolecular array. The three main strategies are:
(i) the manipulation of some chemical properties of the hydrogen bond donor and
acceptor sites; i.e. the electron density of these sites46 and the polarization of the X-H bond;47
(ii) the addition of more intramolecular interactions to create a cooperative effect;48
and
(iii) the arrangement of the hydrogen bond donor and acceptor sites that participate in
1.4.3.1
Electron density of binding sites.
The first feature refers to the possibility of controlling the electron density in donor
and acceptor sites through substituent effects. In this sense, it is desired to have a low
electron density in hydrogen bond donor sites and a high electron density in hydrogen bond
acceptor sites in order to observe a strong hydrogen bond interaction. Therefore, it is
commonly observed in the literature that electron-withdrawing groups are bonded near
hydrogen bond donors and electron-donating groups are bonded near hydrogen bond
acceptors.
One example of this effect was reported by Wisner and coworkers through
DDD-AAA hydrogen bond arrays.50 In this work, the comparison of the association constants of
a set of different DDD units with an AAA unit proved that as more electron-withdrawing
groups were added to the DDD unit higher association constants were obtained (Figure 1.2,
Table 1.3). Likewise, the addition of electron-donating groups to the AAA unit showed
higher association constants than the addition of electron withdrawing groups when
complexed to the same DDD unit.
Table 1.3 Comparison of the effect of electron-withdrawing functional groups attached to
DDD units on the association constant (Ka) in CDCl3 at 298 K.
DDD X Y Ka with 7 [M-1]
6a H H 3.7x10³
6b Br H 7x10³
6c H CO2Et 1.1x10⁴
6d Br CO2Et 2.6x10⁴
6e H CN 2.9x10⁴
6f CN Br 4.9x10⁴
6g CO2Et CO2Et 5.4x10⁴
6h CN CN 1.1x10⁵
1.4.3.2
Number of hydrogen bond sites.
Cooperativity refers to two or more binding sites acting in a concerted fashion to
produce a combined interaction that is stronger than when the binding sites act
independently.23 In other words, the stability of a hydrogen bond array is proportional to the number of hydrogen bond interactions present. This effect is well documented in the
literature by Zimmerman and Murray, who reported the effect of extra donors and
acceptors on the stability of hydrogen bond complexes.51,52
As illustrated in Figure 1.3, the complex with the highest number of hydrogen bond
sites, DDD-AAA, has the highest association constant (Ka > 105 M-1),53 whereas the
complex with the lowest number of hydrogen bond sites, DD-AA, has the lowest
hydrogen bond donor site has a greater influence on the stability of the complex than the
addition of an extra hydrogen bond acceptor site. Hence, the DDD-AA complex has an
association constant of 3x10³ M-1 compared with the DD-AAA complex with an association constant of 848 M-1. It follows that, these last two complexes display higher association constants than the DD-AA complex.
Figure 1.3 The effect of the number of hydrogen bonding sites on the stability (Ka) of
1.4.3.3
Secondary Hydrogen Bond Interactions.
The last feature that contributes to the strength of the hydrogen bond array refers
to the distribution of the hydrogen bond sites between units. Supramolecular complexes
with the same number of donor and acceptor sites have different association constants
when the sequence of those binding sites is different.
Figure 1.4 Hydrogen Bond Arrays studied by Jörgensen and Pranata.55
Jörgensen and Pranata observed this peculiarity in some hydrogen bond complexes,55 (Figure 1.4). As can be noted, all complexes in Figure 1.4 comprise the same number of
donors and acceptors. However, the difference between the lowest association constant (Ka
= 90 M-1) and the highest one (Ka = 104 – 105 M-1) is significant.55 The authors explained
these differences due to the repulsive or attractive effect of the secondary hydrogen bond
interactions. The contribution of these interactions was estimated through different
computational methods.55,56
Secondary interactions occur among neighboring hydrogen bond donor/acceptor
sites (Figure 1.5). The proximity between them in the arrays (2 - 4 Å) is sufficient to exhibit
alternates donors and acceptors, ADA-DAD, is less favored since it displays four repulsive
secondary interactions. On the other hand, the most favored array is the one that comprises
all donors on one unit and all acceptors in the other one, DDD-AAA. After Jörgensen and
Pranata’s studies, Zimmerman and Murray supported this model by comparing a set of
arrays that represented all the possible combinations with three donors and three acceptors
(Figure 1.6).51
Figure 1.5 Secondary hydrogen bond interactions in triply hydrogen bonded arrays.
Figure 1.6 Triple hydrogen bond complexes studied by Zimmerman and Murray.
Moreover, the energetic contributions of the primary and secondary hydrogen bond
out by Sartorius and Schneider.57 Based on multiple linear regression analysis of association energies of 58 different complexes, Sartorius and Schneider calculated that the
average value of the free energy of a primary hydrogen bond interaction is 7.9 kJ mol-1 and for a secondary hydrogen bond interaction is 2.9 kJ mol-1 regardless of its character as an attractive or repulsive interaction.58
1.5
Supramolecular Complexes.
A supramolecular complex is an entity formed by the molecules that participate in
a molecular recognition event. It is characterized by its geometry, thermodynamic and
kinetic features.59 Since a supramolecular complex requires more than one molecule, each molecule that participates is known as a monomer or monomeric unit. The supramolecular
complex can also be defined as a collection of monomers or monomeric units arranged in
a specific orientation to each other by intermolecular interactions. The chemical
composition of each monomer in a supramolecular complex classifies it as complementary
or self-complementary.
Complementary hydrogen bond arrays consist of two or more different monomeric units which interact with each other to form a complex. Each monomeric unit incorporates
a mutually complementary arrangement of donors and acceptors in order to form the
hydrogen bonds. Natural examples of complementary arrays are nucleotide base pairs
(Figure 1.7). The complementary arrays illustrated in the preceding pages (Figure 1.2 to
Figure 1.7 Nucleotide base pairs in DNA.
Self-complementary arrays comprise only one type of monomeric unit. The monomeric
unit comprises hydrogen bond donors and acceptors disposed in such way that it can form
a complex with itself. These complexes are generally characterized by an inversion center.
One example of these arrays is provided by guanine tetramers discovered in eukaryotic
chromosomes by Sundquist and Klug (Figure 1.8A).60 Likewise, there are many reports
regarding the design and synthesis of self-complementary arrays, such as the molecular
duplex reported by Chu and coworkers, illustrated in Figure 1.8B.61
(A) (B)
1.6
Preorganization
Besides the strength of non-covalent interactions present in a supramolecular
complex, its stability can be affected by the monomer structure and the conformational
disposition of binding sites. These two features are part of the preorganization principle
described by Donald J. Cram.62,63
The preorganization principle implies that a monomer (M1) designed to have the
binding sites in a fixed way perfectly complementary to the other monomer’s binding sites
(M2), prior to their complexation, will bind more strongly than a monomer (M3) that needs
to undergo a conformational rearrangement (M3*) prior to the binding event (Scheme 1.2).5
Therefore, a key feature in the design of supramolecular complexes is the stability of the
monomers’ conformation to ensure a perfect fit with each other. Otherwise, there will be
an energetic cost due to the conformational re-arrangement needed to reach the proper
binding geometry.
Scheme 1.2 Preorganization Principle.
A good example of the importance of this principle was reported by Murray and
Zimmerman through the complementary supramolecular arrays 3∙2 and 9∙2 (Figure 1.9).64 The authors observed that the 3∙2 complex exhibited an association constant significantly
mechanics calculations of the possible conformations for 3 showed that structure 3’’, which
presents a steric repulsive interaction with the 4-amino group, is the favorable conformer.
Meanwhile, the same calculations showed that the structure where the alkoxy group is
optimally positioned to participate in a secondary hydrogen bond interaction, 3’, is less
stable by 4 kcal mol-1. This is, the geometrical prearrangement involved in order to engage monomers 3 and 2 into complexation has an energetic cost that is reflected in the 3∙2
complex Kass value. This observation was supported by theassociation constant of the 9∙2
complex. In this complex, monomer 9 was specifically designed and synthesized to have
an accessible oxygen acceptor atom to interact with the 4-amino group via a lactone
moiety; the result was a higher association constant compared with 3∙2 complex. This study
confirms that fixing a monomer into a geometrical structure that complements the other
monomer’s interacting sites disposition has a positive effect on the stability of the complex.
1.7
Tautomerization
As can be observed in the examples provided in previous sections, most of the
hydrogen bonded supramolecular complexes comprise heteroaromatic moieties. They
serve as good backbones since they have at least one heteroatom which is used as a
hydrogen bond acceptor site. Likewise, different chemical groups (donor and acceptor
sites) can be attached to them by known synthetic pathways. However, one of the
complications involved with the use of heteroaromatic compounds is their ability to convert
to different tautomeric forms due to a proton shift; which is known as prototropy.65
Depending on the monomer’s design, it is often possible to obtain more than one
tautomer (or protomer) able to participate in a hydrogen bond array. One popular example
of these systems are the ureidopyrimidones developed by Meijer and coworkers. They
noticed that the 6[1H]-pyrimidinone can tautomerize to 4[1H]-pyrimidinone or
pyrimidin-4-ol. The last two tautomers can dimerize due to their DDAA and DADA disposition,
respectively. Both arrays are preorganized by an intramolecular hydrogen bond (Scheme