Array-Fed Beam-Scanning Partially Reflective
Surface (PRS) Antenna
Luyang Ji*, Guang Fu, and Shu-Xi Gong
Abstract—A beam-scanning partially reflective surface (PRS) antenna is presented in this paper. By employing a reconfigurable feed network to a two-element phased array source, the PRS antenna can realize beam steering between−10◦ and 10◦ with respect to the broadside direction across an overlapped frequency range from 5.35 GHz to 5.76 GHz. Good agreement between the simulated and measured results is achieved, which validates its capability to be a good candidate for the modern communication systems.
1. INTRODUCTION
Highly directive PRS antennas have been widely investigated over the last two decades. They provide high directivity with planar configuration and simple feeding mechanism [1–5]. PRS antennas are a type of leaky-wave antennas which consist of a source antenna, usually a microstrip patch antenna, and a metallic or metallodielectric periodic array located approximately half a wavelength above a metallic ground plane.
It is known that a center-fed PRS antenna will generate a beam at boresight or a frequency-scanned conical beam [6, 7]. Recently, with the rapid development of wireless communication technologies, there has been strong interest in beam-scanning PRS antennas that can provide a fixed beam-scanning angle in a specified frequency range [8]. In order to obtain beam-scanning in a PRS antenna, tuning elements should be added into the radiating aperture. The current techniques for beam-scanning PRS antenna can generally be divided into two groups. The first one uses a tunable or varying metamaterial surface as the PRS. By employing tapered grids on the PRS structure, the antenna in [9] can realize a ±15 degree beam-scanning at 7.9 GHz. In [10], variable slotted structure is introduced on the PRS which leads to a 29 degree beam-scanning for the vertical polarization at 10.6 GHz. Another technique is to utilize a phased array as the feed to achieve beam-scanning [11]. By employing a Wilkinson power divider with phase shifters based on quadrature hybrids, the design in [11] can realize a 20◦ scanning range at 2 GHz by using a separate phase-shift network and a separate impedance matching network.
In this paper, we propose an array-fed beam-scanning PRS antenna with an integrated reconfigurable feed network. A Wilkinson power divider with reconfigurable defected microstrip structure (RDMS) in [12] is used as the feed network for the PRS antenna to realize beam-scanning. The proposed antenna can reconfigure its beam between−10◦ and 10◦ in an overlapped frequency range from 5.35 to 5.76 GHz (7.4% impedance bandwidth). A brief introduction of the antenna structure, the operating principle of the reconfigurable feed network, and its relevant results are given in the following sections.
Received 18 October 2015, Accepted 29 December 2015, Scheduled 15 January 2016
* Corresponding author: Luyang Ji ([email protected]).
2. ANTENNA DESIGN
2.1. PRS Antenna Configuration
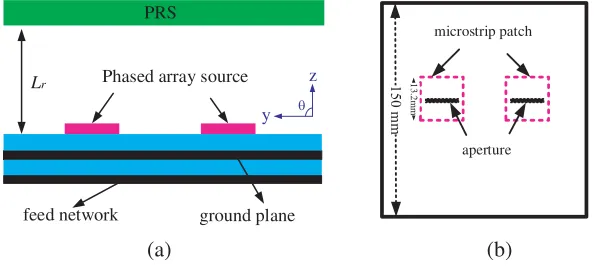
The schematic model of the proposed PRS antenna is shown in Fig. 1. It is composed of a two-element patch array as the source antenna which is located between a metallic ground plane and a PRS structure made by a 6.5 mm-thick FR4 substrate. The electromagnetic waves radiating from the source experience multiple reflections and transmissions within the cavity [11]. The distance between the PRS and the ground plane Lr is typically chosen. When it satisfies Equation (1), the waves transmit through the PRS interfere constructively in the broadside direction at the designed frequency.
Lr=
ϕ
π −1
λ0 4 +N
λ0
2 N = 0,±1,±2, . . . , (1) where λ0 is the free-space wavelength and ϕ the phase of the reflection coefficient of the PRS. Furthermore, the boresight directivity relative to the source antenna can be calculated as a function of the PRS reflection coefficient magnitudeR
Demax= 1−R
1 +R (2)
The dimensions of the antenna are 150 mm×150 mm. The phased array source is a two-layer structure. For the first layer, two square patches, each with a size of 13.2 mm, are placed at one side of a 1.524 mm-thick Rogers4003 substrate and aligned symmetrically along the y-direction. The spacing between them is 43 mm, to achieve a compromise between the array coupling and the grating lobes. On the other side of the Rogers4003 substrate, two slots with a dimension of 7 mm×1.5 mm are etched on the ground at the position underneath the patch center for an aperture coupling. For the second layer, a reconfigurable feed network is printed on one side of another 1.524 mm-thick Rogers4003 substrate and the metal of the other side of this substrate is etched off. According to the Equation (1), Lr is chosen to be 27 mm.
Phased array source
feed network ground plane
Lr PRS y z θ 13 .2 m m (a) (b) microstrip patch aperture
Figure 1. Schematic model of (a) PRS antenna, (b) array source.
2.2. Reconfigurable Feed Network Configuration
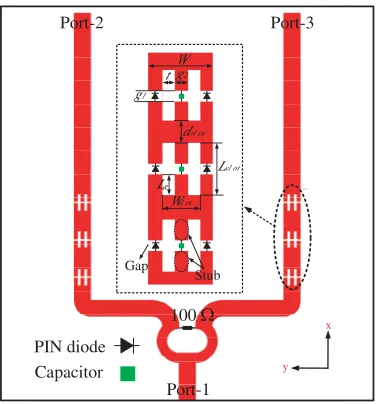
To realize beam-scanning for the PRS antenna, a reconfigurable feed network is designed for the source antenna. To obtain phase shifts between the two array elements, reconfigurable defected microstrip structure (RDMS) based phase shifters [12] are incorporated in the feed network, as shown in Fig. 2. The feed network stems from the conventional Wilkinson power divider with two groups of phase shifters etched on each branch. Each phase shifter consists of 3 RDMS units with the same size. Each unit consists of a rectangular slot with a size of Lslot×Wslot; two gaps etched on the edges for inserting
PIN diode
t
Wsl ot dsl ot g2 Wf
g1
Lsl ot
Stub Gap
Port-1
Port-2 Port-3
Lg
x
y
Capacitor
100Ω
Figure 2. Structure of the reconfigurable feed network.
Table 1. Dimensions of the RDMS unit.
Parameter Wf Lslot Wslot Lg
Value (mm) 3.4 3.5 2.0 1.55 Parameter dslot g1 g2 t Value (mm) 4.2 0.4 0.7 0.65
The phase shift is achieved by controlling the states of the PIN diodes of the RDMS unit to obtain different current paths. By turning the diodes on or off, the RDMS unit can work in two different states. When the diodes are on, both the diodes and capacitors allow the currents to go through them with minor losses. When the diodes are off, the current across the diodes are blocked. As a consequence, the currents concentrate on the stubs. The current path for the off-state of the PIN diodes is longer than that of the on-state. For this design, the off-state generates a 30◦ phase delay with respect to the on-state for a single unit. By cascading three RDMS units, a 90◦ phase shift can be obtained. If the PIN diodes on both branches of the power divider are “all-on”, no phase shift is acquired and this state is referred to “State 1” in this work. When the diodes on the left branch are switched on and those of the right branch are switched off, the right one can achieve a 90◦ phase delay with respect to the left one. This state is named “State 2” and it results in a tilted beam towards the right side (−y direction). On the other hand, the diodes on the network with a state of left off-state right on-state (named as “State 3”), the beam can be titled towards the left side (+y direction).
Figure 3. Simulated reflection coefficient of the feed network.
Figure 4. Simulated insertion loss of the feed network.
2.3. Parameter Study of the RDMS Unit
A parameter study of the RDMS size is conducted on the structure of the RDMS group as shown in the inset of Fig. 2 to illustrate its effects on the performance of the phase shift. In this design,g1 and
g2 are decided by the sizes of the PIN diode and the capacitor while Lg and t are related to g1 and
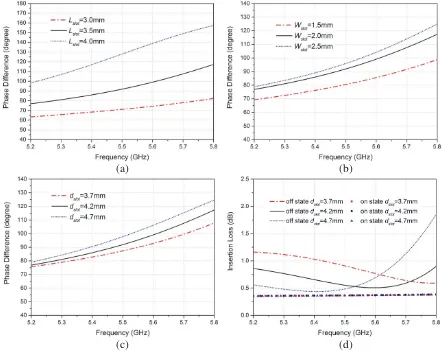
g2 as Lg = (Lslot−g1)/2 and t = (Wslot−g1)/2. Therefore, when g1 and g2 are known, the effects of Lg and t are the same as those of Lslot and Wslot. From Fig. 5(a), it can be seen that Lslot has a
significant influence on the variation of the phase shift with frequency. AsLslotincreases, the variation of the phase difference between the two outputs is increasing dramaticlly. WhenLslot equals to 3.0 mm, the phase shift variation range is from 60◦to 80◦. While whenLslotincreases to 4.0 mm, the phase shift variation range is from 100◦ to 155◦. Here, a stable phase shift variation with frequency is demanded to achieve a wideband beam-scanning. However, for the case ofLslot= 3.0 mm, the value of the phase shift is not enough to realize a wide beam-scanning angle, so as a compromise, we chose Lslot = 3.5 mm as
the optimal value for the length of the RDMS unit. Fig. 5(b) shows the influence ofWsloton the phase
shift values. When Wslot increases from 1.5 mm to 2.0 mm, the phase shift range changes from 74◦–96◦
to 83◦–113◦ across the range of 5.35–5.76 GHz. Figs. 5(c) and (d) give the phase shift and insertion loss with different values of dslot. It can be seen that dslot only affects the phase shift in the higher
frequency band. However, the insertion loss varies dramatically withdslot. Therefore, dslot= 4.2 mm is
chosen in compromise of the phase shift and the insertion loss. By appropriately choosing the values of these three parameters, a reasonable large and stable phase shift value between the two outputs can be obtained.
3. SIMULATION AND EXPERIMENTAL RESULTS
3.1. Input Reflection Coefficients
A prototype has been designed, fabricated, and measured. Simulated and measured results are shown in Fig. 6. It can be seen that the overlapped impedance bandwidth for the three states ranges from 5.35 GHz to 5.76 GHz and the measured results agree well with the simulated ones.
3.2. Far-Field Radiation Patterns
The radiation patterns and the realized gains of the proposed antenna were measured in a spherical near-field (SNF) antenna measurement system. Simulated and measured radiation patterns in the y-z
(a) (b)
(c) (d)
Figure 5. The effect of the RDMS size (a) effect ofLsloton the phase shift, (b) effect of Wslot on the
phase shift, and (c) effect of dsloton the phase shift, (d) effect of dslot on the insertion loss.
(a) (b)
(a) (b)
Figure 7. Radiation patterns of the proposed antenna at 5.3 GHz, (a) State 1, (b) State 2 and 3.
(a) (b)
Figure 8. Radiation patterns of the proposed antenna at 5.5 GHz, (a) State 1, (b) State 2 and 3.
(a) (b)
and the fabrication inaccuracies. It is observed that a broadside radiation is obtained at State 1. For State 2 and State 3, the main beam directions are scanned to−10◦ and 10◦, respectively.
4. CONCLUSION
A novel beam-scanning PRS antenna has been presented in this paper. By introducing a reconfigurable feed network into the proposed antenna, a beam-scanning range between ±10◦ can be achieved in a relatively wide bandwidth without the assistance of impedance matching network. The proposed antenna can serve as a promising candidate in the application where moderate scanning range is needed in a wide frequency band.
REFERENCES
1. Von Trentini, G., “Partially reflecting sheet arrays,”IRE Trans. on Antenna Propag., Vol. 4, No. 4, 666–671, Oct. 1956.
2. Feresidis, A. P. and J. C. Vardaxoglou, “High gain planar antenna using optimised partially reflective surfaces,”IEE Proc. — Microw. Antenns Propag., Vol. 148, No. 6, 345–350, Dec. 2001. 3. Guerin, N., S. Enoch, G. Tayeb, P. Sabouroux, P. Vincent, and H. Legay, “A metallic Fabry-Perot
directive antenna,”IEEE Trans. Antennas Propag., Vol. 53, No. 1, 209–215, Jan. 2006.
4. Wang, S., A. P. Feresidis, and J. C. Vardaxoglou, “High-gain subwavelength resonant cavity antenna based on metamaterial ground plane,” Inst. Elect. Eng. Proc. Microw. Antenna Propag., Vol. 153, No. 1, 1–6, Feb. 2006.
5. Weily, A. R., T. S. Bird, and Y. J. Guo, “A reconfigurable high-gain partially reflecting surface antenna,” IEEE Trans. Antennas Propag., Vol. 56, No. 11, 3382–3390, Nov. 2008.
6. Guzman-Quiros, R., J. L. Gomez-Tornero, A. R. Weily, and Y. J. Guo, “Electronically steerable 1-D Fabry-Perot leaky-wave antenna employing a tuneable high impedance surface,”IEEE Trans. Antennas Propag., Vol. 60, No. 11, 5046–5055, Nov. 2012.
7. Guzman-Quiros, R., J. L. Gomez-Tornero, A. R. Weily, and Y. J. Guo, “Electronic full-space scanning with 1-D Fabry-Perot LWA using electromagnetic band gap,” IEEE Antennas Wireless Propag. Lett., Vol. 11, 1426–1429, 2012.
8. Guzman-Quir´os, R., J. L. G´omez-Tornero, A. R. Weily, and Y. J. Guo, “Electronically steerable 1-D Fabry-Perot leaky-wave antenna employing a tunable high impedance surface,” IEEE Trans. Antennas Propag., Vol. 60, No. 11, 5046–5055, Nov. 2011.
9. Ourir, A., S. N. Burokur, and A. de Lustrac, “Electronic beam steering of an active metamaterial-based directive subwavelength cavity,” 2nd European Conference on Antennas and Propagation, Edinburgh, Nov. 2007.
10. Moghadas, H., M. Daneshmand, and P. Mousavi, “Single-layer partially reflective surface for an orthogonally-polarised dual-band high-gain resonant cavity antenna,” IET Microwaves, Antennas
& Propagation, Vol. 7, No. 8, 656–662, Jun. 2013.
11. Debogovic, T. and J. Perruisseau-Carrier, “Array-fed partially reflective surface antenna with independent scanning and beamwidth dynamic control,”IEEE Trans. Antennas Propag., Vol. 62, No. 1, 446–449, Jan. 2014.