PIYAWIT, WARAPORN. Effect of Processing Scheme on Precipitation Mechanisms and Evolution of Microstructures and Properties of CuAgZr alloy. (Under the direction of Dr. Yuntian T. Zhu and Dr. James M. Rigsbee.)
CuAgZr alloy is a variant of the CuAg alloy that is developed for high strength
and high conductivity applications. With Zr addition, the discontinuous precipitation at
the grain boundaries is decreased due to slower Ag diffusion rate. Mechanical and
electrical properties of copper alloys can be influenced by many factors including
alloying elements, mechanical processing, heat treatment and their microstructures.
For high strength and high conductivity applications, Cu‐Ag alloys are one of the good
candidate materials for these used because of their excellent combinations of high
strength and high electrical conductivity. The primary strengthening mechanism is
precipitation hardening due to the formation of Ag precipitates during the heat
treatment process.
Its strengthening is accomplished mainly by the precipitation of Ag precipitates,
which tend to align on the {111} planes in the Cu matrix. The evolutions of hardness
and electrical conductivity of the aged samples showed that the Ag particles
precipitated out from the Cu matrix in the early stage of aging. The hardness of the aged
samples is significantly increased from 95 HV0.1 to the maximum at 193 HV0.1 after 2
hours of aging. The density of Ag precipitates is increased with increased aging time.
Ag precipitation occurs in particular Cu matrix planes due to the minimization of
elastic energy. The Ag precipitates were formed by clustering of Ag atoms while
ledge movement and growth were compensated with the existence of interfacial misfit
dislocations. During diffusional growth, misfit dislocation arrays along the
precipitate/matrix interface accommodated the lattice mismatch. Therefore, precipitate
growth involves the formation and migration of ledges. Precipitate growth by ledge
motion was necessary due to partial coherency of the interfaces.
Effects of plastic deformation on mechanical property and electrical conductivity
of CuAgZr alloy are presented. The main strengthening effects in plastically deformed
CuAgZr are contributed by precipitation mechanism combined with work hardening.
Electrical conductivity is strongly affected by precipitation reactions during high
temperature annealing. Therefore, the properties of hot rolled CuAgZr exhibit good
combination of strength and electrical conductivity. A combination of severe plastic
deformation by high pressure torsion (HPT) followed by long term annealing at low
temperature allows CuAgZr to obtain a high hardness (more than 300 HV0.1) that is
comparable to as‐processed HPT CuAgZr. The microstructure of annealed HPT samples
© Copyright 2014 by Waraporn Piyawit
by
Waraporn Piyawit
A dissertation submitted to the Graduate Faculty of North Carolina State University
in partial fulfillment of the requirements for the degree of
Doctor of Philosophy
Materials Science and Engineering
Raleigh, North Carolina
2014
APPROVED BY:
_______________________________ ______________________________
Dr. Yuntian T. Zhu Dr. James M. Rigsbee
Chair of Advisory committee Co‐Chair of Advisory Committee
________________________________ ________________________________
DEDICATION
BIOGRAPHY
Waraporn (Orm) Piyawit was born and raised in Nakhon Ratchasima, Thailand.
Orm earned BS (Materials Science – Gemological Technology) from Burapha University,
Chonburi, Thailand, in 2002. After that, she moved to the north region of Thailand and
completed her M.S. (Materials Science) from Chiangmai University in 2005. In the
following step of her career, she worked at Fabrinet Co., Ltd. as a Failure Analysis
engineer. After two years of working, she got the full scholarship from the Royal Thai
Government to pursue her Ph.D. in Materials Science at North Carolina State University
since 2008 under the direction of Dr. Yuntian T. Zhu and Dr. James M. Rigsbee. Upon the
completion of Ph.D. degree, she has accepted a faculty position at Suranaree University
ACKNOWLEDGEMENTS
I would like to express my gratefulness to many people for their support and
contribution. Without their assistance, the completion of this thesis would not be
possible.
Firstly, I would like to acknowledge the Royal Thai Government Scholarship for
the full sponsorship of my Ph.D. study at NC State University. Gratefulness would also
go to the staff of Office of Educational Affairs, Royal Thai Embassy, Washington D.C., for
the administrative support.
I would like to show my deeply gratefulness to my advisor, Dr. Yuntian Zhu.
Thank you for your continuous support and guidance, for giving me great help and
direction, for helping me learn independently and bringing out my self‐confidence. I
have earned so much during my Ph.D. journey. I will carry on your motto; Integrity,
Motivation, Challenge, Innovation and Perseverance.
I would like to express my appreciation to my co‐advisor, Dr. Mike Rigsbee.
Without your care, tremendous support, patience, encouragement, the completion of
this thesis would not be possible. I would also like to extend my special thanks to my
committee members, Dr. Carl Koch and Dr. Ronald O. Scattergood. Your time and
suggestion in guiding me is invaluable.
My sincere gratitude also goes to Dr. Suveen N. Mathaudhu. Thank you for your
technical direction when needed, thank you for your advice on our co‐authoring paper.
Thank you for being my editor and my proof‐reader. I truly appreciate it.
The appreciation would also go to Dr. Sarma Subramanya, Associate Professor at
Department of Metallurgical and Materials Engineering, India Institute of Technology
Madras, India, who initiated this project and gave the advice at the beginning of this
study. Thanks to Dr. Jens Freudenberger, IFW Dresden, Germany, for the CuAgZr alloy
used in this research. Your kind support is sincerely appreciated.
Thanks to all student fellows and research scholars in our group, Weizong Xu for
your extensive help on TEM/HRTEM works, Weiwei Jian, Xin Wang, Jordan Moore,
Xiaolong Ma, Fan Wu, Hao Yuan, Zhou Hao, Yuchuan Yaun, Jingmei Tao, Wei Luo,
Guangming Cheng, Dr. Ming‐Hung Tsai, Professor Liuzhang Ouyang. Thanks also go to
Alderson Neira, for the suggestions on electrical conductivity measurements
experiment set up. Special thanks go to Jordan and his awesome poster design for TMS
meeting 2014 and also to Dr. Tsai for his great support and advice. I am truly grateful.
Thank you all for friendship and support.
I wish to express my thanks to the staff at Analytical Instrument Facilities, Dale
Batchelor, Roberto Garcia, Chuck Mooney and Fred Stevie. Also thanks to Tom
Rawdanowicz and Andy Newell for TEM related works. Thanks also go to Lew Reynolds
for electrical conductivity measurements set up and Professor Jag Kasichainula for
extensive discussions. I would like to extend my sincerest thanks to Edna Deas for her
Also deserving thanks are my friends. Thank you for being there for me during
the difficulty times, the busy times or even the crazy times. Thank you for all the likes
and messages on my Facebook! I would like to thank Nong Parn for being my
supportive sister and best friend. Thank you to Nong Pam, P Top and P Tao who helped
me settled down when I first got here in Raleigh. Thanks to Kaew, P Jijy, Ong and Pat for
being great friends throughout these years. Thank you to my roomies, Jamie and Arthur,
for sharing the laughs and joy. Thanks to Ajarn Tum for being my half‐marathon buddy.
Thank you to P Rach, Poy, Pingpong, Nong Baitoey, Ray, Nong Fah, P Nat, May, P A, Kan
and all Thai friends for the all good memorable friendship. I would also like to express
my thankful to all other supportive people whom I have not individually brought up
here.
Last but not least, I would like to specifically show my gratefulness to my mom,
Narumon Piyawit, dad, Khunchuay Piyawit and my younger sister, Tuangporn Piyawit.
Thank you for your endlessly unconditional love and support. Thank you for your
numerous phone calls, Skype and Line! Thank you for all the care packages sent from
TABLE OF CONTENTS
LIST OF TABLES ... ix
LIST OF FIGURES ... x
1 INTRODUCTION AND OVERVIEW... 1
1.1Research Motivation and Objective ... 1
1.2Dissertation Structures ... 2
1.3Copper and Copper Alloys ... 3
1.4Strengthening Mechanisms of Heat Treatable Copper Alloys ... 7
1.4.1Solid Solution Strengthening ... 8
1.4.2Strain Hardening ... 13
1.4.3Grain Boundary Hardening ... 16
1.4.4Precipitation Hardening ... 17
1.5Spinodal Decomposition ... 26
1.6High Strength, High Conductivity Cu‐Ag Alloys ... 30
1.6.1Precipitation Behaviors in Cu‐Ag Alloys ... 31
1.6.2Modulated Structure of Precipitates ... 34
1.6.3Microstructure‐Properties Relationships ... 36
1.7References ... 39
2EXPERIMENTAL PROCEDURES ... 43
2.1Heat Treatment ... 44
2.2Plastic Deformation Process ... 45
2.2.1Rolling ... 45
2.2.2High Pressure Torsion ... 46
2.3Materials Characterizations ... 47
2.3.1Differential Scanning Calorimeter (DSC) ... 47
2.3.2X‐Ray Diffraction (XRD) ... 50
2.3.3Hardness Measurements ... 56
2.3.4Electrical Conductivity Measurements ... 57
2.3.5Scanning Electron Microscope ... 60
2.3.6Transmission Electron Microscopy ... 63
2.4References ... 67
3EFFECT OF AGING TREATMENTS ON CuAgZr ALLOY ... 69
3.1Introduction ... 69
3.2Experimental Procedures ... 69
3.3Results and Discussion ... 71
3.3.1Differential Scanning Calorimeter (DSC) ... 71
3.3.2X‐ray diffraction (XRD) analysis ... 73
3.3.3Hardness and electrical conductivity ... 78
3.3.4Microstructural observations ... 82
3.4Conclusion ... 89
3.5References ... 90
4 FORMATION MECHAMISM OF Ag PRECIPITATES ... 92
4.1 Introduction ... 92
4.2 Experimental Procedures ... 92
4.3 Results and Discussion ... 93
4.4 Conclusion ... 104
4.5 References ... 105
5 STRENGTH AND CONDUCTIVITY ENHANCEMENT BY COMBINATION OF DEFORMATION AND AGING TREATMENT ... 107
5.1 Introduction ... 107
5.2 Experimental Procedures ... 108
5.3 Results and Discussion ... 108
5.3.1 Rolling ... 108
5.3.2 High Pressure Torsion ... 117
5.4 Conclusion ... 122
5.5 References ... 123
6 CONCLUSION AND FUTURE WORK ... 125
6.1 Conclusions ... 125
6.2 Future Work ... 127
LIST OF TABLES
Table 1.1 Characteristic properties, mechanical properties, electrical and
thermal properties of electrolytic tough pitch copper (Cu‐ETP) ... 5
Table 1.2 Approximate atomic radii difference between copper and solute alloying atoms, and approximate solubility of several alloying
elements in copper ... 12
Table 1.3 Relationship of surface energy and different types of interfaces ... 21
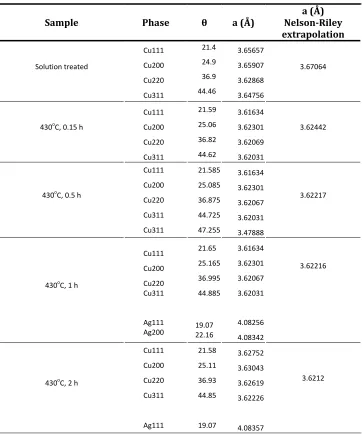
Table 3.1 X‐ray reflections, lattice parameter calculated from Bragg equation and extrapolated lattice parameter from Nelson‐Riley
extrapolation function ... 75
Table 3.2 Vickers microhardness and electrical conductivity of
Cu‐7wt%Ag‐0.05wt%Zr ... 79
Table 3.3 EDS profile chemical composition analysis of CuAgZr aged at
430oC for 10 hours ... 83
Table 5.1 Vickers microhardness (HV0.1) and electrical conductivity (%IACS) of CuAgZr alloy processed by different rolling temperatures and
reduction thickness ... 110
Table 5.2 Vickers microhardness and electrical conductivity of
CuAgZr alloy ... 114
Table 5.3 Indexing of the diffraction rings shown in Figure 5.7 (b) and
LIST OF FIGURES
Figure 1.1 Properties of the major commercial high strength and high electrical conductivity copper alloys compared to
Cu‐7wt%Ag‐0.05wt%Zr alloy ... 6
Figure 1.2 The copper‐silver binary alloy phase diagram ... 7
Figure 1.3 Solid solutions: (a) substitutional solid solution(b) interstitial
solid solution ... 9
Figure 1.4 Effects of alloying elements on yield strength of copper ... 13
Figure 1.5 The influence of cold work on 1040 steel, brass and copper, (a)
the increase in tensile strength, and (b) the decrease in ductility ... 14
Figure 1.6 Illustration of the motion of a dislocation as it encounters the grain boundary. Slip planes are discontinuous and change directions
across the grain boundary ... 17
Figure 1.7 Schematic of a dislocation (a) curling round the stress fields from precipitates and (b) passing between widely spaced
precipitates ... 19
Figure 1.8 Classification of grain boundary discontinuous reactions ... 23
Figure 1.9 The variation of growth rate with particle radius for diffusion
controlled growth ... 25
Figure 1.10 Schematic plots of electrical conductivity as a function of tensile strength for (a) annealed and (b) 60% reduction thickness
copper alloy strip ... 26
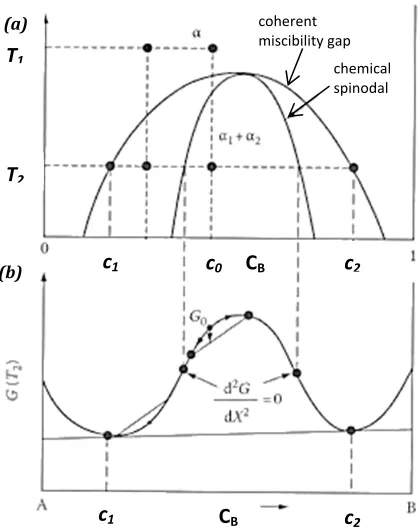
Figure 1.11 Phase diagram with Spinodal decomposition
(a) Variation of chemical spinodal and coherent miscibility gap
with composition. (b) Free energy changes during decomposition ... 27
Figure 1.12 Schematic composition fluctuation profiles in a spinodal system ... 29
Figure 1.14 TEM micrograph of Cu‐5wt%Ag‐2wt%Al aged at 450oC for 2 h... 34
Figure 1.15 TEM micrograph of disk‐shaped and rod‐shaped Ag precipitates and Ag‐depleted Cu matrix in Cu‐5.7wt%Al alloy single crystal
aged at 450oC for 2 h ... 35
Figure 1.16 Cu‐7wt%Ag‐0.05wt%Zr (a) TEM micrographs of alloy after cold drawing up to η = 4.3 (b) strain to failure as a function of
the drawing strain ... 38
Figure 1.17 Cold drawn Cu‐Ag alloys with different Ag content
ultimate tensile strength (b) electrical conductivity ... 38
Figure 2.1 Tube furnace and gas control panel ... 44
Figure 2.2 Hot rolling (a) experiment setup (b) rollers ... 45
Figure 2.3 High pressure torsion machine (a) machine setup
(b) constrained dies ... 47
Figure 2.4 Block diagram of heat flux or power compensation differential
scanning calorimeter ... 49
Figure 2.5 Power compensating differential scanning calorimeter
Diamond DSC Perkin‐Elmer ... 50
Figure 2.6 Schematic of Bragg’s law reflections ... 52
Figure 2.7 Schematic of geometrical arrangement of the X‐ray diffractometer θ‐2θ geometry (b) θ‐θ geometry ... 53
Figure 2.8 Rigaku Smartlab X‐ray diffractometer ... 55
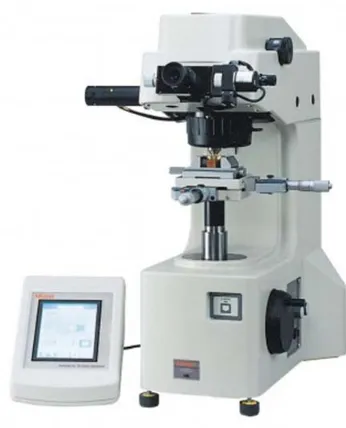
Figure 2.9 Vickers microhardness testing machine ... 57
Figure 2.10 Diagram of four‐point probe setup in contact
with a conductive plate, thickness T ... 59
Figure 2.11 Apparatus set up for Four‐point probe testing (a) Signatone four‐point probe testing machine, power supply and nanovoltmeter ... 60
Figure 2.13 Schematic drawing of scanning electron microscope ... 62
Figure 2.14 Scanning electron microscope Hitachi S‐3200N ... 63
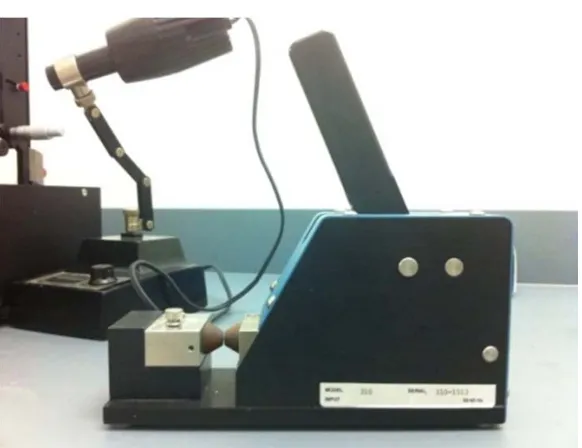
Figure 2.16 South Bay 3mm disk puncher Model 310 ... 65
Figure 2.17 TEM samples preparation (a) Multiprep grinding machine
(b) Gatan ion milling machine ... 66
Figure 3.1 DSC heating and cooling curves of solution treated
Cu‐7wt%Ag‐0.05wt%Zr ... 72
Figure 3.2 Cu‐Ag‐Zr ternary phase diagram calculated at 500oC... 72
Figure 3.3 X‐ray diffraction profiles of solution treated
and aged samples of Cu‐7wt%Ag‐0.05wt%Zr ... 74
Figure 3.4 Cu lattice parameters by Nelson‐Riley extrapolation of aged sample at 430oC for 1 hour plotted against ... 76
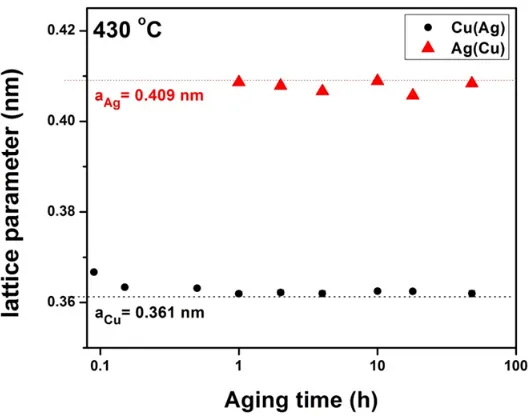
Figure 3.5 Lattice parameters of solution treated and aged samples calculated from XRD profiles and extrapolated by Nelson‐Riley extrapolation
as a function of aging time ... 77
Figure 3.6 Vickers microhardness and electrical conductivity measurements
of CuAgZr aged at 430oC with various times (a) HV0.1 (b) %IACS ... 79
Figure 3.7 Optical micrographs of (a) solution treated sample at 850oC for 5 h and aged samples at 430oC with various times
(b) 2 h (c) 4 h (d) 10 h (e) 48 h ... 84
Figure 3.8 SEM micrographs of CuAgZr aged at 430oC for 10 hours
(a) Secondary electron image (SEI) (b) EDS profile analysis at grain boundary (c) EDS profile analysis in Cu matrix grain interior ... 85
Figure 3.9 Tracer diffusion coefficients of silver in Cu and Cu alloys
as a function of reciprocal absolute temperature ... 86
Figure 3.10 In‐situ TEM observation on [100] zone axis, the micrographs were “snap‐shot” from video records (a) at room temperature
Figure 4.1 TEM micrographs of CuAgZr after aging at 430oC for (a) 1 h (b) 18 h 95
Figure 4.2 The Cu‐Ag‐Zr alloy aged at 430 oC for 30 minutes ... 96
Figure 4.3 Cu‐7wt%Ag‐0.05wt%Zr alloy aged at 430 oC for 2 h ... 98
Figure 4.4 HRTEM image of Ag precipitates in a sample aged at 430 oC
for 2 hours. inset: an enlarged HRTEM image from Ag‐precipitate ... 102
Figure 4.5 Cu‐7wt%Ag‐0.05wt%Zr aged at 430 oC for 2 hours ... 103
Figure 5.1 Vickers microhardness of rolled CuAgZr alloy with different rolling
temperatures plotted against sample reduction thickness ... 109
Figure 5.2 Vickers microhardness measurement and electrical conductivity of rolled CuAgZr alloy as a function of rolling percent
(a) Cold rolling (b) Hot rolling ... 111
Figure 5.3 Hardness of heat treated Cu‐7wt%Ag‐0.05wt%Zr and heat treated samples Subsequently subjected to 90% cold rolling
as a function of aging times ... 112
Figure 5.4 TEM micrographs showing microsctructure
of the 90% hot rolled CuAgZr alloy ... 116
Figure 5.5 TEM micrographs showing microsctructure of aged CuAgZr alloy
sample at 430oC, 18h subjected to 90% cold rolling deformation ... 116
Figure 5.6 Hardness of CuAgZr alloy processed by HPT, 6 GPa in dependence
on the equivalent deformation strain ... 118
Figure 5.7 TEM micrographs showing the microstructure of
a 6 GPa HPT (n=5) deformed CuAgZr alloy (a) Bright field image
(b) TEM diffraction pattern ... 119
Figure 5.8 TEM micrographs showing the microstructure of a 6 GPa HPT
1
Introduction
and
Overview
1.1 Research Motivation and Objective
It is well known that copper and its alloys are the most commonly used metal
material for electronic applications. Mechanical and electrical properties of copper
alloys can be influenced by many factors including alloying elements, mechanical
processing, heat treatment and their microstructures [1]. For high strength and high
conductivity applications, Cu‐Ag alloys are one of the good candidate materials because
of their excellent combinations of high strength and high electrical conductivity. The
primary strengthening mechanism is precipitation hardening due to the formation of Ag
precipitates during the heat treatment process. Cu‐7wt%Ag‐0.05wt%Zr is a minor
alteration of the Cu‐Ag system. A previous study showed that the addition of Zr to the
CuAg alloy suppresses the formation of discontinuous precipitations at grain
boundaries, which is less effective for strengthening than precipitation in the matrix [2].
Moreover, Zr enhances the recrystallization by forming ternary phase Cu4AgZr acting as
heterogeneous nucleation sites during dynamic recrystallization and thereby causes
smaller grain sizes after dynamic recrystallization, which hinders grain growth at
elevated temperature [3].
The objective of this study is to gain a better of the formation and growth
mechanism of Ag precipitates in this particular system. This will establish the basic
understanding of the mechanism of precipitate formations and arrangements in other
1.2 Dissertation Structures
This dissertation is consisted of six chapters.
Chapter 1 provides the research objectives, background knowledge and
literature reviews that related to CuAg alloy system.
Chapter 2 describes the experimental procedures, instruments and analytical
techniques used in this study.
Chapter 3 explains the phases, microstructures and properties evolutions of
CuAgZr alloy during aging treatments.
Chapter 4 discussed the formation mechanism of modulated Ag precipitate
structures.
Chapter 5 details the structures and properties of CuAgZr after cold work.
Chapter 6 concludes the contributions of this study and presents the proposed
future works.
In this chapter, the fundamental background of mechanical and electrical
properties of copper and its alloy will be introduced. The strengthening mechanisms of
heat treatable copper alloys, the spinodal decomposition process and precipitation
mechanisms will be discussed. Finally, literature reviews on microstructure‐properties
relationship of copper‐silver alloys, precipitation behavior of Cu‐Ag‐Zr alloys and the
1.3 Copper and Copper Alloys
Copper and copper alloys are widely used in many different areas of industries
because of their outstanding properties, i.e. excellent electrical and thermal
conductivity, outstanding corrosion resistance, good strength and fatigue resistance.
Furthermore, they also have excellent formability [4,5]. Therefore, they can be easily
fabricated into many varieties of shapes and are suitable for various types of
application. They are extensively used for electronic wires, power cables, electrical
contacts, telecommunication wires and cables, magnetic winding materials, automobile
wires, and cables, automobile radiators, heat exchangers, combustion chambers of
liquid rocket engine, contact plates for high speed electrified trains, panels for solar
energy system, pipes, valves and fittings, electrical contacts, contact springs, printed
circuit boards, semiconductors, high vacuum and other electronic devices, etc. [4,6,7].
The properties of copper alloys can be altered and controlled by adding or modifying
the pure copper with alloying elements. Commonly used alloying elements are
aluminium, nickel, silicon, tin and zinc, however, there are other elements and metals
for modifying copper alloys to enhance certain materials characteristics, for example:
electrical conductivity, corrosion resistance or creep and fatigue resistance. The
characteristic properties and mechanical properties of copper are listed in Table 1.1.
For electrical conductivity characteristics, various copper alloy systems have
been developed such as Copper‐chrome alloys, Cu‐Ni‐Si, Cu‐Fe, Cu‐Be and Cu‐(Fe, Ni,
these high strength and high conductivity alloys have low fracture toughness which
limits the processing techniques that can be used with these alloys. The relationships
between hardness and electrical conductivity of high strength, high electrical
conductivity commercial copper alloys are shown in Figure 1.1. The alloys shown here
can be heat treated and they are all aged hardenable alloy. After aging, precipitates
dispersion is one of the key factors to improve the mechanical strength of the materials.
The precipitation strengthening mechanism not only enhances the strength of the alloys
but also improves the electrical, thermal conductivity properties simultaneously. For
high strength and high conductivity purposes, copper‐silver alloys have been developed
over past few decades. Copper‐silver alloys and their minor modifications containing
other alloying elements also can be aged hardenable. These copper‐silver alloy systems
have good ductility, excellent machinability, good weldability combined with high
strength and high electrical conductivity.
The phase diagram of the copper‐silver system is a binary eutectic phase
diagram, as shown in Figure 1.2. On the diagram, three single phase regions can be
found: α phase, β phase and liquid phase (L). The solid solution of α phase is the copper
rich phase and, within this region, silver in this α phase is the solute component. It has
an FCC crystal structure. The β phase solid solution also has a FCC structure with
copper solute atoms. The α and β phases can also be determined as pure copper and
phases is limited, and close to zero at room temperature. The maximum solubility limit
of Ag solute in Cu matrix is 8.0 wt% Ag at 779oC.
Table 1.1 Characteristic properties, mechanical properties, electrical and thermal properties of electrolytic tough pitch copper (Cu‐ETP) [1, 3]
Property Copper(Cu‐ETP) Units
Electrical conductivity (annealed) 101 %IACS
Electrical resistivity (anneal) 1.72 μΩ cm
Thermal conductivity at 20oC 397 W/mK
Coefficient of expansion 17 x 10‐6 /oC
Tensile strength (annealed) 200‐250 N/mm2
Tensile strength (half‐hard) 260‐300 N/mm2
0.2 proof strength (annealed) 50‐55 N/mm2
0.2 proof strength (half‐hard) 170‐200 N/mm2
Elastic modulus 116‐130 N/mm2
Fatigue strength (annealed) 62 N/mm2
Fatigue strength (half‐hard) 117 N/mm2
Specific heat capacity 385 J/kgK
Density 8.91 g/cm3
Melting point 1083 oC
Figure1.1 Properties of the major commercial high strength and high electrical conductivity copper alloys compared to Cu‐7wt%Ag‐0.05wt%Zr alloy. High strength
and high conductivity copper alloys can be categorized into four different types: Cu‐Cr, Cu‐Ni‐Si, Cu‐Fe and Cu‐(Fe, Ni, Co)‐P (Modified from [8])
Figure1.2 The copper‐silver binary alloy phase diagram [6]
1.4 Strengthening Mechanisms of Heat Treatable Copper Alloys
The ability of a crystalline material to plastically deform depends on the ability
of dislocation to move in the material. Therefore, the impeding of the dislocation
movement is necessary to strengthen the materials. Strength of a metallic material can
be enhanced in different ways, as described in following sections. The microstructures
of copper and its alloys have an important bearing not only on their strength but also on
their other mechanical and electrical properties. For example, the microstructure with
counterparts with larger grains but they may lose some ductility. These tradeoffs
between strength, ductility and electrical conductivity depend on the material, the
applications and the microstructural mechanism of the strengthening process.
1.4.1SolidSolutionStrengthening
Solid solution strengthening is the mechanism that increases the strength of
metallic materials by adding specific solute alloying elements to the solvent matrix.
When solute atoms are added to the parent structure, a solid solution is formed and the
crystal structure of the host material is maintained. The composition of a solid solution
is homogenous throughout; the impurity atoms can be either randomly or uniformly
dispersed within the metal lattice structure. The impurity atoms and parent structure
can be also described as solute and solvent atoms, respectively. Impurity point defects
in solid solution can be described into two types: substitutional and interstitial. Figure
1.3 illustrates two different types of solid solution.
For the substitutional solid solutions, shown in Figure 2.3 (a), they have an
identical structure to the metal parent structure with the alloying solute atoms
replacing positions in the structure which are normally occupied by the host atoms in
Figure1.3Solid solutions: (a) substitutional solid solution (b) interstitial solid solution [9]
The principles that controlled alloy formation are summarized in the empirical
Hume‐Rothery solubility rules, as follows:
1. Atomicsizefactor: The atomic radii of the atoms do not differ by more
than 15%. Otherwise, the substantial lattice distortion will be created by the solute
atoms and a new phase will eventually form.
2. Crystal structure: The crystal structure of both atom types must be
identical for appreciable solid solubility.
3. Electronegativity: The elements should not have much different in
electronegativity. Otherwise, they will form intermetallic compounds instead of
substitutional solid solution.
4. Valences: Both host and solute elements must have the same valence
in order to maintain the substitutional solid solution.
The classic example of substitution solid solution is copper‐nickel system. These
two elements can be completely dissolved in one another at every composition.
According to the Hume‐Rothery rules as mentioned earlier, the Cu‐Ni should form
extensive substitutional solid solutions; atomic radii of Cu and Ni are 0.128 and 0.125
nm, respectively. They have the same FCC crystal structure and their electronegativities
are close, 1.9 and 1.8. For the valences, copper has +1 or +2 common valences and
nickel holds +2 valences. For the Cu‐Ag system, the substitutional solid solution is
limited. Regarding the Hume‐Rothery, the electronegativity of copper and silver are 1.9,
both have FCC structure, and they have equal common valences but the atomic size of
copper and silver is approximately 13% difference [10]. It is thus very close to the limit
noted in Hume‐Rothery rules. This large atomic size factor plays a major role on
controlling the degree of solid solution which is directly related to the strain produced
in the lattice. The maximum solubility limit of silver in copper is 8 wt% Ag at 779oC.
Nonetheless, the solubility limit at room temperature is noticeably nearly zero. Table
1.2 shows that there is an atomic radii difference between silver and copper atom
comparable to that between other copper‐base alloys.
Interstitial solid solutions (Figure 1.3(b)), form when small atoms enter spaces
between the parent atoms in the lattice. The radius of alloying atoms should be less
than about 60% of the atomic radius of the parent structure. Typically, the interstitial
alloying elements are carbon and nitrogen. The interstitial alloys that most studied are
transition metals, such as steel, with addition of interstitial alloying atoms to the crystal
alloying atoms is important, however, the occupied site and the degree of occupancy of
the available sites also depend on chemical interaction between those metal atoms.
The insertion of substitution and/or interstitial impurity atoms creates a strain
in the solvent lattice because the solvent atom has difference atomic size from the
surrounding solvent atoms. The lattice distortion, or strain energy around the atomic
distorted area, produces a barrier for dislocation movements and simultaneously
strengthen the alloy. The moving dislocation can be either attracted to, or repelled by,
the alloying atoms. In the case of dislocations attracting to solute atoms, an additional
force is required to pull the dislocations away from them. On the other hand, an
additional force is also required to push dislocations past the solute atoms if the
dislocation is repelled by those alloying atoms, and the movement of individual
dislocations becomes difficult. It will take a much higher stress level or higher
temperature to enable the dislocation to move again. Therefore, the alloy can basically
be strengthened.
The degree of solid solution hardening depends on the relative difference in
elastic stiffness and atomic sizes between solvent and solute atoms. It can be seen that
the larger size differences yields a greater strengthening effects, however, the greater
the difference in sizes of solute and solvent atoms, the more limited is their alloying
stabilities. The solubility limit of dissolved solute atoms in the parent phase is at
maximum homogeneity when the distortion energy reaches a critical value determined
on the yield strength of copper. It shows that increasing of the atomic size difference
and the amount of alloying elements can enhance the solid solution strengthening,
however, the solid solution strengthening in copper‐beryllium system is not significant
because the solid solubility is quite limited, as shown in Table 1.2. In fact, the
remarkably strengthening mechanism in Cu‐Be alloys is precipitation hardening
behavior similar to that observed in copper‐aluminum alloys.
Table 1.2 Approximate atomic radii difference between copper and solute alloying atoms, and approximate solubility of several alloying elements in copper (Modified from [4])
Solute radiiApproximatesizedifference,atomic% Approximatemaximum solubilityinCu,wt%
Silver ‐13 8
Aluminum ‐11 9
Zinc ‐4 39
Tin ‐15 15
Antimony ‐12 11
Bismuth ‐18 0
Lead ‐27 0
Oxygen +113 0
Beryllium +14 2
Silicon +9 5
Phosphorous +70 2
Figure1.4 Effects of alloying elements on yield strength of copper [11]
1.4.2StrainHardening
The plastic deformation of metals and alloys at room temperature, or up to
approximately 0.3Tm, where Tm is the absolute melting temperature of the metal, is
identified as coldworking, as also known as workhardening or strainhardening. During
the strain hardening process, most of energy is dissipated as heat in the metal.
However, at least 10% of energy is reserved as stored energy in the form of vacancies,
dislocations and stacking faults. The amount of stored energy increases with higher
degree of deformation and lower deformation temperatures. The dislocation density
1011 cm‐2 [11]. However, increasing the strength by strain hardening typically also
results in a reduction of ductility as shown in Figure 1.5.
Figure1.5The influence of cold work on 1040 steel, brass and copper, (a) the increase in tensile strength, and (b) the decrease in ductility [6]
Figure 1.5 (a) shows the tensile strength and the percent elongation as a
function of percent cold work for a few example materials. The degree of plastic
deformation is expressed by percentcoldwork which can be defined as [6];
% 100
where A0 is the original cross section area before deformation and Ad is the section area
after deformation.
Deformation during strain hardening processes begins in the grain interiors and
the moving dislocations interact with each other and with the grain boundaries, and
thus the movement of the individual dislocations is impeded. This makes continued
deformation more difficult. The result is strain hardening, and it can be described by the
relationship in terms of flow stress, σf, and plastic strain, ε, as follows:
where K is the strength coefficient and nis the strain hardening exponent. Metals with
high K have high initial resistance to plastic flow. The strain hardening exponent is
identified as the strain hardening rate or the slope of stress‐strain curve after tensile
yield strength is surpassed. The n has typical values of 0.1 to 0.5 for cold working, when
n=0 is no strain hardening. For annealed copper, n is equal to 0.54. Strain hardening is a
measure of how the plastic flow resistance increases when a metal is plastically
deformed. Typically, metals with high strain hardening exponent but with low strength
coefficients can achieve a high strength level after a severe amount of deformation.
Therefore, the mechanical working strengthens metals and alloys by
multiplication of dislocations. The dislocations interact with one another and pile up at
grain boundaries which impede the dislocation movements through the metal
structure. The strengthening mechanism of strain hardening is often achieved at the
1.4.3GrainBoundaryHardening
One of the effective obstacles for slip and dislocation movements is the grain
boundary because of its high energy barrier and the different orientation between
adjacent grains. Since the atomic alignment is different and slip planes are
discontinuous between grains, the movements of dislocations are pinned at the grain
boundaries and provide a source of strengthening, as indicated in Figure 1.6. The
smaller the grains, the shorter the distance that atoms can move along a particular slip
plane resulting in improving the strength of materials. The effect of grain size on
strength is described by the Hall‐Patch relationship [6]. This equation relates the effect
of grain size on the yield strength, σy, of the material.
⁄
with d is the average grain diameter, σ0is an intrinsic grain lattice friction stress and k is
a particular material constant. With decreasing grain sizes, there are more grains with
larger number of aligned slip planes for the dislocation motions.
Heavy deformations, for example, by cold rolling or drawing, can significantly
refine the microstructure of metals and alloys at low temperature. However,
microstructures fabricated by these conventional heavy deformation methods are
commonly cellular substructures with low misorientation angle boundaries. In order to
enhance the strength and other properties of copper and its alloys by reducing the grain
sizes, severe plastic deformation processes (SPD) have been developed, for instance
mechanical milling (MM) [16], dynamic plastic deformation (DPD) [17] and
accumulative roll bonding (ARB) [18,19]. The severe plastic deformation process is an
effective way to produce ultrafine grains (UFG) or nanocrystalline (NC) bulk materials
with high angle (>10o‐15o misorientation angle) grain boundaries which more
effectively hinder the dislocation motions than the low angle grain boundaries (<10o
misorientation angle).
Figure 1.6 Illustration of the motion of a dislocation as it encounters the grain boundary. Slip planes are discontinuous and changed directions across the grain boundary [6].
1.4.4PrecipitationHardening
Precipitation hardening is also known as the age hardening process but
sometimes the term age hardening is used for processing at room temperature. On the
other hand, precipitation hardening refers to heating process above room temperature
for hardening purpose, however, for both cases, the hardening mechanism is the
dislocation movement. Precipitation hardening reactions occur when the initial phase
composition transforms into a two‐phase product, matrix phase and precipitate phase.
The matrix phase maintains the crystal structure of the initial phase but with a different
equilibrium compositions and different lattice parameter. The precipitate phase may
have different crystal structure, composition and/or degree of long range order from
the initial parent phase. The alloy systems that can be precipitation hardenable should
have decreased solid solubility limit with decreasing temperature, as shown in Figure
1.2 for the Cu‐Ag system. The precipitation hardening heat treatment procedure is a
three‐step process in which the alloy is first solution heat treated at high temperature
and rapidly cooled to room temperature trapping the alloy elements in an unstable
supersaturated state. After quenching, the alloy will be heated to an intermediate
temperature for sufficient length of time. The alloying element will be segregated out
from the matrix phase forming the fine particles that create matrix strain in the lattice.
The segregations of solute atoms in the matrix during aging process are called clusters
and are the nuclei for precipitation. The solute atoms from surrounding matrix then
diffuse into these clusters and form a new phase. The combination of fine article size
and the localized strain fields is an effective barrier to dislocation movement. In order
to have effective precipitation hardening, coherency of interfaces between the matrix
and precipitates plays important role. The second phase particles are not often
usually achieved when the alloy is aged to the point that both particle cutting and
particle looping (bowing) of dislocations contributes the alloy strength, Figure 1.7 [20]
Figure 1.7 Schematic of a dislocation (a) curling round the stress fields from precipitates and (b) passing between widely spaced precipitates (Orowan looping) [20].
The microstructure of the precipitates and alloy properties can be determined
by nucleation, growth and coarsening process. During nucleation, the important factors
influencing alloy mechanical strength are the distribution of the precipitates and type of
precipitate formed in the matrix. Nucleation processes can take place either
homogenously or heterogeneously. Homogenous nucleation in solids can be described
as uniformly and nonpreferentially nucleating new phases, such as Guinier‐Preston
(GP) zones and other fully coherent precipitates. Coherent precipitation occurs when
the coherency strain between precipitate particles and matrix phase is insignificant.
heterogeneous nucleation is preferentially formed at specific locations, such as grain
boundaries, dislocations, stacking faults, inclusions, vacancy sites or other crystal
defects which increase the free energy of the material, in order to reduce the overall
free energy of the system. The overall rate of heterogeneous nucleation depends on the
relative concentrations of these irregularities. The free energy relationships correlated
to homogeneous and heterogeneous nucleation can be given by [21]:
where
is the total free energy change for homogeneous nucleation is the total free energy change for heterogeneous nucleation V is the volume of nucleated phase
is the volume free energy of nucleated phase
is the misfit strain energy per unit volume of nucleated phase
Aγ is the surface area and surface energy of nucleated phase, assuming isotropic behavior
is the free energy released during the destruction of a defect
The optimum embryo shape is controlled by the minimization of total interfacial
free energy if ignoring any misfit strain energy. Typical values of surface energy are
listed in Table 1.3. The shape of precipitate and its orientation relationship to the
matrix are optimized to give the lowest total interfacial free energy. Coherent interfaces
are regularly found being faceted, while semicoherent and incoherent are nonfaceted
Table1.3Relationship of surface energy and different types of interfaces [21].
Typeofcoherency Surfaceenergy
Coherent γ(coherent) = γchemical 200 mJ m‐2
Semicoherent γ(semicoherent) = γchemical + γstrain~ 200 – 500 mJ m‐2
Incoherent γ(incoherent) ~ 500 ‐ 1000 mJ m‐2
A coherent interface is characterized by atoms matching perfectly at the
interface plane and continuity across the boundary. At the interface, even the interface
plane has the same atomic configuration with specific orientation relationship in both
phases but there is usually a change in composition across the interface. Formation of
new interfaces leads to formation of mismatched chemical bonds. This increases the
energy of interfacial atoms contributing to the chemical interfacial energy (γchemical). For a coherent interface, the interfacial energy can be described as;
γ(coherent) = γchemical
However, a small mismatch between the atoms at the interface leads to
coherency strain resulting in lattice distortion. Generally, coherent interfaces have a
relatively low interfacial energy that typically ranges up to 200 mJ m‐2. Semicoherent
interfaces become more energetically favorable than coherent interface in order to
partially relax the misfit strain by introducing misfit dislocations. The misfit
lattices. Interfacial energy of semicoherent interface can be approximately defined as
the sum of a chemical contribution, γchemical, and strain contribution, γchemical, due to structural distortion.
γ(semicoherent) = γchemical + γstrain
Semicoherent energies are generally in the range 200 – 500 mJ m‐2. For the
incoherent interface, it is an interphase boundary that has very different crystal
structure and little or no good atomic matching between two adjacent phases across the
interface. The incoherent interface is commonly found at high angle grain boundary or
the interface with disordered atomic structure characterized by a high interfacial
surface energy (~ 500 ‐ 1000 mJ m‐2).
The formation of precipitates is not always uniformly distributed in the matrix
(continuous precipitates) but it can also from along the grain boundaries because they
are the high energy sites. The precipitates formed at grain boundaries are called
discontinuous precipitates, in which lamellar structures of second phase are alternated
with the solute depleted matrix, Figure 1.8.
Williams and Butler [22] identified three major discontinuous precipitation
reactions types, as shown in the schematic given in Figure 2.8.
Type 1 α’ α + β
with α’ is supersaturated single matrix phase and transforms to alternate
lamella of β precipitates and solute depleted α. Type 1 reactions can also be described
Type 2 α’ + γ α + γ
in which a coherent matrix precipitate γ changes to coarser γ lamellae.
Type 3 α’ + γ α + δ
where the coherent, metastable γ transforms to the more thermodynamically
stable δ phase.
Figure1.8Classification of grain boundary discontinuous reactions [22]
This lamellar structure at the grain boundary can also significantly lower the
strength of the alloys. In order to minimize the adverse effect on mechanical and
physical properties, small additions of elements are used to suppress the cellular
Coarsening of the precipitate particles takes place because of the energetically
unstable microstructure of two‐phase alloy. The larger precipitate particles with lower
density have less total interfacial energy (γ) than the smaller particles with higher
density. This provides the driving force for particle coarsening which is controlled by
diffusion of solute atoms. Therefore, the particle coarsening rate increases with
temperature. Oswald ripening is the classical theory of the coarsening of precipitate
particles by which the large particles grow with the expenses of the smaller ones. This
phenomenon is solely driven by interfacial energy. Smaller particles have a higher free
energy as a result of their high surface curvature. Generally, a coarsening rate limiting
factor is considered to be diffusion through the matrix and the rate of change of the
particle radius. From the plot in Figure 1.9, it shows that particles with radius smaller
than ̅, denoted mean radius, are dissolving at increasing rates with decreasing values
of . Meanwhile, the particles with the radius larger than ̅ simultaneously grow.
The migration of an interface separating two phases of different compositions
can be either diffusion controlled or interface controlled depending on interface
mobility, activation energy for diffusion across the interface and interface concentration
[21]. For the coherent interface of two different composition phases (α and β) but the
same crystal structure, the interface can advance by the replacement of α atoms with β
atoms by lattice diffusion associated with vacancies. The migration of this coherent
interface is diffusion controlled as seen during the growth of GP zones. For the
explained to be diffusion controlled. Misfit dislocations at the interface can climb by
vacancy creation or annihilation, however, the two phases forming a coherent or
semicoherent interface with different crystal structures have different interface
advancement processes.
Figure1.9 The variation of growth rate with particle radius for diffusion controlled growth. The smaller particles are dissolving at the rate
approximately proportional to ̅ [20].
In order to improve mechanical strength, ductility or workability of copper and
its alloys, the combination of these strengthening mechanisms needs to be appropriate,
however, for the high strength and high conductivity copper alloys, the choices of
strengthening conditions are also established on the tradeoff between strength and
conductivity. Figure 1.10 shows the tradeoff between strength and conductivity for
hardening processes. It shows that precipitation hardening contributes the optimum
tradeoff between strength and conductivity. During aging treatment, precipitation
hardenable copper alloys show increases in strength along with increased electrical
conductivity, as the solute atoms migrate from solid solution to form precipitates and
continuity in the lattice is increased.
Figure1.10Schematic plots of electrical conductivity as a function of tensile strength for (a) annealed and (b) 60% reduction thickness copper alloy strip [4].
1.5 Spinodal Decomposition
Spinodal decomposition is transformations that can produce A‐rich and B‐rich
regions without a nucleation event. This can normally be found in the alloy systems
with a metastable coherent miscibility gap. As for the normal precipitation, interfacial
with a miscibility gap is shown in Figure 1.11. When an alloy with composition c0 is
solution treated at Temperature T1 and following by quenching to temperature T2 lying
between two points of inflection (where 22 = 0), the free energy will be G0 shown in
Figure 1.11 (b).
Figure1.11Phase diagram with Spinodal decomposition
(a) Variation of chemical spinodal and coherent miscibility gap with composition. (b) Free energy changes during decomposition (modified from [21]).
T1
T2
c1 c0 c2
c1 CB c2
CB (a)
(b)
coherent
miscibility gap
chemical
The total free energy of the system will be decreased due to the fluctuations in
composition producing A‐rich and B‐rich regions. At the early stage of decomposition,
the A‐rich and B‐rich interfaces are diffuse. The interfacial energy between two regions
becomes a “gradient energy” depending on the composition gradient across the
interface. The gradient energy, termed ΔGint, which depends on composition gradient
across the interface, is given by:
Δ
with λ the wavelength of composition modulations in one dimension, Δc the maximum
compositional gradient and K depending on the bond energy differences between like
and unlike atom pairs. If the solid solution have different atomic sizes, this composition
differences will give raise a coherency strain energy, ΔGstrain, which is related to the
misfit δ between regions A and B, where . The elastic strain energy shows
that:
where E is Young’s modulus, ν is Poisson’s ratio and V is the molar volume. After
including the accompanying of the formation of a composition fluctuation, the total free
energy change is described as
Therefore, the condition for a homogeneous solid solution to undergo spinodal
For λ = ∞, the coherent spinodal decomposition, as shown in Figure 2.11, can be
given by
The λ of the composition modulations has to satisfy this condition
For this kinetic process, shown in Figure 1.12, “up‐hill” diffusion takes place until
equilibrium compositions c1 and c2 are reached. For cubic crystals, the Young’s modulus
(E) is usually smaller in the <100> directions and the high strain energy is easily
accommodated in these elastically soft directions.
Figure1.12Schematic composition fluctuation profiles in a spinodal system [23].
Therefore, the composition modulations are commonly localized along the
occur in various alloy systems including Cu‐Ag alloys. The main characteristics of
spinodal decomposition phenomena are side band effects in small angle X‐ray
diffraction, satellite spots in electron diffraction patterns and the modulation structure
along the <100> directions.
1.6 High Strength, High Conductivity Cu‐Ag Alloys
Cu‐Ag alloys and their variations containing minor alloying elements have
attracted interests in recent years because of their excellent combination of high
mechanical strength and high electrical conductivity. This Cu‐Ag system has been
considered as a suitable candidate for the production of conductor wires in non‐
destructive pulsed high field magnets. The important characters of wound conductor
wires from such high field magnets are high electrical conductivity, high mechanical
strength and excellent ductility. With high strength and high electrical conductivity, the
magnetic windings can tolerate Lorentz force and minimize Joules heating produced
from strong exciting electrical current during the pulse. Cu‐Ag based material is also of
interest for other applications, that needs the combination of excellent mechanical
properties and electronic conductivity such as contact wires in high speed train, contact
springs and other conductor applications.
This alloy system can be strengthened through a variety of strengthening
strategies: solid solution hardening, precipitation hardening, grain boundary
mechanical strength along with high electrical conductivity, the most effective
strengthening mechanism is precipitation hardening. Also, the Cu‐Ag system is
considered to be aged hardenable. With higher Ag content, the volume fraction of dual
phases, Cu‐rich and Ag‐rich, increases and the precipitation behavior of secondary
particles is mainly affected by the Ag amount in the alloy systems.
1.6.1PrecipitationBehaviorsinCu‐AgAlloys
It is very well known that copper and silver forms a binary eutectic system with
Cu‐52.98wt%Ag eutectic composition (Figure 1.2), the solubility limit of Ag in Cu is 8
wt.%, and that of Cu in Ag is 8.8wt.% at the eutectic temperature (779.1oC) [24].
However, the solubility limits at room temperature are both small. The precipitation
behavior of this alloy system has been studied for years [25‐29]. As cast Cu‐Ag alloys
consist of a Cu‐rich solid solution (α phase) and Ag‐rich phase (β phase) [30]. The
micro‐composite structures of this alloy system are varied and affected by the amount
of Ag. Over the past few decades, the precipitation behavior of Cu‐Ag alloys and their
minor variations have been studied by many researchers and the alloy compositions in
those works were in the range from Cu‐1.69wt%Ag to Cu‐24wt%Ag [25‐28,31‐34].
Shizuya and Konno [25] investigated the Ag‐rich phase precipitation behaviors of lower
Ag contents Cu‐Ag alloys by TEM and 3D tomography and found that the rod‐shaped Ag
precipitates elongated along {111}Cu plane and resulted from the low surface energy of
were discontinuous growth at grain boundaries. Furthermore, there were no
continuous precipitates and α’ metastable phase found.
Figure1.13 TEM micrograph of Cu‐4at%Ag alloy aged at 450oC for 20 minutes [25].
The Ag precipitates formed in the Cu matrix with a Cube‐on‐cube orientation
relationships or its twin‐variant also having been reported earlier [25,31,35]. From the
previous studies, the orientation relationships of Ag precipitates and Cu matrix can be
described by;
100 // 100 010 // 010
Several research groups have previously investigated discontinuous
precipitation behaviors in Cu‐Ag alloys. Monzen et al. [34] and Manna et al. [29]
suggested that the external applied stress affects the discontinuous precipitation. The
growth of discontinuous precipitate cells in the loading direction and transverse
direction were enhanced by a tensile stress. On the other hand, a compressive stress
suppressed the discontinuous growth in the transverse direction. They concluded that
the growth behavior of silver precipitates elongated in <110>α direction determined the
anisotropy of the cell growth rate. However, the existence of discontinuous precipitates
is associated with a decrease of hardness and yield strength. In order to suppress the
formation of discontinuous precipitates along grain boundaries, a small amount of Zr is
added into the Cu‐Ag alloy system. The creation of the CuAgZr ternary system has been
successful in subduing the nucleation and growth of the discontinuous precipitates at
grain boundaries [2,36]. Furthermore, the addition of Zr correspondingly enhances the
recrystallization by forming ternary phase Cu4AgZr acting as heterogeneous nucleation
sites during dynamic recrystallization and thereby causes smaller grain sizes after
dynamic recrystallization and thereby causes smaller grain sizes after dynamic
1.6.2ModulatedStructureofPrecipitates
In the 1960s, Raty and Miekk‐oja [26] reported that the formation of
discontinuous precipitates commonly formed on the {111}Cu and {100}Cu planes were
associated with the growth of extrinsic stacking faults. They examined single crystals of
Cu alloy systems, one binary with 5wt%Ag and the other ternary with 5wt%Ag and
2wt%Al, and found that a stacking fault bounded by a Frank partial dislocation
promotes the formation of Ag precipitates because the climbing of the Frank partials
emits vacancies which are needed for the precipitates formation. The TEM micrograph
in Figure 1.14 shows the discontinuous precipitates deposited on {111} planes in Cu‐
5wt%Ag‐2wt%Al sample aged at 450oC for 2 hours.
Monzen et. al [27]also reported the growth mechanism of these modulated
precipitates in {100}Cu planes. They proposed the formation mechanism of disk‐shaped
Ag precipitates elongated along <110> directions by the relaxation of misfit strain
energy between the Cu matrix and Ag precipitates along <100> directions as to
minimize the elastic strain energy. Figure 2.15 shows TEM observation on Cu‐
5.7wt%Ag alloy aged at 450oC for 2 hours. The aggregation of disk‐shaped precipitates
are parallel to the (001) plane, labeled B in Figure 1.15.
Figure1.15TEM micrograph of disk‐shaped and rod‐shaped Ag precipitates and Ag‐depleted Cu matrix in Cu‐5.7wt%Al alloy single crystal
1.6.3Microstructure‐PropertiesRelationships
A fundamental understanding of the microstructure‐properties relationships of
materials is essential for appropriate materials selection for different used and
applications. For high strength and high electrical conductivity applications, Cu‐Ag
alloys have been a strong candidate because of their outstanding properties. As
mentioned earlier, there have been many attempts to improve such properties through
the addition of minor alloying elements, heat treatments and deformation processes. In
this section, the microstructure‐properties relationships of heat treated or plastically
deformed Cu‐Ag alloys and their minor alterations are summarized.
As discussed earlier, discontinuously precipitated cells can significantly lower
hardness compared to continuous precipitates. Discontinuous precipitates occur at the
high angle grain boundaries during the aging treatment. Therefore, an effective ways to
terminate the discontinuous precipitation modes is the alteration of alloy compositions
and modification of grain boundary by adding a small amount of third element. . Lin
and Meng [37] presented the effect of aging treatment on microstructure and
mechanical properties of Cu‐6wt%Ag, Cu‐12wt%Ag and Cu‐24wt%Ag. They found that
the discontinuous precipitates reaction predominate in Cu‐6wt%Ag while net‐like
eutectic colonies that continuously precipitates predominate in higher Ag content alloy,
Cu‐24wt%Ag. The effects of Zr addition in Cu‐7wt%Ag alloy on mechanical and
electrical properties were studied by Gaganov et al [2]. The optimum Zr content to
the ternary Cu4AgZr phase was 0.05wt%Zr. With appropriate cold work deformation
and heat treatment, high strength and high electrical conductivity can be achieved.
Lyubimova et al. [38] investigated the microstructure‐properties relationship of
the heavily cold worked Cu‐7wt%Ag‐0.05wt%Zr alloys with intermediate heat
treatment during the cold deformation process. They stated that the strain to failure of
the heat treated samples was significantly increased comparing to the samples with the
same ultimate tensile strength level. After cold drawing up to a logarithmic deformation
strain η = 4.3, the anisotropic Cu matrix grains with estimated to have a mean size of
100 nm and contain homogeneously distributed Ag continuous precipitates, as shown
in Figure 1.16 (a). With the intermediate heat treatment during the cold drawing
process, the strain to failure of tested samples are greater compared to the sample
without any heat treatments, Figure 1.16 (b).
With different Ag content ranging from 6, 12 and 24 wt.% in the Cu‐Ag alloys, Liu
et al. [39] studied their microstructure evolution and properties after cold drawing up
to draw ratio η = 6. Their results showed that the strengthening of the samples mainly
depends on the degree of hardening effect of the Cu matrix. The high Ag content creates
high strain hardening rate and also high strength. However, the electrical conductivity
of Cu‐24wt%Ag is lower than the other two alloys. It can be determined that the
properties of the microcomposites filaments are exclusively affected by the eutectic
electrical conductivity of the test alloys are shown in Figure 1.17 (a) and (b),
respectively.
(a) (b)
Figure1.16 Cu‐7wt%Ag‐0.05wt%Zr (a) TEM micrographs of alloy after cold drawing up to η = 4.3 (b) strain to failure as a function of drawing strain [38].
(a) (b)
1.7 References
[1] J.R. David, Copper and Copper Alloys, ASM International, Ohio, 2001.
[2] A. Gaganov, J. Freudenberger, E. Botcharova, L. Schultz, Effect of Zr additions on the microstructure, and the mechanical and electrical properties of Cu–7 wt.%Ag alloys, Materials Science and Engineering: A. 437 (2006) 313‐322.
[3] F. Bittner, S. Yin, A. Kauffmann, J. Freudenberger, H. Klauß, G. Korpala, R. Kawalla, W. Schillinger, L. Schultz, Dynamic recrystallisation and precipitation behaviour of high strength and highly conducting Cu–Ag–Zr‐alloys, Materials Science and Engineering: A. 597 (2014) 139‐147.
[4] J.R. Davis, Copper and Copper Alloys, ASM International, Ohio, 2001.
[5] K.G. Budinski, M.K. Budinski, Engineering Materials Properties and Selection, seventh ed., Prentice Hall, New Jersey, 2002.
[6] W. Callister, Materials Science and Engineering: An Introduction, John Wiley & Sons, New York, 2007.
[7] S.C. Krishna, N.K. Gangwar, A.K. Jha, B. Pant, K.M. George, Enhanced strength in Cu‐ Ag‐Zr alloy by combinaiton of cold working and aging, Journal of Materials Engineering and Performance. DOI: 10.1007/s11665‐014‐0882‐2 (2014).
[8] Y. Yamamoto, G. Sasaki, K. Yamakawa, M. Ota, High‐strength and high‐electrical‐ conductivity copper alloy for high‐pin‐count leadframes, 19 (2000) 65‐70.
[9] T. R.J.D., Understanding Solids: The Science of Materials, second ed., John Wiley and Sons, West Sussex, 2013.
[10] L. Abbasschain, R.E. Abbasshian, Physical Metallurgy Principle, forth ed., Cengage Learning, Stamford, 2009.
[11] R. A.C., Metallurgy for the Non‐Metallurgist, second ed., ASM International, Ohio, 2001.
![Figure 1.5 The influence of cold work on 1040 steel, brass and copper, (a) the increase in tensile strength, and (b) the decrease in ductility [6]](https://thumb-us.123doks.com/thumbv2/123dok_us/1382655.1170937/30.612.168.487.227.427/figure-influence-copper-increase-tensile-strength-decrease-ductility.webp)