ISSN(Online): 2320-9801
ISSN (Print): 2320-9798
I
nternational
J
ournal of
I
nnovative
R
esearch in
C
omputer
and
C
ommunication
E
ngineering
(A High Impact Factor, Monthly, Peer Reviewed Journal)
Website: www.ijircce.com
Vol. 5, Issue 10, October 2017
Prediction of Stock Market Using Data Mining
Algorithm Based on Historical Prices
Dr.S.Radhimeenakshi MCA., M.Phil.,Ph.D1, K.Latha2
Associate Professor, Department of Computer Science, Tiruppur Kumaran College for women, Tiruppur,
Tamilnadu, India.
Research Scholar, Tiruppur Kumaran College for women, Tiruppur, Tamilnadu, India
ABSTRACT: Predicting stock return is an important financial subject that has attracted researchers’ thought for many years. It involves an assumption that fundamental information publicly available in the past has some predictive relationships in the future stock returns. The predicted value straight affects the stock price and no one take risk to drop down in stock market index. So due to money involvement and the reputation of the shares, stock market needs to be a perfect or more accurate prediction about their upcoming market trends. Various machine learning algorithms are used for stock data set and the objective is to forecast the stock market. In this work the different problems are reviewed, these are defined in the problem formulation and it is resolved with the help of multiple decision tree based learning algorithms ID3 as previous study C4.5 as proposed method that is implemented in the research work. The results for the stock market prediction are validated through evaluation metrics, namely mean absolute deviation, mean square error, root mean square error, mean absolute percentage error used to estimate the forecasting accuracy in the stock market. The proposed model can be a supportive tool for the investors to take the right decision regarding their stocks based on the analysis of the historical prices of stocks in order to extract any predictive information from that historical data. The obtained results show that the proposed C4.5 approach produces better results than the other techniques in terms of accuracy.
KEYWORDS: Prediction, Stock Market, Data Mining, Prices, Forecast.
I. INTRODUCTION
Data Mining is a logical method intended to discover data (generally huge amounts of data such as business or market) in finding of reliable patterns and efficient associations among variables, and authenticate the result by applying the discovered patterns to innovative subsets of information. The final target of data mining is prediction and predictive data mining is the mainly general form of data mining and that have several straight industry applications. The procedure of data mining contains three phases: (1) The primary exploration, (2) Model structure or pattern recognition with substantiation and confirmation, and (3) Operation (i.e., the request of the model to latest data in order to produce predictions).
Exploration: This is phase1 which typically begins with data training which may engage cleanout data, data transformations, choosing subsets of collections and incase of information sets with huge numbers of fields , a few opening attribute assortment operations to get the amount of fields to a convenient collection (based on the statistical process which are being measured). After that, based on the natural history of the logical trouble, this opening phase of the procedure of data mining may engage anyplace among an easy option of uncomplicated predictors for a decay model, to detailed investigative analyses by a large range of graphical and statistical procedure (Exploratory Data Analysis (EDA)) in order to recognize the more related fields and decide the difficulty and the common character of models that be able to taken into report in the subsequent phases.
ISSN(Online): 2320-9801
ISSN (Print): 2320-9798
I
nternational
J
ournal of
I
nnovative
R
esearch in
C
omputer
and
C
ommunication
E
ngineering
(A High Impact Factor, Monthly, Peer Reviewed Journal)
Website: www.ijircce.com
Vol. 5, Issue 10, October 2017
Operation: This is the last phase which includes the model chosen as most excellent in the preceding phase and applying it with latest data which produce predictions or estimates of the probable result.
The idea of Data Mining is appropriate gradually more trendy as an industry information organization implement where it is probable to expose information structures that are able to conduct decisions in situation of restricted conviction. In recent times, there have been enlarged attention in rising new diagnostic techniques particularly intended to lecture the problems appropriate to company Data Mining (example: Classification Trees).Other than Data Mining is still depend on the theoretical ethics of information with the established Exploratory Data Analysis (EDA) modeling and it distributing with them both a few mechanism of its common approaches and precise methods.
Text clustering and multi-document summarization are two basic tackle for perceptive manuscript data. Probabilistic Latent Semantic Analysis is an extensively used technique for text clustering during the plainness of the formulation, and effectiveness of its EM-style computational algorithm. The ease makes it simple to include PLSA into further machine learning algorithms. There are lots of additional developments of PLSA, such as Latent Dirichlet Allocation and further issue models.
The necessary formulation of PLSA is the development of the co-occurrence prospect P into a covert class variable z that split word distributions from the text distributions specified underlying class. Though, as it is at present formulated, PLSA severely requires the amount of word dormant classes to be equivalent to the amount of text hidden classes (i.e., there is a one-to-one communication among word clusters and text clusters).In realistic applications, still, this severe constraint may not be fulfilled because if any one considers papers and words as two dissimilar kinds of items, they possibly will have their personal cluster structures, which are not essentially identical, even if connected.
1.1.1 OVERVIEW OF DATA MINING
Data mining (otherwise known as data or knowledge discovery) is the method of analyzing data from various perspectives and abbreviate it into helpful information .An information that are used to enlarge proceeds, cuts expenses or both. It permits users to evaluate facts from lots of various proportions or angles, classify it, and review the associations recognized. In principle, data mining is the method of discovery correlations or patterns in the middle of collection of fields in huge relational databases.
II. LITERATURE REVIEW
Xiaoyue Wang al., [1] has planned to bring a remarkable review of the interest in applications that deal with querying and mining of time series data. Many of the research and an effort in this context have focused on introducing new representation methods for dimensionality reduction or novel similarity measures for the underlying data. In the huge majority of cases, each individual work introducing a exacting method has made specific claims and, aside from the occasional theoretical justifications, provided quantitative experimental observations.
Esling and C. Agon al., [2] has proposed in almost every scientific field, measurements are performed over time. These observations lead to a collection of organized data called time series. The purpose of time-series data mining is tried to extract all meaningful knowledge from the shape of data. Even if humans have an ordinary capacity to perform these tasks, it remains a complex problem for computers. In this article they intend to provide a survey of the techniques applied for time-series data mining. The first part is committed to an overview of the tasks that have captured most of the interest of researchers.
K. Rehfeld, N. Marwan al., [3] has planned geoscientific measurements frequently provide time series with irregular time sampling, requiring also data renovation (interpolation) or complicated methods to handle irregular sampling. They estimate the linear interpolation technique and different approach for analyzing the correlation functions and persistence of irregularly sampled time series, as Lomb-Scargle Fourier transformation and kernel-based methods. In a methodical benchmark test they are examining the performance of these techniques.
ISSN(Online): 2320-9801
ISSN (Print): 2320-9798
I
nternational
J
ournal of
I
nnovative
R
esearch in
C
omputer
and
C
ommunication
E
ngineering
(A High Impact Factor, Monthly, Peer Reviewed Journal)
Website: www.ijircce.com
Vol. 5, Issue 10, October 2017
D. Lorenz al., [7] has proposed the results of a comparison of denoising methods for one dimensional time series. The comparison has been carried out within the DFG Priority Program 1114 ”Mathematical methods for time series analysis and digital image processing”. The aim of this report is to nearby an extensive comparison of some basic denoising methods and some more elaborated methods. They apply different methods to a set of noisy test time series and measure the performance with different error measures. One surprising result is that in some cases which are assumed to be difficult, the easiest methods (namely a simple moving average) yield the best results.
III.PROPOSED WORK
In this research, we focus on C4.5 which is one of decision tree generators using top-down approach.It uses the information to increase ratio as the splitting criterion for each internal node. Like other similar top-down approaches, C4.5 uses a greedy searching strategy with looking one step ahead to find the way of splitting instance space, so it often suffers from being poor at local optimum and therefore performs poorly in dealing with some hard classification tasks, in which training data are described by high dimensional attribute vectors and the concept to be learned is complex. There have been proposed several non-greedy search approaches, which choose a splitting model automatically by observing the structure of data, so the splitting models are different nodes to nodes. Construction of optimal or near-optimal decision trees using a two stage approach has been attempted by many authors.
In the first stage, a sufficient partitioning is induced using any reasonable greedy method. In the second stage, the tree is refined to be as close to optimal as possible. A different temptation of generating non-greedy decision tree is to use genetic method. This research proposes a new algorithm for generating a tree classifier that is based on C4.5 and an instance-based learning.
The proposed approach C4.5, Unlike other decision tree generation methods uses clustering as a pre-processing procedure and the decision tree is generated according to the result of clustering. C4.5 generates a decision tree using the standard TDIDT (Top Down Induction of Decision Trees) approach, recursively partitioning the instance space into smaller subspaces, based on the value of a selected attribute.
It begins with a set of instances, called training instances, already separated into classes. Each instance is described in terms of a set of attributes, which can be numerical or symbolical. The overall approach uses a greedy search strategy to choose the attribute that divides the instances best into their classes.
This process is functional recursively to each partitioned subset, with the procedure ending when all instances in the current subset belong to the same class; C4.5 uses an information gain ratio for measuring how well an attribute can divide the instances into their classes. In “Integrating Decision Tree and Spatial Cluster Analysis for Landslide Susceptibility Zonation”, a notion called CART (Classification and Regression Tree) is implemented.
The main idea in CART is to partition the dataset into homogeneous subgroups with respect to the same class. The compound data structure can be represented conveniently by a tree structure in which an internal node denotes a best split predictor variable, the branches of a node denote the criteria value of the split variable, and a leaf denote the final response class. In the tree structure, the paths from the root node (top node) to leaf (terminal node) node are explaining the decision rules that maximize the distinction among the classes and minimize the diversity in each class.
3.1 DESCRIPTION OF EXISTING SYSTEM
A cluster is a prearranged record of substance, which contain little general distinctiveness. Thus a cluster is the gathering of substances which are comparable and are dissimilar from the substance that feels right to further clusters. Bottom purpose of clustering is to search out the intrinsic federation in a set of unlabelled statistics. There is no typical to discover the finest clustering method which is self-determining of the dataset. It based on user who should provide the standard in such a technique that an effect of clustering will outfit their requirements.
Clustering algorithms could be functional in several domains such as in advertising to search groups of consumers with comparable behaviors and customer’s retail behavior, in environmental science for categorization of plant life and animals, or inside store for categorize books. Consequently a method depend on clustering can only identify the substance in our container the distributions or storing keen on the grouping where we might cluster them into the shares which formerly have moderately little final cost and top final cost, except it was not probable to provide result as a potential result predict the increase or decrease in the costs of the store costs in the upcoming years.
ISSN(Online): 2320-9801
ISSN (Print): 2320-9798
I
nternational
J
ournal of
I
nnovative
R
esearch in
C
omputer
and
C
ommunication
E
ngineering
(A High Impact Factor, Monthly, Peer Reviewed Journal)
Website: www.ijircce.com
Vol. 5, Issue 10, October 2017
stocks. Analyzing stock price data more than several years may involve a few hundreds or thousands of records, but these must be selected from millions. The data that will be used in this paper to build the decision tree will be the historical prices of three listed companies in BombayStock Exchange over two years of time.
IV.DATA COLLECTION AND EXPERIMENTAL ANALYSIS
The data are collected from Bombay Stock Exchange. The selected industries are “Wipro”, its’ code in the stockpile market “WIPRO” and it go to the banking segment, “United Arab Investors Company”, its system is “INFOSYS” and it belong to the military segment, and “Middle East composite for Engineering, Electronics and important companies”, its’ policy is “TCS” and it belongs to the manufacturing segment. The period that was chosen is from April 2015 to May 2016, which obtains the present and current status of the marketplace at that stage of time.
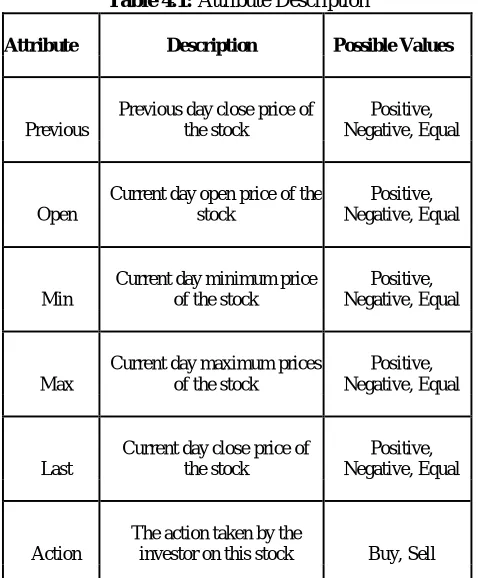
Table 4.1: Attribute Description
Attribute Description Possible Values
Previous
Previous day close price of the stock
Positive, Negative, Equal
Open
Current day open price of the stock
Positive, Negative, Equal
Min
Current day minimum price of the stock
Positive, Negative, Equal
Max
Current day maximum prices of the stock
Positive, Negative, Equal
Last
Current day close price of the stock
Positive, Negative, Equal
Action
The action taken by the
investor on this stock Buy, Sell
At the starting, the data gathered controlled by 9 characteristics. This research uses only 6 attributes and remaining characteristic are not significant and not contain a direct consequence on the learning. Table 4.1
demonstrates the 6 attributes chosen with their metaphors and their probable standards.
The class quality is the shareholder act whether to purchase or selling that item and it is called, “Action”. The information of this attribute was in use as well from BSE database, which is the net location of one of the main brokers’ production with the beyond given stock items daily. The net pose could be both purchasing and retailing that product for that date.
V.CONCLUSION AND FUTURE WORK
ISSN(Online): 2320-9801
ISSN (Print): 2320-9798
I
nternational
J
ournal of
I
nnovative
R
esearch in
C
omputer
and
C
ommunication
E
ngineering
(A High Impact Factor, Monthly, Peer Reviewed Journal)
Website: www.ijircce.com
Vol. 5, Issue 10, October 2017
of the chronological costs of store in order to mine any prognostic information from that chronological data. The outcomes for the future method were not ideal since a lot of feature together with but not incomplete to supporting actions, common profitable situation and shareholders’ prospect manipulate share market.
A variety of data mining methods can be efficiently realized on instructive data. From the over outcome it is patent that classification methods can be functional on enlightening data to calculate the stock’s result and progress their outcomes. The effectiveness of different decision tree algorithms are able to be analyzed depend on their correctness and time taken to obtain the tree. The forecast obtained from the scheme have assisted the instructor to recognize the feeble stocks and progress their presentation.
The investigation of the outcome confirmed from the BSE is an evidence for the similar. Because the relevance of data mining convey a lot of compensation in advanced knowledge organization, these methods can be practical in the additional areas of learning to optimize the possessions, to envisage the detainment of faculties in the institute, to calculate the amount of stocks that are possible to get an assignment, to calculate the reaction of the instructor etc.
As for the expectation work, there is an unmoving large space for taxing and improving the future model by an evaluating the model above the entire industries scheduled in the store market. In addition, the assessment of a better assortment of knowledge method such as neural networks, genetic algorithms, and organization rules can characterize a prosperous area for prospect examination. Lastly, re-evaluate the issue disturbing the performance of the store markets, such as trading quantity, information and economic information which may impact stock costs can be a further rich field for further learning.
REFERENCES
[1] X. Wang, A. Mueen, H. Ding, G. Trajcevski, P. Scheuermann, and E. Keogh, “Experimental comparison of representation methods and distance measures for time series data,” Data Mining Knowl. Discovery, vol. 26, no. 2, pp. 275–309, Feb. 2012.
[2] P. Esling and C. Agon, “Time-series data mining,” ACM Comput. Surveys, vol. 45, no. 1, pp. 1–34, Nov. 2012.
[3] K. Rehfeld, N. Marwan, J. Heitzig, and J. Kurths, “Comparison of correlation analysis techniques for irregularly sampled time series,” Nonlinear Processes Geophysics, vol. 18, no. 3, pp. 389–404, Jun. 2011.
[4] X. Wang, K. Smith, and R. Hyndman, “Characteristic-based clustering for time series data,” Data Mining Knowl. Discovery, vol. 13, no. 3, pp. 335–364, May 2006.
[5] R. B. Cleveland, W. S. Cleveland, J. E. McRae, and I. Terpenning, “STL: A Seasonal-trend decomposition procedure based on loess,” J. Official Statist., vol. 6, no. 1, pp. 3–73, 1990.
[6] J. A. Ryan. (2013). Quantmod: Quantitative financial modeling framework. r package version 0.4-0 [Online]. Available: http:// CRAN.R-project.org/package=quantmod
[7] T. K€ohler and D. Lorenz. (2005). A comparison of denoising methods for one dimensional time series. Tech. Rep. [Online]. Available: http://www.math.uni-bremen.de/zetem/DFGSchwerpunkt/ preprints/orig/lore nz20051dreport.pdf
[8] W. Constantine and D. Percival. (2012). WMTSA: Wavelet methods for time series analysis [Online]. Available: http://cran. r-project.org/package=wmtsa
[9] M. Hubert and E. Vandervieren, “An adjusted boxplot for skewed distributions,” Comput. Statist. Data Anal., vol. 52, no. 12, pp. 5186–5201, Aug. 2008.
[10] P. Rousseeuw, C. Croux, V. Todorov, A. Ruckstuhl, M. Salibian-Barrera, T. Verbeke, M. Koller, and M. Maechler. (2013). Robustbase: Basic robust statistics [Online]. Available: http:// cran.r-project.org/package=robustbase
[11] M. M. Breunig, H.-p. Kriegel, and R. T. Ng, “LOF: Identifying density- based local outliers,” in Proc. ACM SIGMOD Int. Conf. Manage. Data, 2000, pp. 93–104.
[12] L. Torgo. (2010). Data Mining With R, Learning with Case Studies. London, U.K.: Chapman & Hall [Online]. Available: http:// www.dcc.fc.up.pt/ ltorgo/DataMiningWithR
[13] D. T. Pham and A. B. Chan, “Control chart pattern recognition using a new type of self-organizing neural network,” Proc. Institution Mech. Eng. Part I-J. Syst. Control Eng., vol. 212, no. 2, pp. 115– 127, 1998.
[14] Dr. S. Radhimeenakshi, Dr. G. M. Nasira, “Prediction of Heart Disease using Neural Networks with back propogation”, International journal of computing Algorithm 4(special issues),1166-1169 ,March 2015.