Sensor Innovations
Based on Modified Carbon
Electrodes
PhD Thesis
COPYRIGHT
Attention is drawn to the fact that copyright of this thesis rests with the author. A copy of this thesis has been supplied on condition that anyone who consults it is understood to recognise that its copyright rests with the author and that they must not copy it or use material from it except as permitted by law or with the consent of the author.
Contents
Acknowledgement………... VII
Summary...………... IX
List of Abbreviations....………... XI
List of Symbols...………... XII
1. INTRODUCTION TO ELECTROCHEMICAL METHODS
1.1. Polarization of Interfaces ……….. 3
1.2. Electrode Kinetics ……….. 8
1.3. Adsorption at Electrode Surfaces ………. 11
1.4. Mass Transport ……… 12
1.5. Voltammetric Techniques ……… 16
1.6. Surface Characterization Techniques ……… 45
1.7. Innovation in Electrochemical Sensing ……….. 58
1.8. References ………. 61
2. INTRODUCTION TO NANOCARBON MATERIALS 2.1. Introduction ……….. 65
2.2. Graphenes ………. 66
2.5. Carbon Nanoparticles (CNPs) ………. 77
2.6. Contributions from this Thesis ……… 80
2.7. References ……….. 80
3. VOLTAMMETRY OF COBALT(II)PHTHALOCYANINE (COPC) AT
4-(3-PHENYLPROPYL)PYRIDINE MICRODROPLET | AQUEOUS
ELECTROLYTE | ELECTRODE TRIPLE PHASE BOUNDARY
INTERFACES
3.1. Introduction ……… 89
3.1.1. Introduction to Metallophthalocyanine (MPc) Redox
Systems ………. 89
3.1.2. Introduction to Electrode - Liquid - Liquid Triple
Phase Boundary Redox Processes……….. 92
3.2. Experimental ……….. 93
3.3. Results and Discussion ……….. 95
3.3.1. CoPc Microdroplet Voltammetry I.: Effects of the
Deposition Volume, Scan Rate, and Concentration ………. 95
3.3.2. CoPc Microdroplet Voltammetry II.: Effects of the
Supporting Electrolyte ………. 99
3.3.3. CoPc Microdroplet Voltammetry III.: Effects of
Carbon Dioxide ……….. 102
3.4. Conclusion ………. 104
4.1. Introduction ……….. 109
4.1.1. Introduction to pH Sensors ……….. 109
4.1.2. Introduction to Anthraquinone Redox Systems ………. 111
4.2. Experimental ………. 113
4.3. Results and Discussion ………. 115
4.3.1. TODAQ Voltammetry I.: Effects of Deposition Volume, Scan Rate, and Phosphate Buffer Solution pH ……….. 115
4.3.2. TODAQ Voltammetry II.: Effects of the Type and Concentration of Supporting Electrolyte ……….. 118
4.4. Conclusion ……… 122
4.5. References ……… 123
5. DNA - CARBON NANOPARTICLE CONJUGATE FILMS 5.1. Introduction ……… 128
5.2. Experimental ………. 132
5.3. Results and Discussion I.: Poly-Adenylate – CNP Films ……… 134
5.4. Results and Discussion II.: dsDNA – CNP Films ………. 136
5.5. Results and Discussion III.: Junction Experiments ……….. 140
5.6. Conclusions ……… 142
5.7. References ……….. 143
6. SURFACE-DOPYLATED CARBON NANOPARTICLES SENSE GAS-INDUCED PH CHANGES
6.1. Introduction to Hydroquinone/Quinone
Redox Systems ………. 150
6.2. Introduction to Ammonia Sensing ……… 152
6.3. Experimental ……….. 153
6.4. Results and Discussion ……….. 157
6.4.1. Formation of L-Dopa-Boc-Modified Carbon Nanoparticles and Voltammetric Characteristics in Aqueous Media ………….. 157
6.4.2. Voltammetric Characterisation of L-Dopa-Boc-Modified Carbon Nanoparticles in Contact to Humidified Dowex Media ……. 159
6.4.3. Voltammetry of L-Dopa-Boc-Modified Carbon Nanoparticles in Contact to Humidified Dowex Media as a Tool for Ammonia Sensing ……… 163
6.5. Conclusion ……….. 165
6.6. References ……….. 166
7. SURFACE ELECTROCHEMISTRY AT DOWEX IONOMER | GLASSY CARBON | GAS INTERFACES 7.1. Introduction to Prussian Blue and Ionomer | Electrode | Gas Interfaces ……… 173
7.2. Experimental Methods ……….. 174
7.3. Results and Discussion ……….. 177
7.3.1. Voltammetric Characteristics of Co(phen)33+/2+ Absorbed into Acidic Dowex 50 W×4 ………. 177
7.4. Conclusions ……….………. 184
Acknowledgements
First of all, I would like to express my deepest gratitude to my supervisor for his
tremendous and never ending support throughout all this years during my stay in the
UK for my PhD study at the University of Bath. Thank you so much for your
encouragement and for all kinds of support you have given me and for the
inspirational dedication towards excellence in academic and research you have shown.
Next, to all the Marken group members for the great teamwork and co-operation,
especially to John Watkins for preparing the carbon nanoparticle used for experiments
in chapter 5, to Kate for preparing another type of carbon nanoparticle for
experiments in chapter 6.
Thank you also to Luke Keenan, from Andrew Burrow’s group for lending his hands
preparing cobalt phenanthroline for the experiments in chapter 5 and chapter 7.
And the most importantly, my beloved wife and my wonderful children for their
patience and for their eternal love and support you have given me.
Finally, I thank you the Government of Malaysia for granting me a lifetime
Summary
This thesis describes experimental work on electrochemical sensing mechanisms.
Chapter 1 and Chapter 2 provide an introduction to electrochemical and surface
science techniques as well as nano-carbon materials which are of interest in
electroanalysis and sensing.
Chapter 3 and Chapter 4 focus on electrochemical processes at liquid | liquid |
electrode triple phase boundary systems. In Chapter 3 the electrochemical behaviour
of CoPc (cobalt phthalocyanine) dissolved into an organic water –insoluble liquid and
deposited as microdroplets on a graphite electrode is studied. Both cation and anion
transfer are observed at the liquid | liquid phase boundary. Chapter 4 describes redox
processes of a highly hydrophobic anthraquinone derivative where preferential
transfer of protons and pH sensitivity are observed. Both systems, CoPc and
anthraquinone derivative, are investigated towards CO2 sensitivity.
In Chapter 3 and 4 graphite electrodes are employed, but in Chapter 5 graphitic
carbon nanoaprticles are employed with a surface functionalisation to provide binding
capability to DNA fragments. Layer-by-layer deposition of DNA-carbon nanoparticle
composite film electrodes is demonstrated and the electrochemical properties of the
films are investigated. A novel type of DNA hybridisation sensing mechanism based
Chapters 6 and 7 are dedicated to gas sensing with a novel electrochemical system
based on ionomer spheres in contact to the working electrode. In Chapter 6 Dowex
ionomer particles are impregnated with carbon nanoparticles which are functionalised
with DOPA to provide redox activity and Faradaic current responses. The effect of
ionomer type and gas composition is studied. In Chapter 7 Prussian blue nanoparticles
are immobilised onto the ionomer particle surface to provide a sensing system with
peroxide sensitivity.
Overall, this thesis contributes to sensing of bio-molecules and of gases. By
introducing new types of interfaces (triple phase boundary, ionomer contacts, carbon
nanoparticle redox systems) it is shown that sensitivity and selectivity can be tailored.
In future these types of sensor prototypes could be further developed for specific
List of Abbreviations
AA ascorbic acid
AC alternating current
AFM Atomic Force Microscopy
bppg basal plane pyrolitic graphite
CMWNT carbon multiwalled nanotube
CNF carbon nanofiber
CNP carbon nanoparticle
CNT carbon nanotube
CR-GO chemical reduced graphene oxide
CRG chemically reduced graphene
CV cyclic voltammetry
CVD chemical vapor deposition
DC direct current
DNA Di nucleic acid
DPV Differential Pulse Voltammetry
EDS Energy Dispersed X-Ray Spectrometer
EMF Electromotive Force
FEGSEM Field Emission Gun Scanning Electron Microscopy
GC glassy carbon
GO graphene oxide
GOD glucose oxidase
HOMO Highest Occupied Molecular Orbital
IHP Inner Helmholtz Layer
ITO Indium induced Titanium Oxide
IC integrated circuit
LUMO Lowest Unoocupied Molecular Orbital
MG methylene green
MGNFs multilayer graphene nanoflake films
MOD Metal Organic Deposition
NP nanoparticle
OHP Outer Helmholtz Layer
PECVD plasma enhanced chemical vapor deposition
RF radio frequency
SLG single layer graphene
SHE Standard Hydrogen Electrode
SCE Saturated Calomel Electrode
SEM Scanning Electron Microscopy
SPM Scanning Probe Microscope
SWNT single wall nanotube
List of Symbols
Symbol Quantity Units
A electrode surface area cm2
A frequency factor -
C capacitance F m-2
c concentration mol cm-3
D Diffusion coefficient cm2 s-1
E potential V
Eeqm equilibrium potential V
Epz potential of zero charge V
F Faraday constant C mol-1
∆G Gibbs free energy kJ mol-1
∆G*
red Gibbs free energy of reduction kJ mol-1
h Planck’s constant J s
ip peak current A
j flux of reactant mol cm-2 s-1
jcap capacitive current density A m-2
k wavenumber -
k0 standard electrochemical rate
constant
cm s-1
R gas constant Jmol K-1
T temperature K
ρ charge C
Φ potential V
η potential difference / overpotential V
α charge transfer coefficient -
λ wavelength m
ν frequency -
Chapter 1
Introduction to Electrochemical Methods
This chapter provides an introduction into experimental methods and theory for
Contents
1.1. Polarization of Interfaces ………..
3
1.2. Electrode Kinetics ………..
8
1.3. Adsorption at Electrode Surfaces ……….
11
1.4. Mass Transport ……… 12
1.5. Voltammetric Techniques ……… 16
1.6. Surface Characterization Techniques ……… 45
1.7. Innovation in Electrochemical Sensing ……….. 58
1.1
Polarization of Interfaces
1.1.1
Interfacial Region
Electron transfer is an event in a molecular scale where a negatively charged entity
passes through between an electrode and a species in solution. The reason for electron
transfer to occur is the potential gradient present at the electrode surface which results
from the difference in potential values when two different materials or phases come in
contact with each other; between a solid electrode and the electrolyte solution. For
example, the potential difference between a local electrode and the adjacent solution
may be 1 V, measured over a gap between 1 nm, then the potential gradient shall be
of the order of 109 V m-1 [ 1 ]. When studying the rate of electron transfer, a
considerable thought on the potential gradient at the interfacial region is of vital
importance.
Whenever a potential is applied to the electrode surface, a charging characteristics
involving the electrostatic effect is observed. Ions and dipoles with opposite charges
are most likely attracted to the electrode surface. This eventually results in the
formation of “electrical double layer” [2]. The movement of ions to the adjacent of
electrode surface causes changes in the potential field and this factor is indispensable
1.1.2
The Electrical Double Layer
Supposed that there shall be no electron transfer occurring at the interface of the
elecrode and the solution. In other words, no chemical changes take place and so no
faradaic current passes. Such an electrode is called ideally polarized electrode as there
is no electrode reactions can occur within a certain range of potential values [3].
Ideally polarized electrode behaves like a capacitor and only capacitive current flows
upon a change of potential. A lot of electrodes posses this kind of characteristic but
only within an electrode potential range called the double-layer range.
As mentioned previously, if a potential is applied to an electrode immersed in a
solution, the electrode surface will become charged. The amount of charge on the
electrode surface is proportional to the electrode material, the electrolyte and potential
applied. If the potential applied is negative, then the electron will flow into the surface
eventually turning the surface to be negatively charged. In an opposite way, if the
applied potential is positive, electron will move out of the surface, gradually results in
it being positively charged. Accompanying this phenomenon is the rational that for
every electrode/electrolyte combination, there must be a potential whereby the surface
shall be neutrally charged. This potential is called zero charge, Epzc. The surface
charge on the electrode is in fact balanced by the movement of counter ions from the
bulk solution.
Extending the argument above, whenever the electrode potential is negative to Epzc, its
charged thus inviting anions and dipoles to its adjacent. It shall be noted that in this
case, the orientation of the dipoles will be reversed. Either way, there shall be an
organized layer consists of cations or anions formed very close to the electrode
surface resulting from the potential changes. It shall also be stated that the higher
value the applied potential is, the stronger the electrostatic forces produced. As a
matter of fact, competition for sites on the electrode surface does exist between the
ions and water dipoles in order to form a well organized double layer. An example of
the formation of double layer is depicted in Figure 1 [1].
Thus when the potential of an electrode in an aqueous electrolyte is negative to Epzc,
its surface will be negatively charged and both cations and dipoles, particularly water
molecules, will be attracted to the surface. Moreover, the more negative the applied
potential, the stronger are the electrostatic forces leading to the formation of an
organized layer of cations adjacent to the electrode surface. Conversely, positive to
Epzc, the electrode surface will be positively charged and it is anions and dipoles
which are attracted (note, the orientation of the dipole will be reversed). In practice,
there will be competition between the ions and water dipoles for sites on the surface
and the electrostatic forces leading to a totally organized structure are opposed by the
thermal motion of the ions. Figure 1.1 shows the generally accepted model for the
Figure 1.1 Model of electrical double layer at the interfacial region at the electrode
surface for potentials negative to the potential of zero charge [1].
1.1.3
Charging Currents
It was stated that any change in the potential of an electrode is the driving force of
change in the charge on the metal side of the electrode surface. Coupled to this, ions
and dipoles reorganization will also occur in the double layer on the solution side.
Changing the potential of the electrode means that there will be electron flowing into
or out of the electrode. In practice, these electrons will eventually pass out through the
Charging current is additional to the Faradaic current, which comes from the reactive
species in the cell. Its presence is always regarded as “noise” as it complicates the
signals produced by the reaction desired in the particular experiment setup. It shall be
emphasized that the effect of charging current is only a minor problem for short
timescale experiments as reorganization of double layer according to the potential
change occurs very fast and, once the new structure has been formed the charging
current effect can be totally neglected [1].
For example, in linear potential sweep or cyclic voltammetric experiment, the
charging current may be estimated from equation 1. A typical value of capacitance is
0.2 F m-2 so that at scan rates of 0.1 and 100 V s-1 the observed capacitive current
density jcap = 0.02 and 20 A m-2, respectively.
C
jcap
(1.1)
The current density is given by equation 1.1. Here C is the capacitance and ν is the
potential scan rate. The capacitive current at high scan rate commonly is of the same
order of magnitude or higher compared to the Faradaic current for a diffusion
1.2.
Electrode Kinetics
An example of a reduction for a cation can be taken from Figure 1.1. In order for the
electron transfer to occur at a potential negative to Epzc, the cation must be as close as
possible to the electrode. Let’s say it has to sit on the plane of closest approach. It is
important to note that whether or not the electron transfer occurs at the interface, the
structure and properties of the double layer remains the same. Also, it shall be
emphasized that the resulting structure as well as the behaviour of the double layer
originates from the electrostatic effect, not chemical. For these reasons, in a system
where the electroactive species exist in a large excess of inert electrolyte, it will solely
the ions which will determine the characteristics of the double layer. In practice, the
effect of double layer is always minimized by using inert electrolyte.
To understand the the electrode kinetics, consider a reduction process for
hexacyanoferrate(III) to hexacyanoferrate(II) in a solution using an electrode surface
area of A cm2, with a suitable negative potential applied [4].
CN aq e Fe II
CN aqIII
Fe 46 3
6 ( )
)
( (1.2)
In order for electron transfer to occur between two phases (metal/solution), the
electroative species, Fe(CN)63- has to be as close as 10-20 Å from the electrode
surface. Reduction of the Fe(CN)63- anion is only possible if it diffuses within this
The movement of electron in return creates the current which flows through the
electrode and external circuit. The relationship between the current generated from the
electron transfer can be shown as below.
FAj
i (1.3)
F = Faraday constant
A = electrode surface area
j = flux of reactant undergoing electrolysis
Figure 1.2 Diffusion process of Fe(CN)63- to the electrode from bulk to solution [5].
Here, the flux can be best described as the rate of the heterogeneous reaction at the
electrode interface. The unit is mol cm-2 s-1, and is measured the same way for
reac t
dt dj tan / (1.4)
The flux for a heterogenous reaction at the electrode-solution interface can be written
as:
0tant n reac n k
j (1.5)
Where n is the rate order of the reactant, k(n) is a nth order rate constant and the
subscript represents the concentration of reactant at the electrode surface, which
implies the minimum electron tunnelling distance. As far as the equation 1.5 is
concerned, there are three main considerations that shall be emphasized.
Figure 1.3 Qualitative representation of the charge, ρ, and potential, Ø, as a function
Firstly, it is very significant to point here that for a first order heterogeneous reaction,
n is always equal to 1, and this makes the unit for k(1) are in cm s-1. In contrast to the
first order homogeneous reaction, which differs only in s-1 in dimensions. Secondly,
the concentration of the electroactive species where the electron transfer occurs, the ψ
–plane, is not the same as in bulk solution. The concentration of at the ψ-plane may be
lower, the same, or higher than that of the bulk solution depending whether the
electroactive species are cations or anions, or whether the applied potential is positive
or negative to the Epzc. Thirdly, it goes without telling that temperature and pressure
are two important parameters in determining the heterogeneous rate constant as well
as in homogeneous reactions, but the most critical point of all for interfacial reactions
is the applied potential. The driving force for electron transfer relies on the potential
difference between the electrode and the ψ2-plane, ψm-ψ2, rather than the full
potential difference across the interface, ψm-ψs [1] (see Figure 1.3). The phenomenon
of loss of the driving force from the applied potential is called iR drop and it is a
dynamic process dependent on the flow of current which is causing further imbalance
in the charge distribution across the electrode – solution interface.
1.3.
Adsorption at Electrode Surfaces
Adsorption is the binding of species from the solution phase to the electrode surface.
The adsorbates may be atoms, ions, molecules, reactant, intermediate, or product of
the electrode reaction regardless of whether they are organic or inorganic in their
nature. Whatever they are, adsorbates do affect the reaction rate as well as the
mechanism involved at the electrode of interest. Adsorption of both organic and
electrode surface and in variety of environments. For instance, consider a covalent
bond formed at the electrode surface for the next following reactions, e.g.
H -Pt Pt e
H+ - (1.6)
H -Pt H CH -Pt 2Pt OH
CH3 2
(1.7)
In addition to covalent bonding-based technique, adsorption can also occur by means
of electrostatic forces. This can be achieved if the electrode surface is electrostatically
charged with either positive or negative which eventually attracts ions or dipoles with
opposite charge to it. The accumulation species with counter charge enable adsorption
via electrostatic method to be achieved. An example of a reversible adsorption
process is shown in equation (1.6), meanwhile an irreversible one can be represented
as shown in equation (1.7) [1]. Feasibility to adsorb electroactive species of interest
from solution onto the electrode surface at open circuit is a great plus, but one can
always vary the surface charge simply by varying the electrical potential applied to
the electrode surface. Generating a positively or negatively charged electrode surface
is also a very simple process as it only requires the application of required potential to
the electrode of interest.
1.4.
Mass Transport
The supply of reactant and removal of product to / from the electrode surface are
surface. Generally, there are three different modes of transportations, diffusion,
convection, and migration.
Diffusion. In nature the difference of concentration between two points in a solution
normally ends up with a movement of a more concentrated species to the area of the
less. This will last until the concentration between them reaches equality. This
phenomenon which originates from the concentration gradient is called diffusion [1].
Diffusion plays an important role when considering a reaction an electrode. Very
often, the electron transfer process occurs at the vicinity of an electrode. For example,
when a species O undergo a reduction process at a considerable rate to become R at
the electrode, in theory it shall be considered that the concentration of the former at
the electrode surface is lower than at the bulk solution. In other words, the
concentration of the reduced species R at the electrode surface will be higher than in
the bulk solution. Fick’s first law defines diffusion as diffusional flux which
represents the number of moles diffusing per unit area (see Eq 1.8). Fick then derived
his second law which applies to cases whereas the change of concentration within a
specific area is thought (see Eq 1.9) [6]. In these equations, jox is the flux, D is the
diffusion coefficient, [Ox] is the concentration of the species, and x is the distance of
the species from the electrode surface.
x Ox D jox oxIn most of the electrochemical measurements where the oxidation and reduction of
active species due to the applied electrical potential are concerned, the Fick’s second
law is more preferable as both former processes always result in changes of
concentration at the electrode surface with the elapse of time.
Convection. The presence of thermal gradient or difference in density within a
solution can lead to another form of mass transport namely convection. Convection
may occur in nature or deliberately induced by means of applying external forces such
as shaking or sparging the solution in the electrochemical cell where the electrode
reaction is considered. In general, in an unstirred solution, convection is always
caused by the chemical reaction at the adjacent of electrode surface which probably
generates slight changes in density or even temperature. Meanwhile, unnatural
convection is always considered as unfavourable as these changes eventually induce
the movement within the cell solution. Very often, in electrochemical experiments,
convection can be controlled by flowing the electrolyte solution over the electrode
surface at a known rate or by the usage of rotating disc electrode [4].
Migration. Migration by definition is a form of mass transport which originates from
the potential gradient induced by the movement of charged species such as ions in the
electrochemical cells. As in all electrochemical experiments, the application of
electrical voltages between electrodes which generates the passing of current between
the former involves the creation of potential drop at the electrode | electrolyte solution
reactions. To overcome this problem, very often the addition or usage of supporting
electrolyte solution to the electroactive solution is a common practice as it helps
minimizing the effect of migration. It shall be noted that although the reactant or
product in the electrode cell may be charged species, with the presence of excess
electrolyte solution, they will be enclosed by the ions of the supporting electrolyte
solution, therefore these ions are the charged species which moves, not the
electroactive themselves [1].
1.5. Voltammetric Techniques
1.5.1 Electrochemical Experimental Considerations
Electrochemistry is the study of electron transfer reactions between electrodes and
reactant molecules, usually, and as this report is concerned, in the solution phase. In
this work particularly, techniques used for the study of these reactions include linear
sweep voltammetry, cyclic voltammetry and potential step voltammetry. There are
many experimental set ups that can be used to carry out these measurements but the
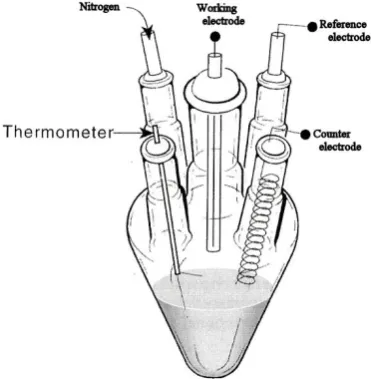
most common used is the three electrode cell. This involves placing the working
electrode, reference electrode counter electrode into a cell containing a solution of the
redox system under investigation and an inert background electrolyte. The solution is
purged of oxygen with nitrogen or argon gas and the experiment is controlled using a
potentiostat and personal computer.
Figure 1.5 Standard electrochemical cell consisting of three electrodes, reference
The most important part when conducting voltammetric measurements is the
apparatus, called potentiostat. It acts as a potential provider to the electrochemical cell
and gives out the resulting flowing current. The output of a voltammetric scan is
called voltammogram, which shows the relationship between the applied potential and
the current produced. Modern potentiostats in general employ a three-electrode setup
as shown in Figure 1.5.
Typically, the potential difference is applied between a reference electrode and a
working electrode. Since that electron transfer occurs at the working electrode, it is of
vital importance so as to ensure that consistent measurements between the former
electrode is possible, thus the counter electrode is then introduced into the cell.
However, two-electrode experimental system is possible only when the conducting
current is low. In this case, counter electrode is not needed and experiments can be
performed using only the reference electrode and working electrode.
There are varieties of working electrodes available depending on the experimental
purposes. As far as this investigation is concerned, the working electrodes include
bare glassy carbon electrode, modified basal plane pyrolitic (bppg) electrodes (with
metallophtalocyanine groups and TODAQ), and modified ITO electrodes (with
nanoparticles and DNA strands).
The simplest counter electrode (used in this investigation) is normally composed of a
piece of platinum wire with a large surface area, and often immersed directly into the
cell solution during measurements. The reason for having a reasonable large area
circuit. Supposed that current resulting from a reduction process takes place at the
working electrode, to balance out, an oxidation process then will occur at the counter
electrode and vice versa. In large scale experimental setups where measurements are
taken over a long timescale, accumulation of products at the counter electrode may
happen. To circumvent this problem, salt bridges are sometimes used.
A reference electrode is essential as it provides a stable potential base relative to the
working electrode of interest. Some of the mostly used reference electrodes may
include the followings:
(a) Standard hydrogen electrode (SHE)
Pt | H2(g) , H+(aq)
(b) Saturated calomel electrode (SCE) (used in this investigation)
Hg | Hg2Cl2 (s), KCl (aq)
(c) Silver-silver chloride electrode
Ag |AgCl (s), KCl(aq)
With the potential of 0 V at all temperatures, it may sound very convenient to use
SHE electrode in experiments. However, SHE is prone to physical poisoning and
cannot be used in solutions which contain redox species, making it unsuitable for
as saturated calomel electrode (SCE) and silver-silver chloride electrode are more
stable for long timescale experiments.
Very often that solutions, which can be defined as a mixture of conducting electrolyte
and the electroactive species, are used as solvent in electrochemical experiments.
Vase majority of electrochemical setups use water as a solvent, while other options
include organic based solvents are also common. The bottom line when selecting a
solvent for a particular experiment is to ensure that it does not allow high
concentration of electrolyte solution to be formed to obtain a solution with a
reasonable conductivity. Another important aspect to consider would be its
compatibility with chemistry that occurs at the electrode surface and that the reactants
for the electrode process has an acceptable level of solubility required for the reaction
of interest.
Addition of supporting electrolytes with high degree of ionization is essential so as to
provide sufficient conductivity of the solution. Increasing amount of electrolytes
makes the solution less resistive, in other words, facilitates the flowing of current
occurring from the interfacial electrode process. It is also vital to keep the
electrode-solution distance so that the potential drop shall be maintained in the range of 10-20 Å
to allow smooth electron tunnelling as well as to avoid from the migration effect in
the solution. Presence of additional supporting electrolytes also helps in keeping the
ionic strength constant throughout the electrolysis. This is because of the relatively
high concentration of supporting electrolytes to reactants and products. It also
contributes in holding the activity coefficients for both reactants and product equal so
Most fundamental setups in electrochemical cell are designed with an inert gas
inlet/outlet. This is required so as to minimize the interference of signals from oxygen
molecules during experiments. Nitrogen gas and argon gas are two most well-known
examples of inert gas. Nitrogen is always preferred for its low cost, while argon
sometimes is another option as it is heavier than air.
1.5.2.
Equilibrium Conditions
The simplest electrochemical measurement can be made when equilibrium is reached
between a metallic electrode (m) and a redox active species in an aqueous solution
phase (aq). For a general one electron transfer process the following equation can be
written:
aq e
m R
aqO - (1.10)
Where the oxidized species O can be reduced at the electrode surface to the species R
(or vice versa). As the reaction involves the transfer of an electron between two
distinct phases and as the reaction moves towards equilibrium, a net charge separation
occurs between the electrode and the solution. This charge separation creates a
potential difference at the electrode-solution interface.
The potential difference is fixed for a particular system providing no current is passed
convention has a potential difference of zero. Since no current is drawn through the
cell, the equilibrium potential reached is dependent on the relative concentrations of
the species O and R. Nernst1 showed that for a particular system the equilibrium
potential, Eeqm, could be calculated from equation 1.11.
] [
] [ ln
0
R O F RT E Eeqm
(1.11)
Here E0 is the standard electrode potential, R is the gas constant, T is the absolute
temperature, n the number of electrons transferred per molecule, F is the Faraday
constant, and [O]/[R] the concentration ratio of the species at the electrode surface,
which under equilibrium conditions is the same as the bulk. From equilibrium
measurements thermodynamics parameters such as free energies, entropies, enthalpies
and equilibrium constants can be calculated for the system.
1.5.3.
Nernst Equation
Most of reactions in electrochemistry will involve heterogeneous electron transfer
between the working electrode and the redox active species in the solution. Normally
the redox active species will have to diffuse towards the electrode surface, and once it
is in the electrode surface region, the redox form will be subject to either
homogeneous or heterogeneous chemical reactions that may be accompanied by the
electron transfer. If the electron transfer rate is extremely fast relative to the mass
Under this condition, the ratio concentrations of oxidized and reduced forms of the
redox couple can be described by so-called Nernst equation.
In electrochemical measurements, energy is being supplied in the form of electrical
voltage. This energy source is the driving force of all possible chemical reactions. In
redox reactions, the movement of charged particles (may be electrons or ions) always
give rise to potential difference between the electrode and the solution. The maximum
potential difference is called the electromotive force (EMF), E, and the maximum
electric work W is the product of charge, q, in Coulomb (C), and the potential ∆E in
Volt (J/C).
J q EW (1.12)
Since that the Gibbs free energy,G, takes the opposite sign of the maximum electric
work, it can be written as
E q -W
G
(1.13
In a redox reaction, definite amounts of reactants and products are clearly stated. The
number of electrons taking place in the reaction is also proportional to the amount of
charge transferred in order to complete the reaction. The Faraday constant, F, defines
and,
E -nF
G
(1.15)
At standard conditions, the Gibbs free energy can be written as
0 0
E -nF
G
(1.166)
The Nernst equation represents the correlation between the Gibb’s Free Energy and
EMF in a chemical reaction or also known as the galvanic cell. Consider a reaction
scheme below dD cC bB
aA (1.17)
As changes in Gibb’s Free Energy, G, can be shown as
RTlnQ
G 0
G (1.18)
and
a bd c B A D C Q (1.19)
Q RTln G
E -nF
G 0
(1.19
Therefore Q RT E nF ln E nF
- 0 (1.20)
Thus, the above equation can be re-written as
a bd c o B A D C nF RT E
E ln
(1.21
In a simple reaction as shown in equation 8, the above Nernst equation can be
simplified as
O R nF RT EE o ln
(1.22
or
R O nF RT EE o ln
(1.23
At equilibrium, ∆E = 0, to result in
O R nF RT EEeqm o ln
(1.25
It shall be emphasized that when the electron transfer rate is too small relative to the
mass transfer rate, the observed current will not be a function of the mass transport. In
such case, the Nernst equation is no longer applicable.
1.5.4.
Electrolysis
Electrochemical cells can be operated under conditions where a current flows and this
is achieved by applying a potential that is different to Eqm. The current induces the
exchange of electrons between the electrode and molecule in solution. This can
happen in either direction so that O is reduced to R:
aq e
m R
aqO - (1.27)
or so that R can be oxidized to O:
aq O
aq e mR - (1.28)
AFj
I (1.26
Here A is the area electrode, F is the Faraday constant and j is the flux of electroactive
species reaching the electrode surface. The flux, j, in turn is related to the
concentration of the reactant at the electrode surface, [O]0, and also the heterogeneous
rate constant, k0, for the electrochemical reaction (see equation 1.30).
0 0O
jk (1.30)
The heterogeneous rate for the transfer of an electron may depend on several steps of
the reaction. This includes the concentration of the reactant species O at the electrode
surface, which is different from that in the bulk and depends on the method of mass
transport taking place in the cell. These typically are diffusion, convection and
migration and need to be taken into account in an experiment or eliminated as much
as possible by stirring or by using the rotating disc electrode. The electron transfer
step is a quantum-mechanical tunnelling process. Similarly to chemical reactions the
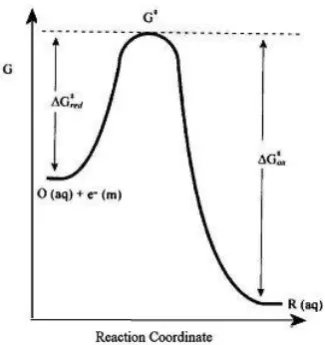
transition state model can be used to describe the electron transfer, where there action
Figure 1.6 Free energy plot for a one-electron reduction of O(aq).
In Figure 1.6 electron transfer is possible when the transition state is reached and the
rate determining step is linked to the vibrational reorganisation of the system
including redox active molecule and solvent shell [7]. The heterogeneous standard
rate constant for electron transfer, kred, is predicted as shown in equation 1.31.
RT G A
k red red
*
exp
(1.27
∆G*
red is the free energy of activation and A is a frequency factor to account for the
number of collisions of the molecules with the electrode. Importantly the rate constant
for both cases can, in turn, be controlled but the electrical potential applied to the
system and more accurately the over potential are required for the reaction to take
1.5.5.
Overpotential and Energy Levels
A pure crystal contains a lattice of closely packed atoms whose atomic orbitals will all
be of a similar energy and so overlap. Instead of considering them as discrete energy
levels, the orbitals can be thought of as bands; the valence band which is analogous to
the HOMO and the conductance band which can be thought of as the LUMO. In a
metal there is no gap between the valence and conductance and so the bands overlap
and electrons can move freely through the metal. The level of the band up to which
electrons occupy is called the Fermi level and an electrical potential applied to a metal
acts to increase or decrease the energy of the Fermi level.
For an electron transfer to occur between the electrode and species O, the Fermi level
must be higher than LUMO of the species O. In the figure below, the Fermi level is
below the LUMO and so the process is unfavourable and reduction does not occur.
However, if the Fermi level in the metal is raised by the application of a negative
electrical potential to above the LUMO of O, the electron transfer becomes
favourable. The electrical potential that must be applied to a system, above Eeqm, in
Figure 1.7 Representation of electronic energy levels when (a) the Fermi level is too low for electron transfer to occur and (b) at a level where the electron transfer process becomes favourable.
1.5.6.
Cyclic Voltammetry
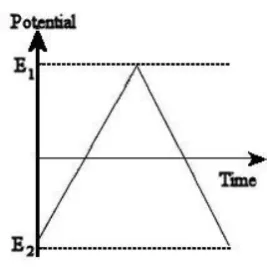
Linear sweep voltammetry works simply by changing the potential of the working
electrode from a set value of E2 to E1 usually from a situation where electron transfer
does not occur to one where it is driven rapidly. As the change in potential is set over
a specific time, then it is a measurement of the change in current over both a potential
and time range.
Meanwhile, cyclic voltammetry (CV) is an extension of linear sweep voltammetry so
that once E2 is reached, the direction of the sweep is reversed and the electrode
potential is scanned back to E1. CV has become an important and widely used
electroanalytical technique in many areas of chemistry. It is rarely used for
quantitative determinations, but it is widely used for the study of redox processes, for
understanding reaction intermediates, and for obtaining stability of reaction products.
This technique is based on varying the applied potential at a working electrode in both
forward and reverse directions (at some scan rate) while monitoring the current. For
example, the initial scan could be in the negative direction to the switching potential.
At that point the scan would be reversed and run in the positive direction. Depending
on the analysis, one full cycle, a partial cycle, or a series of cycles can be performed.
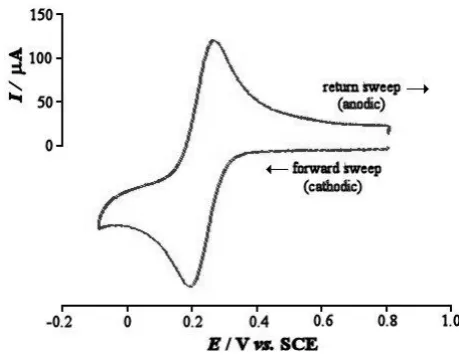
The response obtained from a CV can be very simple, as shown in Figure 1.9 for the
reversible redox system:
A stationary working electrode, usually a platinum disc, in an unstirred solution is
employed, and the potential is varied at a finite rate as a linear function of time.
Typical sweep rates are in the range of 0.5 - 100 V s-1, and the current potential curves
no longer have the S-shape known from techniques with infinitesimally small sweep
rates, but exhibit peaks. If a rapid triangular sweep is applied, and an oscilloscope or a
fast x-y recorder is used a cyclic voltammogram is obtained. If, for example, the
sweep towards lower potentials produces reduced molecules in the vicinity of the
electrode, then they are re-oxidized during the reverse sweep to the same
concentration which was initially present in the solution, provided that the rate at
which the potential is taken back to its initial value is more rapid than the diffusion
processes needed to establish equilibrium with the bulk of the solution. If the reduced
species undergoes irreversible secondary reactions in a shorter period than that of
triangular sweep, then new waves may be found in the reverse sweep and the height
of the wave corresponding to the forward reaction is reduced.
The peak current ip in this voltammogram is given by Randles-Sevcik equation (1.28).
5
3/2 1/2 1/2Cp 2.69 10 n AD
i (1.28)
Here ip is the peak current (in amperes), n is the number of electrons passed per
molecule of analyte oxidized or reduced, A is the electrode area (in cm2), D is the
diffusion coefficient of analyte (in cm2 s-1), ν is the potential sweep rate (in V s-1), and
2 ox red mid E E E
(1.28
The midpoint potential Emid can written as shown in equation 1.33. Here, Ered is the
reduction potential, Eox is the oxidation potential, and n is the number of electrons
transferred per molecule.
The maximum potential Ep in the current-potential curve in the linear scan
voltammetric experiment for a reversible one-electron transfer is given by equation
1.34.
n E
Ep 1/2 28.5
mV at 25°C (1.29
Finally, the separation between the two peaks of the voltammogram is given by
C) 25 (at mV/n 59 2.4RTnF E -E
Ep ox red o
(1.30
Hence, depending on what is already known about a given system, one could
determine the concentration, the diffusion coefficient, the number of electrons per
molecule of analyte oxidized or reduced, and/or the redox potential for the analyte, all
sweep starts at less than 100 mV/n cathodic of the reduction peak. If the switching
potential however, is set further apart, the separation of the two peaks will be 57
mV/n and is independent of the scan rate of the potential scan. These two criterion,
together with the equal height of the steps in the forward and reverse reactions, are
commonly taken as diagnostic for reversible, purely diffusion controlled charge
transfer, and cyclic voltammetry has been used simply to obtain potentials which
could also have been measured by slow techniques, and at the same time to
demonstrate reversibility of the electron transfers.
If the scan rate in cyclic voltammetry is increased to values greater than 0.1 V s-1, then
the redox couples do not behave like ideal reversible systems because electron
transfer rates are not infinitely large and the current is controlled by a mixture of
diffusion and charge transfer kinetics. This is called the quasi-reversible case and
cyclic at varying scan rates can be used to measure electron transfer rates. Detailed
discussion on the reversibility in electrochemical measurement will be presented in
the later section.
1.5.7.
Reversible and Irreversible Reactions
The term reversible is always misunderstood and sometimes can be confusing in
chemistry as it has two different meanings depending on the context of the reaction.
In general reversibility can be divided into two categories; chemical and
electrochemical.
O + ne- ↔ R (1.36)
The reaction scheme shows that the reactant, in the reduced form, is being
transformed into a product by means of having an n number of electron on the time
scale of the voltammetric experiment. From the chemical point of view, this Ox/Red
couple can be reproduced chemically as represented by the double-sided arrow.
Therefore the oxidation reaction can then be expressed as
R ↔ O + ne- (1.37)
Meanwhile, the heterogeneous process taking place between a metal working
electrode and an electroactive species at the vicinity of the electrode surface results in
electron transfer. In electrochemical experiments, electron transfer can be affected by
the potential applied and the concentration of the electroctive species at the electrode.
Therefore the rate constants play very important role in determining the
electrochemical reversibility of a reaction.
Using the same chemically reversible reaction scheme above, electrochemical
reversibility can be explained the following way. Supposed that the rate constants for
reduction and oxidation as kred and kox respectively.
cm s-1, derived from the concentration of electroactive species shown in mol cm-3 and
electron transfer to the electrode surface with surface area in cm2. Here rate constant
for electron transfer in both forward and backward direction of the above reaction
scheme can be represented in the following manner
RT nFE k k red red exp 0 (1.31 RT nFE k k ox red ox exp (1.40)
Here the rate constants for both reduction and oxidation processes driven by the
potential difference or overpotential, η = E –E0, from the applied electrical potential, E,
can be shown by
RT E E nF k k red red 0 0 exp (1.41)
RT E E nF k k OX ox 0 0 exp (1.42)ko is the rate constant at the electrode surface at equilibrium, αred is the cathodic
transfer coefficient, αox is the anodic transfer coefficient, and R is the gas constant
(8.314 (V C) / (mol K)). α is defined as the fraction of the interfacial potential at an
Another way to derive the equation of standard electrochemical rate constant is by
comparing the equation representing the diffusion layer, δdiffusion, with that of the
reaction layer, δreaction. The reaction layer, δreaction, is best described as the diffusion
layer at a particular scan rate of interest .
diffusion D
(1.43) 0 k D reaction (1.44)
It shall be noted that at the transition point, from reversible to irreversible condition,
the thickness of the diffusion layer and the reaction layer is equal. Therefore,
D k D 0 (1.32
If a constant RT/F is multiplied to both sides of the equations,
F DRT k D 0 (1.33 To give F D
It shall be noted that under room temperature the diffusion coefficient shall take the
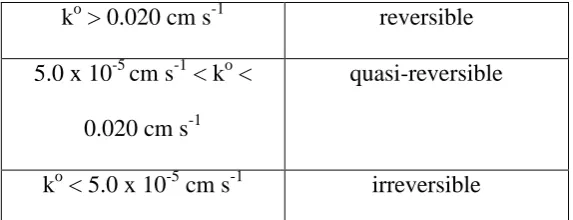
value of D = 10-9 m2 s-1. Based on the equation 1.47, by substituting various values of
potential scan rates, the corresponding k0 can be determined accordingly. The
following table can be used in dictating the electrochemical reversibility.
ko > 0.020 cm s-1 reversible
5.0 x 10⁻⁵ cm s-1 < ko <
0.020 cm s-1
quasi-reversible
ko < 5.0 x 10⁻⁵ cm s-1 irreversible
Table 1 Dictation of electrochemical reversibility of a reaction.
Although electrochemically reversibility of reaction can be determined from the
above figures, it is also very useful to use a more practical approach when cyclic
voltammetric experiments are conducted in the laboratory. This method has proven to
be extremely helpful when voltammetric responses are being measured within a wide
range of scan rates as it is a common practice to record voltammograms over a wide
potential window so as to determine the reversibility of a reaction. In practice, there
are three parameters which can be used.
(a)Peak to peak separation, ∆Epp.
In a reversible voltammogram, the magnitude of the peak to peak separation, ∆Epp,
shall be approximately 57 mV at room temperature ( 298 K) regardless of scan rate
values. On the contrary, in the case of quasi- and irreversible conditions, the ∆Epp will
b) Peak current, Ip.
In both reversible and irreversible conditions, the peak current generated is always
proportional to the square root of the scan rate values. However, as for
quasi-reversible, scan rate does not hold any effects. At room temperature (at 298 K) a
simple one electron reduction of O to R can be simplified by
Reversible
RT FD O FAIp 0.446 bulk
(1.35
Obulk AD1/25 10 69 .
2
(1.36
Irreversible
RT FD O FA Ip bulk 49 . 0 (1.50)
D ObulkA
2 / 1 5 10 99 . 2
(1.51)
It shall be noted that under room temperature as for the parameters involved, these
following assumptions shall apply; electrode surface area, A = 1 cm2, concentration of
species O, [O] = 10-3 M, charge transfer coefficient, α = β = 0.5 cm s-1, diffusion
c) Waveshape of the forward peak.
The difference between the peak current potential, Ep, and half peak current potential,
E1/2 , can come in handy when distinguishing a reversible voltammetric signal from an
irreversible one as shown below. All the values for the parameters used in the
equations correspond to those of at room temperature (at 298 K).
Under reversible condition,
F RT E
Ep 1/2 2.218
(1.52)
whereas under irreversible reduction
F RT E
Ep 1/2 1.857
(1.53)
or
mV E
Ep
7 . 44 2 / 1 (1.54)
and under irreversible oxidation
F1.5.8.
Differential Pulse Voltammetry
The characteristics of the linear sweep and cyclic voltammetric methods hitherto
discussed in the previous section has revealed that they are very useful analytical tools
in electrochemical measurements as the maximum current flowing resulting from the
electroactive species in the solution is proportional to its concentration, thus a very
sensitive electroanalytical method. A close relationship between current and
concentration gives quantitative information on the system studied and this can be
clearly seen if diffusion controls the current magnitude. Although sensitivity-wise,
they are undeniably a superior method, it lacks the ability to distinguish between
faradaic and capacitive currents thus there is a need for complimentary method to
complete the relevant information of interest.
Meanwhile, in differential pulse voltammetry, DPV, fixed voltage pulses are
superimposed on a linear potential ramp and are applied to the working electrode at a
period of selected time just before the potential pulse drops. The current will be
measured twice, which first at a point just before the pulse is being imposed, and then
again just before the pulse begins to drop. The interesting point in DPV is that when a
potential pulse is applied to an electrode, the capacitive current flows proportionally
to it, but decays exponentially with time. The magnitude of the faradaic current, on
the other hand, decreases as an exponential function versus (t)1/2.
Figure 1.10 shows a typical diagram on how potential pulses, approximately for 50
peaks which are in direct proportion with the concentration of the electroactive
species of interest.
Figure 1.10 Excitation signal for differential–pulse voltammetry.
In DPV, the charging current contribution is so small, about more than an order of
magnitude than that of normal-pulse voltammetry, that it is negligible. Conversely,
the Faradaic current decays accordingly to the square root of time, producing an
excellent signal to noise ratio. Due to these significantly enhanced characteristics,
DPV enables the detection at a nano-molar level (1 μg L-1) thus proving hugely useful
in electrochemical sensing applications.
1.5.9.
Ion Transfer at Triple Phase Boundary (TPB)
A phase boundary is created whenever two or more immiscible phases are brought to
contact with each other. As a simple case, if a hydrophobic phase is brought close to a
hydrophilic phase, a phase boundary represented as liquid | liquid is said to be formed.
In a more advanced situation, when a solid phase electrode is placed into a liquid |
liquid | liquid interface is created, while Figure 1.11B illustrates the formation of a
TPB.
Figure 1.11Schematic showing (A) a conventional liquid | liquid interface and (B) a liquid | liquid | solid interface, forming a triple phase boundary [8].
A study of the electrode processes occur at the TPB was studied by Marken et al.
where a microdroplets of a very higly water insoluble
N,N,N,N-tetrahexylphenylenediamine (THPD) is deposited onto a solid electrode and then
completed immersed in a aqueous solution consists of totally supporting electrolyte.
In this study, the electrode potential was first scanned in a selected potential window
(0 to 0.6 V), followed by a visual inspection of the electrode by a microscope. It was
observed that a formation coloured ring-like area was confirmed at the TPB. Further
investigation by chemical microanalysis disclosed the fact that during the oxidation of
THPD, the anions have to move across the liquid | liquid phase boundary and forcedly
transported into the organic phase microdroplets (see Figure 1.12b). When the
and pH in the aqueous phase helps to understand the tell-tale shift in the oxidation
potential [10]. The potential shift due to the different types of anions is mainly caused
by the Gibbs energy of ion transfer (required energy for anion to cross liquid | liquid
phase boundary), while the effect of different pH values explains the applicability of
Nernst equation when a transition from an anion exchange to proton exchange is
considered [Error! Bookmark not defined.].
Figure 1.12 Schematic of (a) an oil droplet forming a three-phase junction with an aqueous phase and the electrode; (b) an oxidation process within the droplet, triggering anion transfer from the aqueous into the oil phase; (c) the reverse reduction process, triggering the expulsion of anions into the aqueous phase.
The oxidation of the microdroplets causes the organic phase to possess positive
charge, and to balance this out, anions needs to move into the organic from the
(liquid | liquid and solid | liquid interfaces). Ball et al. proposed that convection partly
contributes in maintaining an effective charge transfer at these interfaces [11].
The study of electrochemically driven ion transfer at the TPB has developed a lot in
recent years and proven to be a very useful tool especially in elucidating the
biological and physiological processes. A compilation of Gibbs free energies
measured at the TPB for anions such as amino acids [12], oligo-peptides [13], anionic
drugs [14], and cations [15] revealed voltammetric is a reliable method in providing
these information.
A combination of having organic microdroplets and a TPB makes it feasible for the
study of ion exchange processes to be carried out without the usage of electrolyte to
provide for electrical conductivity as electron transfer can take place at the electrode |
organic | aqueous electrolyte interface. In Chapter 3 and Chapter 4, the concept of
TPB and formation of organic phase microdroplets is exploited.
In Chapter 3, this technique is used to study electrochemical processes for a novel
system, microdroplets of 4-(3-phenylpropyl)pyridine (PPP) containing an
electroactive MPc is immobilized at basal pyrolytic graphite (bppg) electrode. The
organic solvent PPP is non-volatile, highly water immiscible, and a suitable medium
for water insoluble transition metal complexes such as those of phthalocyanines.
Altogether, a simple quantitative CO2 detection will be shown. Meanwhile, in Chapter
1.6.
Surface Characterization Techniques
1.6.1.
Scanning Electron Microscopy (SEM)
Scanning Electron Microscopy (SEM) was first commercially invented in the 1960’s.
It is an imaging technique used to determine topological structure particularly that of
sample surfaces. SEM gained its popularity due to its ability to produce images with
resolution in the 10 nm range, about 1000 times better than that of any other optical
microscope. Figure 1.13 shows a schematic of a typical SEM.
The basic operating scheme of an SEM can be illustrated as shown in Figure 1.13. At
the electron gun, high energy electron beam of typically 10 keV are generated. The
electron gun is normally made of a tungsten filament of where a massive magnitude
of current is flown through it. The filament is heated up to around 2700 K so that the
thermionic emission temperature is reached. In a Field Emission Gun (FEGSEM),
instead of tungsten filament, a sharply-pointed single crystal tungsten wire fabricated
by means of electrolytic etching method is used. Through the tunnelling effect, the
electrons are sent out from the FEG. This is achieved as the sharp tip contains a high
electric field around it enabling it to extract electrons out of the cathode. These
electrons then are passaged below the potential barrier. Unlike the tungsten, the FEG
cathode is at room temperature and requires clean vacuum environment .
Using a series of scan coils, a minute beam is produced from the emitted electrons
![Figure 1.1 Model of electrical double layer at the interfacial region at the electrode surface for potentials negative to the potential of zero charge [1]](https://thumb-us.123doks.com/thumbv2/123dok_us/1323995.1165286/18.595.172.421.67.414/figure-electrical-interfacial-electrode-surface-potentials-negative-potential.webp)
![Figure 1.2 Diffusion process of Fe(CN)63- to the electrode from bulk to solution [5]](https://thumb-us.123doks.com/thumbv2/123dok_us/1323995.1165286/21.595.191.421.320.548/figure-diffusion-process-fe-cn-electrode-bulk-solution.webp)
![Figure 1.3 Qualitative representation of the charge, ρ, and potential, Ø, as a function of distance from the surface resulting from the model of Figure 1.1 [1]](https://thumb-us.123doks.com/thumbv2/123dok_us/1323995.1165286/22.595.176.422.384.626/figure-qualitative-representation-potential-function-distance-surface-resulting.webp)
![Figure 1.4 Three different forms of mass transport for electroative species in solution to the electrode surface [4]](https://thumb-us.123doks.com/thumbv2/123dok_us/1323995.1165286/27.595.132.462.295.470/figure-different-transport-electroative-species-solution-electrode-surface.webp)