University of Windsor University of Windsor
Scholarship at UWindsor
Scholarship at UWindsor
Electronic Theses and Dissertations Theses, Dissertations, and Major Papers
11-7-2015
Development of a Tensile Split Hopkinson Pressure Bar Testing
Development of a Tensile Split Hopkinson Pressure Bar Testing
Facility
Facility
Kevin Young
University of Windsor
Follow this and additional works at: https://scholar.uwindsor.ca/etd
Recommended Citation Recommended Citation
Young, Kevin, "Development of a Tensile Split Hopkinson Pressure Bar Testing Facility" (2015). Electronic Theses and Dissertations. 5513.
https://scholar.uwindsor.ca/etd/5513
This online database contains the full-text of PhD dissertations and Masters’ theses of University of Windsor students from 1954 forward. These documents are made available for personal study and research purposes only, in accordance with the Canadian Copyright Act and the Creative Commons license—CC BY-NC-ND (Attribution, Non-Commercial, No Derivative Works). Under this license, works must always be attributed to the copyright holder (original author), cannot be used for any commercial purposes, and may not be altered. Any other use would require the permission of the copyright holder. Students may inquire about withdrawing their dissertation and/or thesis from this database. For additional inquiries, please contact the repository administrator via email
Development of a Tensile Split Hopkinson Pressure
Bar Testing Facility
By
Kevin Young
A Thesis
Submitted to the Faculty of Graduate Studies
through the Department of Mechanical, Automotive and Materials Engineering
in Partial Fulfillment of the Requirements for
the Degree of Master of Applied Science
at the University of Windsor
Windsor, Ontario, Canada
2015
Development of a Tensile Split Hopkinson Pressure Bar Testing Facility
by
Kevin Young
APPROVED BY:
______________________________________________ A. Alpas
Mechanical, Automotive, & Materials Engineering
______________________________________________ W. Altenhof
Mechanical, Automotive, & Materials Engineering
______________________________________________ D. Green, Advisor
Mechanical, Automotive, & Materials Engineering
iii
Declaration of Originality
I hereby certify that I am the sole author of this thesis and that no part of this thesis has been
published or submitted for publication.
I certify that, to the best of my knowledge, my thesis does not infringe upon anyone’s copyright
nor violate any proprietary rights and that any ideas, techniques, quotations, or any other
material from the work of other people included in my thesis, published or otherwise, are fully
acknowledged in accordance with the standard referencing practices. Furthermore, to the
extent that I have included copyrighted material that surpasses the bounds of fair dealing within
the meaning of the Canada Copyright Act, I certify that I have obtained a written permission
from the copyright owner(s) to include such material(s) in my thesis and have included copies of
such copyright clearances to my appendix.
I declare that this is a true copy of my thesis, including any final revisions, as approved by my
thesis committee and the Graduate Studies office, and that this thesis has not been submitted
iv
Abstract
This project consisted of designing and developing a split Hopkinson pressure bar (SHPB)
apparatus to perform tensile tests on metallic sheet materials at strain rates from 500 s-1 to
2000 s-1.
The mechanical components that were designed and built are: a gas gun, incident/transmission
bars and a momentum trap. A data acquisition system with two data acquisition cards with a
maximum sampling rate of up to60 MS/s was used. This apparatus was successfully assembled,
calibrated and tested. A software code was developed to post-process the experimental strain
data and determine the corresponding flow curves.
The accuracy of this tensile SHPB apparatus was demonstrated by testing DP600 sheet steel
specimens in the rolling, diagonal and transverse directions. When compared to published data
for the same sheet material tested in a different laboratory, the overall errors were found to be
v
Acknowledgements
I would like to thank Dr. Daniel Green for his continued support and guidance in completing this
project. He is a great professor to have as an advisor and mentor throughout my education at
the University of Windsor.
I would like to thank the members of my committee Dr. Ahmet Alpas and Dr. William Altenhof
for their suggestions and feedback throughout this project. Dr. William Altenhof was helpful
throughout the programming of the data acquisition system.
This project would not have been possible without the help and expertise of the technicians
Andy Jenner and Patrick Seguin. Both technicians were very accommodating and generous with
helping me when I was stuck. Andy was very helpful to discuss ideas about design and
manufacturability of the components for this projects tensile SHPB apparatus. His time involved
in manufacturing most of the pieces for this project is numerous and greatly appreciated.
Without Patrick the instrumentation would be much more costly and would have taken much
more time to implement. His vast knowledge in instrumentation is an invaluable resource to the
Engineering department.
The previous work of Luigi Zanettin from our capstone project was greatly appreciated in
vi
Table of Contents
Declaration of Originality ... iii
Abstract ... iv
Acknowledgements... v
List of Tables ... viii
List of Figures ... ix
List of Symbols ... xii
Chapter 1: Introduction ... 1
1.1 Background ... 1
1.2 Objectives of Project ... 2
1.3 Outline of the thesis ... 3
Chapter 2: Literature Review ... 4
2.1 Overview of high strain rate testing ... 4
2.2 SHPB Apparatus ... 4
2.2.1 History of the Hopkinson Pressure Bar ... 4
2.2.2 Compression SHPB ... 7
2.2.3 Types of Tensile SHPB ... 8
2.2.4 The development of direct acting tensile SHBP apparatus. ... 10
2.2.5 Exploring Other Tensile SHPB Apparatus Facilities ... 12
2.3 SHPB Theory ... 12
2.3.1 Stress waves in cylindrical bars ... 13
2.3.2 SHPB equations ... 13
2.3.3 SHPB Theory using Conservation of Energy ... 17
2.3.4 Striker Velocity ... 20
Chapter 3: Design, Construction, and Assembly of SHPB ... 23
3.1 Overview of a Tensile Split Hopkinson Pressure Bar Apparatus ... 23
3.2 Mechanical Components ... 24
3.2.1 Support Frame ... 24
3.2.2 Bar Holders ... 26
vii
3.2.4 Gas gun... 33
3.2.5 Momentum trap ... 39
3.2.6 Specimen design ... 40
3.2.7 Assembly and set-up mechanical components ... 42
3.3 Instrumentation ... 44
3.3.1 Strain gauges ... 44
3.3.2 Pressure Transducer ... 45
3.3.3 Striker Velocity ... 46
3.3.4 Start data acquisition signal ... 46
3.3.5 Data acquisition ... 47
3.3.6 Assembly and set-up electrical components ... 49
Chapter 4: Calibration, Operation and Data Analysis of a SHPB ... 53
4.1 Calibration of the gas guns velocity versus pressure ... 53
4.2 Calibration of the strain gauge output ... 56
4.3 Operating Procedure... 61
4.4 Signal processing ... 65
Chapter 5: Experimental testing of DP600 Sheet Steel ... 71
5.1 High strain Rate flow behaviour of DP600 sheet steel ... 71
5.1.1 Properties of DP600 sheet steel ... 71
5.1.2 SHPB tests on DP600 sheet steel ... 72
5.2 Comparison of experimental data to known data ... 82
Chapter 6: Conclusions and Recommendations ... 87
6.1 Conclusions ... 87
6.2 Recommendations for further improvement of the SHPB ... 88
References ... 90
Appendix A – Durability Calculation of Threads on the Bars ... 95
Appendix B – Technical Drawings ... 101
Appendix C – MATLAB Data Processing Program ... 120
viii
List of Tables
Table I: AISI 4140 / ASTM A29 (4140) Elements (ASTM , 2012)... 29
Table 2: Physical Properties of AISI 4140 (MatWeb, 2015) ... 29
Table 3: Physical Properties of C350 maraging steel (Cardarelli, 2008) ... 35
Table 4: Physical properties of AISI 304 stainless steel (Cardarelli, 2008) ... 35
Table 5: Information about the data acquisition cards (National Instruments, 2015) ... 48
Table 6: Range and accuracy of the two data acquisition cards (National Instruments, 2015) .... 49
Table 7: Average striker velocity and firing pressure of the gas gun ... 53
Table 8: Experimental data for calibration of strain gauges ... 59
Table 9: Error and Validation Results ... 61
Table 10: Chemical composition of DP600 steel in weight percent ... 71
Table 11: Mechanical properties of DP600 steel ... 72
Table 12: Gas gun pressure and striker velocity data for the RD specimens ... 76
Table 13: Strain rate for RD specimens ... 76
Table 14: Gas gun pressure and striker velocity data for the DD specimens ... 78
Table 15: Strain rate for DD specimens ... 79
Table 16: Gas gun pressure and striker velocity data for the TD specimens ... 81
Table 17: Strain rate for TD specimens ... 81
Table 18: Error and Validation metric for comparing project data to known data ... 84
ix
List of Figures
Figure 1: Global formability diagram (WorldAutoSteel, 2014) ... 2
Figure 2: Bertram Hopkinson’s experiment to measure pressure waves (Chen & Song, 2011) ... 5
Figure 3: General arrangement of Davies’ apparatus (Davies R. M., 1948). ... 6
Figure 4: Typical layout and major components of a compression SHPB apparatus (Chen & Song, 2011) ... 7
Figure 5: Direct acting tension loading (Hauser, 1966) ... 8
Figure 6: Top hat specimen configuration (Lindholm & Yeakley, 1968) ... 9
Figure 7: Nicholas experimental setup. (Nicholas, 1981) ... 10
Figure 8: Static loading tensile SHPB (Ohio State University) ... 11
Figure 9: Layout of a dynamic loading tensile SHPB apparatus (Hasenpouth, 2010) ... 11
Figure 10: X-t diagram of stress wave propagation in a tensile SHPB apparatus ... 14
Figure 11: Variables at the specimen ... 15
Figure 12: Mechanical components of tensile SHPB ... 23
Figure 13: Support frame for SHPB apparatus ... 24
Figure 14: Vertical support (Zanettin, Young, & Hussain, 2012) ... 25
Figure 15: Horizontal support bar (Zanettin, Young, & Hussain, 2012) ... 25
Figure 16: Exploded view of SHPB bar holder (Zanettin, Young, & Hussain, 2012) ... 26
Figure 17: Bar holder showing adjustability (Zanettin, Young, & Hussain, 2012) ... 27
Figure 18: Bar holder clamped to support frame. ... 28
Figure 19: Striker ... 29
Figure 20: Close up view of the bar and anvil attached ... 30
Figure 21: Close up view of the threads on the bar ... 31
Figure 22: Slot in bars to hold test specimen ... 31
Figure 23: Specimen showing serrations from specimen slot in bars ... 32
Figure 24: Anvil showing threading ... 33
Figure 25: Velocity of striker for various barrel lengths ... 34
Figure 26: Gas gun pressure chamber ... 36
Figure 27: Gas gun cross section ... 36
Figure 28: Valve assembly for gas gun ... 38
x
Figure 30: V groove in momentum trap base ... 40
Figure 31: University of Waterloo specimen design (Smerd, Winkler, Salisbury, Worswick, Lloyd, & Finn, 2005) ... 41
Figure 32: University of Waterloo specimen design modified to fit the new SHPB apparatus ... 41
Figure 33: Gas gun showing which mount is attached with shoulder bolts to I-beam ... 42
Figure 34: Aligning incident bar to gun barrel centre axis by measuring at different points ... 43
Figure 35: Strain gauges wired into the Wheatstone bridge (Kyowa, 2015) ... 45
Figure 36: Micro-switch location on SHPB apparatus ... 47
Figure 37: National Instruments data acquisition system ... 48
Figure 38: Computer cabinet for storing DAQ system ... 50
Figure 39: Strain gauge wrapped with electrical tape ... 50
Figure 40: Valve configuration on gas gun ... 51
Figure 41: Optical gate to measure striker velocity ... 51
Figure 42: Velocity of striker vs. firing pressure of gas gun ... 54
Figure 43: Pressure of gas gun vs. velocity of striker ... 55
Figure 44: Path for strain gauge signal ... 56
Figure 45: MTS tester applying a load on the LC305 load cell ... 57
Figure 46: Load cell placement for calibrating strain gauges ... 58
Figure 47: Set up of jack screw used to apply a compressive load on the bars for calibration of strain gauges ... 58
Figure 48: Voltage out of Wheatstone bridge vs. applied load for load cell #3 ... 60
Figure 49: Alignment of incident anvil and optical gate housing ... 62
Figure 50: Valve actuator connection and fill selection valves ... 63
Figure 51: Valve pneumatic actuator controller ... 64
Figure 52: Example of initial strain vs. count graph for the incident and transmission bars ... 65
Figure 53: 250 kHz, 2nd order lowpass filter ... 66
Figure 54: 250 kHz, 6th order lowpass filter ... 67
Figure 55: Unfiltered and filtered transmission bar strain gauge output ... 67
Figure 56: alignment of the incident and reflected pulses ... 68
Figure 57: Engineering stress versus strain for uniform and average strain ... 69
Figure 58: Example of the true stress-strain versus engineering stress-strain ... 70
xi
Figure 60: Mounted specimen with black marker at bar/specimen interface to show if slipping
occurs ... 73
Figure 61: Fractured SHPB specimen with marker at bar/specimen interface showing no slipping ... 74
Figure 62: RD fracture location ... 75
Figure 63: Bent test specimen from transmission bar collision ... 75
Figure 64: True Stress vs. True Strain curves for all SHPB specimen tested in the RD ... 77
Figure 65: Central fracture location for DD specimens ... 78
Figure 66: Sample specimen showing evidence of slipping in bar specimen slot ... 80
Figure 67: Central fracture location for TD specimens ... 80
Figure 68: Comparison of the true stress vs. true strain data in the RD obtained from two different laboratories ... 83
Figure 69: Comparison of the true stress vs. true strain data in the DD obtained from two different laboratories ... 83
Figure 70: Comparison of the true stress vs. true strain data in the TD obtained from two different laboratories ... 84
Figure 71: Comparison of ArcelorMittal and project data ... 85
Figure 72: Yield Strength versus Hardness Rockwell C ... 96
Figure 73: Unified Thread Standard profile dimensions ... 97
Figure 74: Triangle Used to calculate X, the half-distance through the thread ... 98
xii
List of Symbols
𝐴𝐵 Cross-sectional area of the bar
𝐴𝑠 Cross-sectional area of the specimen
𝐴𝑠𝑡 Cross-sectional area of the striker
𝐴𝑡ℎ𝑟𝑒𝑎𝑑 Area of the threads experiencing a shearing force
𝐶 Factor depending on method of attachment for ASME pressure vessel
𝐶𝐵 Speed of sound in the bar material
𝐶𝑠𝑡 Speed of sound in the striker material
𝐶𝑡 Circumference of the minor diameter of the thread
𝐷 Distance between optical sensors
𝐷𝑃 Diameter of projectile
𝐷𝑚𝑎𝑗 Major diameter of the thread
𝐷𝑚𝑖𝑛 Minor diameter of the thread
𝐸𝐵 Young’s modulus of the bar
𝐸𝑀 Average Error
𝐹𝑖 Force on incident bar
𝐹𝑠𝑡 Force on striker
𝐺𝐹 Gauge factor of the strain gauges
𝐻 Height between the theoretical peaks of the internal and external threads
𝐽 Joint efficiency
𝐾𝐸𝑖 Kinetic energy, from incident pulse
𝐾𝐸𝑅 Kinetic energy, from reflected pulse
xiii
𝐿𝑏𝑎𝑟 Length of gun barrel
𝐿𝑠 Gauge length of the specimen
𝐿𝑠𝑡 Length of the striker
𝑃 Pressure of the gas reservoir
𝑅 Inside radius of cylinder
𝑆 Allowable stress from ASME boiler and pressure vessel code
𝑈𝑖 Elastic strain energy, incident pulse 𝑈𝑟 Elastic strain energy, reflected pulse 𝑈𝑡 Elastic strain energy, transmitted pulse
𝑈𝑠 Elastic strain energy, specimen
𝑉𝑖 Deformed volume in the incident bar
𝑉𝑜𝑢𝑡 Output voltage of the Wheatstone bridge
𝑉𝑒𝑥 Excitation voltage of the Wheatstone bridge
𝑉𝑀 Validation Metric
𝑑 Bolt circle diameter
𝑚 Mass
𝑡 Time
𝑡𝑐 Thickness of thick-wall cylinder of gas gun
𝑡𝑒𝑐 Thickness of the end cap of gas gun
𝑣1 Velocity of the incident bar specimen face
𝑣2 Velocity of the transmission bar specimen face
𝑣𝑖 Velocity of the incident bar
xiv
𝜀 Strain
𝜀 Average engineering strain
𝜀̇ Average engineering strain rate
𝜀̇𝑢 Uniform engineering strain rate
𝜀𝑢 Uniform engineering strain
𝜀𝑖 Incident strain pulse
𝜀𝑅 Reflected strain pulse
𝜀𝑇 Transmitted strain pulse
𝜀𝑝𝑠 Plastic strain in the specimen
𝜀𝑡𝑟𝑢𝑒 True strain
𝜌𝐵 Density of the bar material
𝜌𝑠𝑡 Density of the striker
𝜌𝑃 Density of the projectile
σ Normal stress
𝜎1 Stress at the incident bar specimen face
𝜎2 Stress at the transmission bar specimen face
σ𝑖 Stress in incident bar
𝜎𝑢 Uniform engineering stress
𝜎 Average engineering stress
𝜎𝑠 Yield strength of the specimen
𝜎𝑠𝑡 Stress in the striker
𝜎𝑡𝑟𝑢𝑒 True stress
𝛿𝑒𝑠 Deformation of the specimen by elastic strain energy
xv
1
Chapter 1: Introduction
1.1 Background
Advanced high strength steels have become a material of choice for the body-in-white and
structure of vehicles as the automotive industry endeavours to reduce weight and increase
vehicle safety. The use of advanced high strength steels (AHSS) sheets allows the automotive
industry to produce thinner body components, which lowers the vehicle weight. To further
reduce automobile weight computer simulations are carried out to predict the outcome of
automobile crash events, and simulation results can be used to either reduce the thickness of
stamped components, select stronger materials or optimize the design of the structure.
In these numerical simulation codes, the constitutive models for the materials that make up the
body and structure of the vehicle must take into account how the materials behave at different
strain rates. A “nominal strain rate of 100/s is often used to characterize overall automobile
crash events, whereas strain rates on the order of 1000/s can occur locally” (Salisbury,
Worswick, & Mayer, 2006). The constitutive models must be able to accurately predict how
steel “becomes stronger on impact, allowing the steel to absorb more energy” (WorldAutoSteel,
2015).
Automotive vehicle structures are “commonly manufactured by stamping operations and
experience much lower rates of strain prior to in-service crash events” (Rahmaan, Bardelcik,
Imbert, Butcher, & Worswick, 2014). Figure 1 shows the global formability diagram; with the
increase in strength of the material the percent elongation tends to decrease, which means the
ductility of the material decreases. Therefore “AHSS products have significantly different
forming characteristics and these challenge conventional mechanical and hydraulic press
2
Figure 1: Global formability diagram (WorldAutoSteel, 2014)
In view of the need to compromise between strength and ductility for sheet materials shaped by
conventional forming processes, the pursuit of vehicle weight reduction poses a challenge to
designers seeking to create complex part shapes. This challenge has spurred researchers to
develop novel forming processes, such as high temperature forming or high strain rate forming.
One of the most promising of these new technologies is electrohydraulic forming, which is a
“pulsed forming process that uses the discharge of electrical energy across electrodes
submerged in a fluid to generate a pressure pulse that forms the work piece” (Maris, 2014).
In order to obtain the mechanical properties and work hardening behaviour of these AHSS
materials at different strain rates various types of tests can be performed.
1.2 Objectives of Project
The main objective of this project is to develop a tensile SHPB apparatus to perform high strain
rate testing of sheet materials. This development work includes the following tasks:
Design and fabricate the mechanical components of the tensile SHPB apparatus, Assemble the SHPB apparatus hardware with the required instrumentation and data
3
Develop a LabVIEW virtual instrument to communicate with the various data acquisition
cards,
Develop a MATLAB code to post-process the experimental data and determine the
stress-strain curve for a given test,
Demonstrate the functionality and accuracy of the tensile SHPB apparatus by
performing tests for a particular DP600 sheet steel and compare the stress-strain results
with those obtained for the same sheet material from the tensile SHPB in a different
laboratory.
1.3 Outline of the thesis
Before designing and constructing specialized testing equipment such as a SHPB apparatus, it is
essential to review the existing literature on the subject; this literature review will be presented
in chapter 2 of the thesis. An in depth description of the SHPB apparatus mechanical
components and instrumentation, along with how these components are all assembled into a
functional SHPB apparatus will be presented in chapter 3 of the thesis. In order for the SHPB
apparatus to be useful, calibration of the gas gun pressure to striker velocity and calibration of
the strain gauges are required along with the procedures for operating the SHPB apparatus and
processing the data from it. These topics are presented in chapter 4 of the thesis. To
demonstrate the functionality of the tensile SHPB apparatus, SHPB specimens were tested and
the stress-strain curves were obtained. These flow curves were compared to published results
obtained from world-class laboratories for the same material. These comparisons are presented
in chapter 5 of the thesis. Finally, the conclusions and future recommendations are presented in
4
Chapter 2: Literature Review
2.1 Overview of high strain rate testing
Engineers often need to know how materials will react to loading applied at different strain
rates and therefore different testing devices have been developed to measure the material
response at high strain rates. Servo-hydraulic testing frames can be used to apply strain rates up
to about 100 s-1. The Split Hopkinson Pressure Bar (SHPB) apparatus is generally used for
material testing at strain rates between 100 s-1 and 10,000 s-1. The SHPB “allows the
deformation of a sample of a ductile material at a high strain rate, while maintaining a uniform
uniaxial state of stress within the sample” (ASM Handbook , 2000). For strain rate testing above
1000 s-1 compression and tension tests differ. The Taylor impact test (ASM Handbook , 2000) is
typically used for loading in compression at strain rates up to 100,000 s-1. Expanding ring tests
(ASM Handbook , 2000) are used for loading in tension at strain rates up to 10,000 s-1 and the
flyer plate test is used for strain rates >100,000 s-1 (ASM Handbook , 2000).
2.2 SHPB Apparatus
2.2.1 History of the Hopkinson Pressure Bar
In 1914, Bertram Hopkinson designed an experiment to measure the pressure wave along a
steel rod, when the rod was struck by a bullet or by the detonation of explosives. Hopkinson’s
experiment, shown in Figure 2, consisted of a steel rod (rod B) suspended on wires “as a ballistic
pendulum” (Hopkinson, 1914), with a small rod (rod C) magnetically attached to the suspended
5
Figure 2: Bertram Hopkinson’s experiment to measure pressure waves (Chen & Song, 2011)
Rod B would be struck at point A with a lead bullet or by the pressure wave caused by the
detonation of an explosive. When the length of rod C is shorter than half the length of the
pressure wave, both rod C and rod B will move apart. When the length of rod C is increased to
cause rod B to remain at rest, rod C will be “half the length of the pressure wave” (Hopkinson,
1914). By measuring the momentum of rod C in ballistic pendulum D, “it is possible to measure
both the duration of the blow and the maximum pressure developed by it” (Hopkinson, 1914).
Landon and Quinney (1923) continued Hopkinson’s work, “in an attempt to interpret the results
accumulated before the War, and also some results obtained by Prof. Hopkinson’s assistant at
Cambridge early in 1919”. Landon and Quinney, investigated how the change in the rod length
has an effect on the distortion of the pressure wave and how the mean pressure varied when
the bar diameter changed. Hopkinson’s apparatus allowed “a fairly close estimate…of the
maximum pressure and the time during which the pressure is applicable, but this method gives
no indication of the instant during the blow when the maximum pressure occurs” (Landon &
6
Davies’ (1948) apparatus, shown in Figure 3, further improved upon Hopkinson’s apparatus by
using parallel plates and cylindrical condenser microphones to electrically measure the axial and
radial movements of the loaded bar.
Figure 3: General arrangement of Davies’ apparatus (Davies R. M., 1948).
Davies was able to measure lower pressures by eliminating the detachable end piece and to
measure the time more accurately, and this enabled him to plot the “relation between pressure
and time” (Davies R. M., 1948).
Kolsky (1949) also further developed a Hopkinson pressure bar apparatus to measure the
stress-strain response of materials under impact loading conditions. There are two major problems
encountered when investigating the behaviour of materials at very high rates of loading: these
problems “are associated with inertia effects in the apparatus and with the recording of
transient stresses and strains” (Kolsky H. , 1949). Kolsky (1949) added a second bar to the
Hopkinson pressure bar apparatus placing the test specimen between the two pressure bars.
From these experiments Kolsky was able to determine that the specimen must be significantly
thin to neglect the axial inertia in the specimen, and due to the fact that the radial inertia is
proportional to the square of the radius of the specimen, a smaller specimen should be used to
minimize the radial inertia. The effects of friction between the specimen and bar ends and the
radial inertia in the specimen may bring uncertainties to the measured stress-strain response of
7
affect the results; and where permanent deformations were obtained, they were fairly uniform
with no evidence of barrelling, therefore friction effects would not appear to be large”
(Kolsky H. , 1949).
Krafft et al. (1954) used strain gauges on the Kolsky bar to measure the stress waves instead of
the microphones used previously. The use of strain gauges has now become the standard
measurement technique for Kolsky-bar experiments. Before Krafft et al. (1954), explosives were
used to generate the impact stress pulse. The repeatability of explosives to generate the stress
pulse is very low, and generating repeatable results with explosives was very difficult. The use of
a gas gun as the loading device instead of explosives enabled Krafft et al. to generate repeatable
experiments with less difficulty. The launching of the striker into the incident bar generated a
trapezoidal incident pulse, which has “been traditionally recognized as an ideal for Kolsky bar
experiments” (Chen & Song, 2011).
2.2.2 Compression SHPB
A compression Split Hopkinson Pressure Bar (SHPB) is composed of three major components,
shown in Figure 4: a loading device, the bar components, and the data acquisition system.
8
The loading device is composed of a gun and striker, used to generate the stress wave in the bar
components. The gun either uses explosives or compressed gas to launch the striker bar into the
incident bar. Compressed-gas guns are the preferred method for launching the striker, due to
the repeatability of gas guns, the ability to control the speed of the striker by changing the gas
pressure and the increased safety of not having to handle explosives. The bar components are
comprised of an incident bar, a transmission bar and a momentum trap. It is desirable for both
the incident and transmission bars to have a high yield strength and for them to be linearly
elastic. The momentum trap is used to catch the bars and dissipate the energy safely from the
SHPB apparatus. Data acquisition and recording requires equipment with high sampling rates
due to the small time interval over which the stress wave propagates through the bars. It is also
desirable for the amplifiers to have low latency, so that the amplifiers are able to respond
quickly for signal measurement and not introduce errors.
2.2.3 Types of Tensile SHPB
There are three basic versions of the tensile SHPB apparatus which have been developed over
the years.
The first type of tensile test is the direct acting tensile SHPB apparatus developed by Hauser in
1966. A direct acting tensile SHPB uses a pair of concentric cylinders, with the inner cylinder
being made up of two solid bars called the incident and transmission bar and with a specimen
threaded between the incident and transmission bars. A hollow outer cylinder is attached to
the incident bar via a transfer connection as shown in Figure 5.
Figure 5: Direct acting tension loading (Hauser, 1966) Striker Transfer Bars
Transfer Connection Incident Bar
Specimen
v
9
To impart a stress wave into the incident bar, the striker hits the transmitter bars, which sends a
tension wave into the incident bar. The drawback to this arrangement is the covering of the
sample by the outside cylinder which makes instrumentation difficult and use of optical
measurement techniques impossible.
The second type of tensile test, developed by Lindholm and Yeakley in 1968, is the top hat
specimen. This tensile test uses a modified compression SHPB apparatus, by replacing the solid
transmission bar with a hollow transmission bar of the same cross-sectional area as the incident
bar. The top hat-type specimen seen in Figure 6, is machined to have the tensile test areas on
the side of the hat shape.
Figure 6: Top hat specimen configuration (Lindholm & Yeakley, 1968)
This specimen hat shape leads to a complex geometry that is not suitable for testing samples
that cannot be machined into the required geometry. The benefit of this tension test is that very
few modifications of a compression SHPB apparatus are required.
10
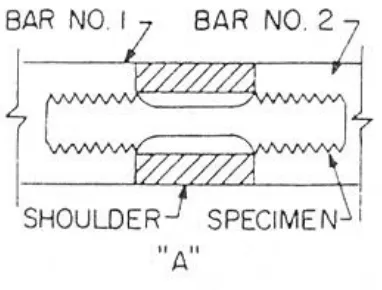
The third type of tensile test involves a compression split Hopkinson pressure bar apparatus,
with a “shoulder or collar placed over the threaded specimen” (Nicholas, 1981), shown in Figure
7.
Figure 7: Nicholas experimental setup. (Nicholas, 1981)
The compression pulse travels along the incident bar, through the shoulder, through the
transmission bar and reflects back as a tensile pulse to the sample. The apparatus “shoulder
which carried the entire compressive pulse around the specimen, is unable to support any
tensile loads because it is not fastened in any manner to the bars” (Nicholas, 1981). This setup
limits the access to the specimen for optical measurement techniques and is not suitable for
sheet materials.
2.2.4 The development of direct acting tensile SHBP apparatus.
The most common tensile SHPB apparatus in use today is the direct acting tensile SHPB. The
direct acting tensile SHPB has been further developed into two different methods for loading
the incident bar and that do not cover the test specimen. The two different loading methods
consist of either static loading or dynamic loading of the incident bar.
The static loading is achieved by locking the incident bar in place with a clamp, applying a load
on the non-specimen end of the bar, as shown in Figure 8. When the clamp is released, the load
is suddenly transmitted to the other end of the incident bar, the specimen and the transmitter
11
Figure 8: Static loading tensile SHPB (Ohio State University)
The design of the clamp is important “in order to minimize the possibility of applying an external
load other than the reaction to the stored tension “ (Staab & Gilat, 1991). This design also allows
a strain gauge to directly measure the applied tension load before releasing the clamp, which
makes it easier to replicate the load for subsequent tests.
In a dynamic loading tensile SHPB apparatus, the loading is done by placing a hollow striker bar
around the incident bar, and firing it with a gas gun. The hollow striker bar travels along the
incident bar and strikes an anvil, or end cap, attached to the end of incident bar, as seen in
Figure 9.
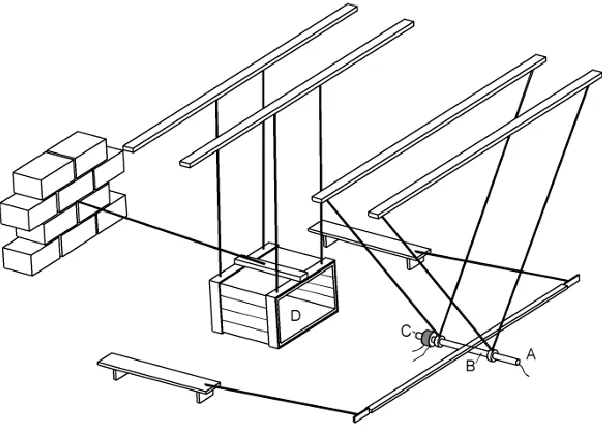
Figure 9: Layout of a dynamic loading tensile SHPB apparatus (Hasenpouth, 2010)
This set-up of the tensile SHPB apparatus ensures that the force due to the impact of the striker
12
2.2.5 Exploring Other Tensile SHPB Apparatus Facilities
According to a literature search, the direct-acting tensile SHPB apparatuses are the most
common. Most current tensile SHPB apparatuses have a useful strain rate range of 400 s-1 to
2000 s-1. Above 1500 s-1, noise in the transmitted strain signal increases and limits the upper
strain rate of the tensile SHPB apparatus. A research team at Ohio State University has one of
the few static loading tensile SHPB, which uses 12.7mm-diameter 7075-T6 aluminum bars, and
allows testing up to 2000 s-1. The use of aluminum bars allows softer materials to be tested, “in
terms of impedance matching” (Gebremeskel et al., 2014). A dynamically-loaded SHPB
apparatus at the University of Mississippi has bars made of various materials, ranging from
maraging steel to AISI 6061-T6 aluminium to “enable the high-strain rate evaluation of metals,
nano-reinforced specimens, foams and sandwich composites” (University of Mississippi, 2015).
The team of researchers who developed a tensile SHPB apparatus at the University of Waterloo
indicated that “momentum trapping ability allows the test to be interrupted at predetermined
strain levels” (Worswick, 2015). Finally, the SHPB apparatus located at Tampere University of
Technology uses “Kyowa CDV 700A series signal conditioners having a bandwidth of 500 kHz”
(Tampere University of Technology, 2015) to amplify the signal from the strain gauges. This is a
much larger bandwidth than is usually used; most SHPB facilities use amplifiers with a
bandwidth of 100 kHz.
2.3 SHPB Theory
The following derivation of the basic SHPB equations based on wave propagation theory was
developed to give the stress, strain and strain rate in the specimen using the strains measured in
the incident and transmission bars. The equations for a compression SHPB apparatus are the
same as a tension SHPB apparatus, other than the stress waves having the opposite signs. For
analysis of the conservation of energy, the derivation is the same for compression and tension
13 2.3.1 Stress waves in cylindrical bars
Cylindrical bars of infinite length can have three types of waves propagate along the bar:
longitudinal, torsional and flexural (transverse) waves. Pochhammer (1876) and Chree (1889)
independently derived the equations and solutions for the propagation of longitudinal waves in
an infinite elastic cylindrical bar. The “theory for an infinite cylinder is based on the boundary
condition that at the free cylindrical surface both the normal stress and the shear stress vanish”
(Kolsky H. , 1964). For the “fundamental mode longitudinal waves travel with velocities which
depend on Poisson’s ratio, 𝜈, and on the value of, 𝛬𝑎, where, 𝑎, is the radius of the cylinder and,
𝛬, is the wavelength” (Kolsky H. , 1964). When, “ 𝛬𝑎 ≫ 1, the wave travels with the velocity, 𝐶0”
(Kolsky H. , 1964), from equation 2.1. As the “distance from the pressure end increases, the
stress distribution becomes more uniform” (Davies R. , 1956). When the ratio of the bar length
to bar diameter, L/D, is 10 or more, the stress wave is considered to be one-dimensional. With a
one-dimensional stress wave “the longitudinal stress and displacement are uniform over the
cross-section of the bar, the radial stress is everywhere zero” (Davies R. M., 1948). Considering
the uniform longitudinal stress and uniform displacement throughout the bar we can use strain
gauges on the surface of the bars to measure the strain.
2.3.2 SHPB equations
When the striker impacts the anvil on the incident bar, as shown in Figure 10, a compression
stress wave, shown in red in Figure 10, propagates through the anvil to the back of the anvil and
reflects as a tension stress wave through the incident bar. Due to the difference in cross
sectional area of the incident bar and the specimen, part of the stress wave is reflected back
toward the anvil and part of the stress wave passes through the specimen. The impact of the
striker also creates a compression stress wave in the striker, shown in blue in Figure 10, which is
reflected back at the free end of the striker as a tension stress wave. The tension stress wave
transmits through the anvil and reflects as a compression stress wave cancelling out the tension
stress wave due to the inverse amplitude, and is called the unloading wave. When the unloading
wave encounters the specimen, it acts like the tension wave reflecting part back to the striker,
14
Figure 10: X-t diagram of stress wave propagation in a tensile SHPB apparatus
The velocity at which the one dimensional stress wave propagates through the material is the
speed of sound in the bar material, 𝐶𝐵, which is a function of the Young’s modulus of the bar, E,
and the density of the bar material, 𝜌𝐵 :
𝐶𝐵= √𝐸𝐵
𝜌𝐵 (2.1)
The striker “transmits a ‘square wave’ pulse of compression into the” (Kraft, Sullivan, & Tipper,
1954) incident bar of a duration, ∆𝑡, which is determined by the length, L𝑠𝑡, of the striker bar:
∆𝑡 =2L𝑠𝑡
𝐶𝐵 (2.2)
If the striker and the incident bars have the same material density and the same cross-sectional
area, the magnitude of the induced stress pulse, σ𝑖 , “is dependent on the striking velocity”
(Chen & Song, 2011) .
σ𝑖=1
2ρ𝐵 𝐶𝐵 𝑣𝑠𝑡 (2.3)
15
Similarly the magnitude of the strain pulse, 𝜀𝑖, is also dependent on the velocity of the striker.
𝜀𝑖 = 𝑣𝑠𝑡
2𝐶𝐵 (2.4)
The following derivations of the equations for stress, strain and strain rate in the specimen are
given by William Sharpe Jr. (Sharpe, 2008), with the variables at the specimen rearranged for
tension, as shown in Figure 11.
Figure 11: Variables at the specimen
These “equations assume that the stress waves propagate in the incident and transmission bars
without dispersion in the bars, and by one dimensional stress wave theory that relates the
particle velocities at both ends of the specimen to the three measured strain pulses” (Chen &
Song, 2011).
𝑣1= 𝐶𝐵(𝜀𝑅− 𝜀𝑖) (2.5)
𝑣2= 𝐶𝐵(−𝜀𝑇) (2.6)
Where the subscripts, i , R , and T , represent the incident, reflected, and transmitted strain
amplitude pulses, respectively. The average engineering strain rate in the specimen is the
difference in the velocity across the specimen divided by the gauge length of the specimen, 𝐿𝑠 .
𝜀̇ =𝑣1− 𝑣2
16
Substituting equations 2.5 and 2.6 into equation 2.7 gives.
𝜀̇ =𝐶𝐵
𝐿𝑠(−𝜀𝑖
+
𝜀𝑅+
𝜀𝑇)
(2.8)Taking the time derivative of equation 2.8 gives the average engineering strain.
𝜀 = ∫ 𝜀̇𝑑𝑡
𝑡𝑗 0=
𝐶
𝐵𝐿
𝑠∫
(−𝜀𝑖+
𝜀𝑅+
𝜀𝑇)𝑑𝑡
𝑡𝑗 0 (2.9)where, j, is the sample number to which the time integration is calculated up to. The stresses at
both ends of the specimen are calculated with the following elastic relations.
𝜎1= 𝐴𝐵
𝐴𝑠 𝐸𝐵(−𝜀𝑖− 𝜀𝑅) (2.10)
𝜎2= 𝐴𝐵
𝐴𝑠 𝐸𝐵( −𝜀𝑇) (2.11)
where, 𝐴𝐵 , and, 𝐴𝑠 ,are the cross-sectional areas of the bars and the specimen and, 𝐸𝐵, is the
Young’s modulus of the bar material. The specimen is assumed to be stress equilibrated in a
Kolsky-bar experiment, such that the specimen uniformly deforms during the experiment.
𝜎1= 𝜎2 (2.12)
By substituting equations 2.10 and 2.11 into equation 2.12 gives.
−𝜀𝑖− 𝜀𝑅= −𝜀𝑇 (2.13)
Substituting equation 2.13 into equations 2.8, 2.9 and 2.10 gives
𝜀̇𝑢 = 2 𝐶𝐵
𝐿𝑠 𝜀𝑅 (2.14)
𝜀𝑢= 2 𝐶𝐵 𝐿𝑠 ∫ 𝜀𝑅𝑑𝑡 𝑡𝑗 0 (2.15) 𝜎𝑢=𝐴𝐵
𝐴𝑠 𝐸𝐵𝜀𝑇 (2.16)
Equations 2.14, 2.15 and 2.16 are known as the Hopkinson equations.
If the specimen does not experience perfect equilibrium when deformed, the mean value of the
stresses experienced at both ends of the specimen is taken to get the average stress in the
17
𝜎 = 1
2(𝜎1+ 𝜎2) = 1 2
𝐴𝐵
𝐴𝑠 𝐸𝐵( −𝜀𝑇− 𝜀𝑅− 𝜀𝑖) (2.17)
However, equation 2.17 is not valid if the “stress or strain in the specimen is in a drastic
non-uniformity” (Chen & Song, 2011). This uniformity can be checked by using equation 2.12.
2.3.3 SHPB Theory using Conservation of Energy
The following analysis of the conservation of energy in a SHPB is from Chen and Song (Chen &
Song, 2011). When a stress wave propagates in a long rod, the mechanical energy of the stress
wave takes the form of strain energy through bar deformation and kinetic energy through bar
motion (Chen & Song, 2011). Using the incident strain, 𝜀𝑖 , caused by the stress wave moving through the incident bar, the elastic strain energy, 𝑈𝑖 , can be calculated.
𝑈𝑖= 𝑉𝑖∫ 𝜎𝑑𝜀𝜀𝑖
0 (2.18)
where, 𝑉𝑖 , is the deformed volume in the incident bar. The deformed volume in the incident bar depends upon the loading duration and the cross-sectional area of the incident bar, which can
be expressed by:
𝑉𝑖=𝐴𝐵𝐶𝐵∆𝑡 (2.19)
The linear elastic stress in the incident bar can be expressed as:
𝜎𝑖= 𝐸𝐵𝜀𝑖 (2.20)
Substituting equation 2.20 into 2.18 gives.
𝑈𝑖 =1
2𝐴𝐵𝐶𝐵𝐸𝐵∆𝑡𝜀𝑖2 (2.21)
The elastic strain energies of the reflected and transmitted waves, 𝑈𝑅 and, 𝑈𝑇 , can be calculated using a similar derivation giving:
𝑈𝑅 =1
2𝐴𝐵𝐶𝐵𝐸𝐵∆𝑡𝜀𝑅2 (2.22)
𝑈𝑇 =1
18
The specimen deformation based on the contribution of the elastic strain energy in the bars is
given by:
𝛿𝑒𝑠 = 𝑈𝑖− 𝑈𝑅− 𝑈𝑇 (2.24)
Substituting equations 2.21, 2.22 and 2.23 into equation 2.24 gives:
𝛿𝑒𝑠 = 1
2𝐴𝐵𝐶𝐵𝐸𝐵∆𝑡(𝜀𝑖2− 𝜀𝑅2− 𝜀𝑇2) (2.25)
When the specimen is in a state of dynamic stress equilibrium equation 2.25 is:
𝛿𝑒𝑠 = −𝐴𝐵𝐶𝐵𝐸𝐵∆𝑡𝜀𝑅𝜀𝑇 (2.26)
It is understood that the energy difference is positive since the reflected strain, 𝜀𝑟 , takes the
opposite sign of the incident and transmitted strains. Considering the kinetic energy, 𝐾𝐸𝑖 , in the
incident bar due to the incident wave as.
𝐾𝐸𝑖 = 1
2𝑚𝑣𝑖2 (2.27)
where 𝑚 and 𝑣𝐼 are the mass and particle velocity of the deformed portion of the incident bar
which are given by:
𝑚 = 𝜌𝐵 𝐴𝐵𝐶𝐵∆𝑡 (2.28)
𝑣𝑖 = 𝐶𝐵𝜀𝑖 (2.29)
Substituting equations 2.28 and 2.29 into equation 2.27 gives:
𝐾𝐸𝑖 = 1
2𝜌𝐵 𝐴𝐵𝐶𝐵3∆𝑡𝜀𝑖2 (2.30)
The kinetic energies of the reflected and transmitted waves, 𝐾𝐸𝑅 and 𝐾𝐸𝑇 , can be calculated using a similar derivation giving:
𝐾𝐸𝑅=1
2𝜌𝐵 𝐴𝐵𝐶𝐵3∆𝑡𝜀𝑅2 (2.31)
𝐾𝐸𝑇 = 1
2𝜌𝐵 𝐴𝐵𝐶𝐵3∆𝑡𝜀𝑇2 (2.32)
19
𝛿𝐾𝐸𝑠 = 𝐾𝐸𝑖− 𝐾𝐸𝑅− 𝐾𝐸𝑇 (2.33)
Substituting equations 2.30, 2.31 and 2.32 into equation 2.33 gives.
𝛿𝐾𝐸𝑠 = 1
2𝜌𝐵 𝐴𝐵𝐶𝐵3∆𝑡(𝜀𝑖2− 𝜀𝑅2− 𝜀𝑇2) (2.34)
When the specimen is in stress equilibrium equation 2.34 becomes:
𝛿𝐾𝐸𝑠 = −𝜌𝐵 𝐴𝐵𝐶𝐵3∆𝑡𝜀
𝑅𝜀𝑇 (2.35)
For linear elastic bars,
𝐸𝐵 = 𝜌𝐵 𝐶𝐵2 (2.36)
Substituting equations 2.36 into equation 2.35 gives:
𝛿𝐾𝐸𝑠 = −𝐴𝐵𝐸𝐵𝐶𝐵∆𝑡𝜀𝑅𝜀𝑇 (2.37)
It can be noted that the specimen deformation due to kinetic energy has the same form as the
specimen deformation due to the elastic strain energy. If the specimen is assumed to have a
perfectly plastic response, the specimen deformation energy is simplified to.
𝑈𝑠 = 𝐴𝑠𝐿𝑠𝜎𝑦𝜀𝑝 (2.38)
where, 𝐴𝑠, is the initial cross-sectional area of the specimen and, 𝐿𝑠 ,is the initial length of the
specimen.The yield strength, 𝜎𝑠, and the plastic strain, 𝜀𝑝𝑠, of the specimen is:
𝜎𝑠=𝐴𝐵
𝐴𝑆𝐸𝐵𝜀𝑇 (2.39)
𝜀𝑝𝑠 = 𝜀∆𝑡 = −2𝐶𝐵
𝐿𝑠 𝜀𝑅∆𝑡 (2.40)
Equation 2.40 is based on constant strain rate deformation in the specimen. Substituting
equations 2.39 and 2.40 into equation 2.38 gives:
𝑈𝑠= −2𝐴𝐵𝐸𝐵𝐶𝐵∆𝑡𝜀𝑅𝜀𝑇 (2.41)
Therefore the specimen deformation energy is equal to.
𝑈𝑠= 2𝛿𝑒𝑠 = 2𝛿𝐾𝐸𝑠 (2.42)
From equation 2.42 it can be seen that half of the energy needed to deform the specimen
20
bars. It should be noted that this analysis does not include the kinetic energy in the specimen.
Knowing that half the energy needed to plastically deform the specimen is important for setting
up the momentum trap. If the momentum trap stops the movement of the incident bar too
quickly, the specimen will not plastically deform and the specimen will not reach the ultimate
strength and break.
2.3.4 Striker Velocity
The velocity of the striker is the determining factor of the specimen strain rate. The stresses
generated upon impact of the striker on the incident bar can be determined from the strain
gauge mounted on the incident bar. The stress in the striker, 𝜎𝑠𝑡, and incident bar, 𝜎𝑖, are
“related with the velocity in the common interface” (Gallina, Birch, & Alves, 2003) by the two
equations from Johnson (1972):
𝜎𝑠𝑡= 𝜌𝑠𝑡𝐶𝑠𝑡(𝑣𝑠𝑡− 𝑣𝑖) (2.43)
𝜎𝑖 = 𝜌𝐵𝐶𝐵𝑣𝑖 (2.44)
Also at impact, the force exerted onto the incident bar is equal to the reaction force exerted on
the striker:
𝐹𝑠𝑡= 𝐹𝑖 (2.45)
𝐴𝑠𝑡𝜎𝑠𝑡 = 𝐴𝐵𝜎𝑖 (2.46)
Substituting equation 2.43 and 2.44 into equation 2.46 gives:
𝐴𝑠𝑡𝜌𝑠𝑡𝐶𝑠𝑡(𝑣𝑠𝑡− 𝑣𝑖) = 𝐴𝐵𝜌𝐵𝐶𝐵𝑣𝑖 (2.47)
𝛽 =𝐴𝑠𝑡𝜌𝑠𝑡𝐶𝑠𝑡
𝐴𝐵𝜌𝐵𝐶𝐵 (2.48)
In order to ensure one dimensional wave propagation, the properties and cross-sectional areas
21
𝑣𝑖 = 𝛽𝑣𝑠𝑡 1 + 𝛽=
𝑣𝑠𝑡
2 (2.49)
Substituting equation 2.49 into equation 2.43 and equation 2.44 gives:
𝜎𝑠𝑡 = 𝜌𝐵𝐶𝐵(𝑣𝑠𝑡−𝑣𝑠𝑡 2 ) =
𝜌𝐵𝐶𝐵𝑣𝑠𝑡
2 (2.50)
𝜎𝑖 = 𝜌𝐵𝐶𝐵𝑣𝑠𝑡
2 (2.51)
Similar to the interface between the striker and incident bars, the force exerted onto the
specimen is equal to the reaction force exerted on the incident bar, assuming no losses:
𝐹𝑖 = 𝐹𝑠 (2.52)
Recalling that the stress pulse is both transmitted and reflected at this interface, the transmitted
and reflected stress pulses are:
𝐴𝐵𝜎𝑡 = 𝐴𝑠𝜎𝑠 (2.53)
𝜎𝑡 =𝐴𝑠𝜎𝑠
𝐴𝐵 (2.54)
𝜎𝑟 = 𝐸𝐵𝜖𝑟 (2.55)
where “𝜎𝑡” is the transmitted stress, “𝜎𝑟” is the reflected stress, and “𝐴𝑠” is the cross-sectional
area of the specimen. Substituting equation 2.55 into equation 2.14 gives:
𝜎𝑟 = 𝐸𝐵𝐿𝑠
−2𝐶𝐵𝜀̇ (2.56)
Given that the transmitted stress is equal to the difference between the incident stress and the
reflected stress, the incident stress is equal to:
𝜎𝑖 = 𝜎𝑡− (−𝜎𝑟) (2.57)
Substituting equations 2.54 and 2.56 into equation 2.57 gives:
𝜎𝑖 =𝐴𝑠𝜎𝑠 𝐴𝐵 +
𝐸𝐿𝑠
2𝐶𝐵𝜀̇ (2.58)
22
𝑣𝑠𝑡 = 2 𝜌𝐵𝐶𝐵(
𝐴𝑠 𝐴𝐵𝜎𝑠+
𝐸𝐵𝐿𝑠
2𝐶𝐵 𝜀̇) (2.59)
Equation 2.59 “allows the calculation of the striker velocity so a given strain rate and stress level
in the specimen” (Gallina, Birch, & Alves, 2003) can be achieved.
The maximum velocity for the striker is limited by the yield strength of the bar material. Since
the bar must not deform plastically the induced stress pulse, σ𝑖, in equation 2.3 can be
substituted with the bar material yield strength,
𝑆
𝑦𝐵, and equation 2.3 can be rearranged as:𝑣
𝑠𝑡 𝑚𝑎𝑥=
2𝑆
𝑦𝐵𝜌
𝐵𝐶
𝐵 (2.60)Equation 2.3 allows the maximum velocity of the striker to be calculated which will not cause
23
Chapter 3: Design, Construction, and Assembly of SHPB
3.1 Overview of a Tensile Split Hopkinson Pressure Bar Apparatus
The Tensile SHPB apparatus is used to test materials in tension at various strain rates. This
apparatus described in this thesis was specified to test sheet materials with a tensile strength up
to 1500 MPa at strain rates up to 2000 s-1. The SHPB apparatus is composed of mechanical
components, shown in Figure 12, and instrumentation that will gather the data from the
apparatus.
Figure 12: Mechanical components of tensile SHPB
The mechanical components are composed of a support frame, incident bar, transmission bar,
bar supports, gas gun, the momentum trap, and the specimen; these will be described in detail
in Section 3.2. The instrumentation components are comprised of the data acquisition system,
pressure transducer, strain gauges, strain gauge completion circuits, strain gauge amplifiers, and
an optical gate to measure the velocity of the striker; these components will be described in
Section 3.3.
Gas Gun Incident Bar
Specimen
Transmission Bar Bar Supports
Momentum Trap Anvil
Striker
24
3.2 Mechanical Components
3.2.1 Support Frame
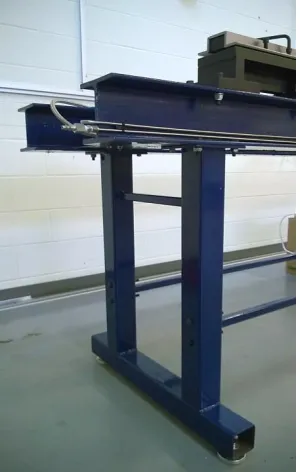
A stable frame to mount the tensile SHPB apparatus is required. The SHPB frame must also be
adjustable for level, because the floor surface cannot be assumed to be level. To meet these
requirements an I-beam mounted on adjustable support legs was designed as part of a 2012
capstone project to build a compression SHPB apparatus. To accommodate both tensile and
compressive SHPB apparatuses two I-beams were mounted parallel on the adjustable frame
seen in Figure 13.
Figure 13: Support frame for SHPB apparatus
The length of the I-beam was determined by the length of the SHPB apparatus plus extra length
for future expansion if longer incident or transmission bars were used. A W5x16 I-beam “was
chosen based off the width of its flange” (Zanettin, Young, & Hussain, 2012), with a length of
8.5m. The I-beam supports were located every 1.3m for a total of six supports. With this spacing
between supports, the maximum deflection of the I-beam between the supports was calculated
to be 0.2mm (Zanettin, Young, & Hussain, 2012) under static loading. The deflection of the
25
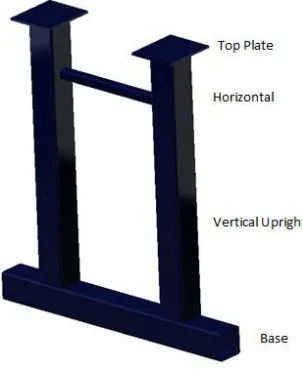
supports, shown in Figure 14 (the technical drawings can be found in Appendix B), were made of
74mm x 74mm and 25mm x 25mm AISI 1020 CD square tubing.
Figure 14: Vertical support (Zanettin, Young, & Hussain, 2012)
Each vertical upright has a top plate welded at one end to accommodate the I-beam and is
welded to the base tube which has adjustable feet bolted to it for leveling of the frame
assembly. To keep the vertical uprights the correct distance apart near the top plate, 25mm x
25mm tube was welded between the two vertical tubes. There are also slender horizontal
support beams, shown in Figure 15, made of 25mm x 25mm tubing with a plate welded onto
both ends of the tube, used to bolt onto the vertical supports.
Figure 15: Horizontal support bar (Zanettin, Young, & Hussain, 2012)
26 3.2.2 Bar Holders
The bar holders, designed during a 2012 capstone project for the compression SHPB apparatus,
were designed to allow fine adjustment of the incident and transmission bars in three
dimensional space and support the incident and transmission bars with minimal friction. The
exploded view of the bar holder, shown in Figure 16, gives an overview of the components that
make up the bar holder.
Figure 16: Exploded view of SHPB bar holder (Zanettin, Young, & Hussain, 2012)
The technical drawing in Appendix B shows the actual dimensions of the bar holder. The foot,
threaded base, outer housing, and the bushing housing were made of AISI 1018 steel. The
threaded rod is 3/4" UNF with a shoulder machined into one end to support the outer housing.
A Teflon bushing was pressed into the bushing housing to give the incident and transmission
bars a low friction surface to move on. The adjustment shown in Figure 17, allows the incident
27
Figure 17: Bar holder showing adjustability (Zanettin, Young, & Hussain, 2012)
The threaded rod allows the height of the outer housing to be raised or lowered, with the set
nut locking the threaded rod’s movement once the final height is set. The outer housing can
rotate on the threaded rod’s machined shoulder to align the bushing housing perpendicular to
the incident, transmission and unloading bars, with a set-screw to lock the bushing housing once
the final alignment is reached. The shoulder bolts allow the bushing housing to move from side
to side in the outer housing and to rotate around the axis of the shoulder bolts, two set screws
lock the shoulder bolts in the final place.
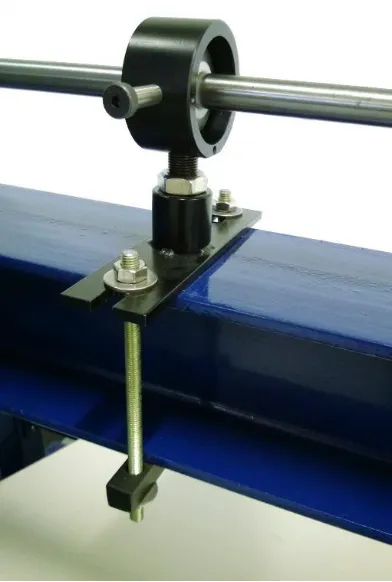
The bar holders were clamped to the support frame I-beams with two threaded rods between
the bar holder and a lower bar, as shown in Figure 18. By using a clamping mechanism, instead
of bolting the bar holders onto the I-beam, the position of the bar holders along the I-beam can
28
Figure 18: Bar holder clamped to support frame.
3.2.3 Striker and Bars
A) Striker
The striker must have good impact resistance in order to resist plastic deformation when it
strikes the incident bar. The striker was machined from AISI 4140/ASTM A29 round bar, a
material with good impact resistance. AISI 4140 steel “has high fatigue strength, abrasion and
impact resistance, toughness, and torsional strength” (AZO Materials, 2015). The chemical
29
Table I: AISI 4140 / ASTM A29 (4140) Elements (ASTM , 2012)
Grade
Designation Carbon Manganese
Phosphorus Max
Sulfur
Max Silicon Chromium Molybdenum
4140 0.38
-0.43 0.75 - 1.00 0.035 0.040
0.15 - 0.35
0.80 –
1.10 0.15 - 0.25
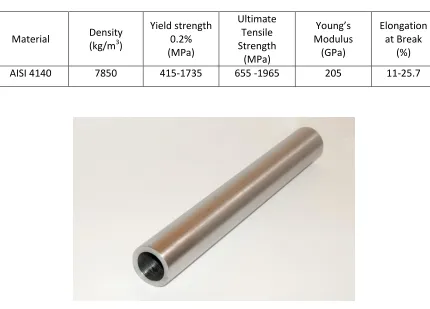
The physical properties of AISI 4140 steel are presented in Table 2.
Table 2: Physical Properties of AISI 4140 (MatWeb, 2015)
Material Density (kg/m3)
Yield strength 0.2% (MPa) Ultimate Tensile Strength (MPa) Young’s Modulus (GPa) Elongation at Break (%)
AISI 4140 7850 415-1735 655 -1965 205 11-25.7
Figure 19: Striker
The striker, shown in Figure 19 (the technical drawing can be found in Appendix B), was
manufactured by first drilling the hole down the length of a solid bar stock and then reaming the
inside diameter of the hole to 19.1 mm, so as to have a slip fit over the incident bar. Secondly,
the outside surface of the striker was turned down to a diameter of 27mm to provide a slip fit
inside the gas gun, using the finished inside hole to make the outside axisymmetric with the
30 B) Incident and Transmission Bars
In order for the stress wave to propagate with the same velocity through both the incident bar,
transmission bar and the striker, the incident bar and transmission bar were fabricated from the
same material as the striker, AISI 4140 alloy steel. The incident and transmission bars were
machined identically to form a matched set of bars. The incident bar and transmission bar are
composed of two parts: the bar and an anvil as seen in Figure 20.
Figure 20: Close up view of the bar and anvil attached
The AISI 4140 round bar from which the incident and transmission bars were made was
purchased with the final outside diameter ground and polished to 19.05mm. Both incident and
transmission bars are 2000mm long, which yields a length-to-diameter ratio of L/D = 105, so as
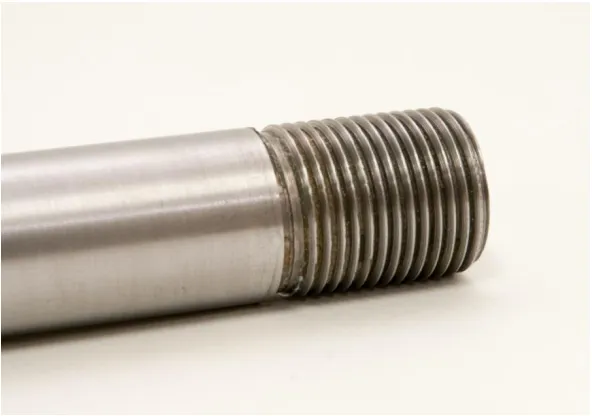
to ensure a one-dimensional stress wave. One end of the bar was then threaded with 0.75” UNF
thread (ASME, 2003), as seen in Figure 21, to attach the anvil to the bar. The durability of the
threads subject to cyclic loading is provided in Appendix A. It was estimated that, under the
maximum loading conditions, the threads on the incident bar and mating anvil would withstand
31
Figure 21: Close up view of the threads on the bar
The other end of the incident bar has a slot, as shown in Figure 22, that was designed to
accommodate the test specimen. This slot was precision electric discharge machined with a
serrated surface finish to better grip the specimen. Figure 23 shows that the serrated surfaces of
the slot are able to effectively grip a test specimen as they leave indentation marks on the
specimen itself.
Figure 22: Slot in bars to hold test specimen
32
Figure 23: Specimen showing serrations from specimen slot in bars
The specimen slot was made 1.5mm wide to accept test specimens taken from sheet materials
1.5mm thick. The depth of the slot is 22.4mm. A two-piece aluminum clamp-on shaft collar is
used to compress the incident/transmission bar specimen slot around the specimen, to hold the
specimen in place during the test. The two-piece aluminum clamp-on shaft collar was ordered
from McMaster-Carr (part number 6436K72).
The anvil was also made from the AISI 4140 round bar and was turned to a final outside
diameter of 27mm, which is the same outside diameter as that of the striker. A hole was then
turned in the centre of the anvil about half way along its length, and then threaded with a 0.75”
UNF thread (ASME, 2003) so as to screw the anvil onto the incident bar. Figure 24 shows a
33
Figure 24: Anvil showing threading
Loctite threadlocker Blue 242 thread locking compound was used to fill in the voids between the
threads to prevent the threads from loosening due to shock and vibration.
3.2.4 Gas gun
The gas gun was positioned on the I-beam frame in such a way that the striker will fit around the
incident bar and slide along it at high velocity and strike the anvil with the required force. The
gas gun is composed of three main components: a barrel, a pressure chamber and a valve
assembly. Using mechanically actuated valves the pressure chamber is filled to the pressure
required to achieve the desired striker velocity. This pressure is determined from equation (3.1).
Once the gas gun pressure chamber reaches the required pressure, the pneumatic actuators
move the valve toward the specimen uncovering two openings in the gas gun barrel. The valve
blocks one end of the gas gun barrel, leaving the opposite side as the path of least resistance for
the gas to escape. As the gas enters the gun barrel and the gas volume expands, the striker is
accelerated along the incident bar up to the required velocity.
Using Newton’s equations of motion, Berggren & Reynolds (1970) proposed an equation written
34
𝑣𝑠𝑡 = [2𝑃 𝜌𝑃
𝐿𝑏𝑎𝑟⁄𝐷𝑃 𝐿𝑠𝑡⁄𝐷𝑃 ]
1 2 ⁄
(3.1)
The projectile velocity can be maximized by increasing the pressure and 𝐿𝑏𝑎𝑟⁄𝐷𝑃 , while
minimizing the density of the projectile and 𝐿𝑠𝑡⁄𝐷𝑃 . When the bore of the gun is held at a
specific diameter, the velocity of the projectile will increase with an increase in the length of the
barrel of the gun as can be seen in Figure 25.
Figure 25: Velocity of striker for various barrel lengths
The gas gun was designed considering that the incident and transmission bars would be made of
C350 maraging steel. This grade of steel was selected so that higher strength test specimens
could be tested without plastically deforming the incident and transmission bars. The physical
35
Table 3: Physical Properties of C350 maraging steel (Cardarelli, 2008)
Material Density (kg/m3)
Yield strength 0.2% (MPa) Ultimate Tensile Strength (MPa) Young’s Modulus (GPa) Elongation at Break (%)
C350 8000 2318 2339 200 8
From equation 2.60, the maximum velocity of the striker for bars made of C350 maraging steel
was calculated to be 121.14 m/s. Using Figure 25, a barrel length of 1m was selected, so the
striker would not exceed the velocity of the striker that would induce plastic deformation in the
C350 maraging steel. Using a 1m long barrel also kept the incident bar supports a reasonable
distance apart. The barrel length was limited by the 1.2m-stroke of available gun drilling
machines. The gas gun’s maximum pressure was selected to be 6895 kPa, since this pressure will
allow the striker to reach the design stress and strain rates while keeping the striker velocity
below the maximum allowable for C350 maraging steel bars.
The technical drawings for the gas gun are in Appendix B, and the following is a brief description
of how the parts were manufactured. The barrel was fabricated from AISI 304 stainless steel bar
stock to eliminate corrosion inside the barrel. The physical properties of AISI 304 stainless steel
are shown in Table 4: Physical properties of AISI 304 stainless steel.
Table 4: Physical properties of AISI 304 stainless steel (Cardarelli, 2008)
Material Density (kg/m3)
Yield strength 0.2% (MPa) Ultimate Tensile Strength (MPa) Young’s Modulus (GPa) Elongation at Break (%)
AISI 304 8000 205-760 515-1035 200 7-40
This AISI 304 stainless steel bar stock was turned into a hollow barrel by gun drilling along the
central axis of the bar to an inside diameter of 27mm, then using a boring bar the valve area was
enlarged to the final diameter of 38mm. Two openings were then machined to allow the
36
The pressure chamber, seen in Figure 26, is composed of four parts: two end plates, the gun
barrel and a thick-wall cylinder.
Figure 26: Gas gun pressure chamber
A cross section view shown in Figure 27, shows the relationship of the gas gun parts.
Figure 27: Gas gun cross section
The end caps of the pressure chamber serve two purposes. First, they are the end caps that seal
the pressure chamber and enable it to hold a pressure. Secondly, they locate the barrel at a
distance above the base frame and provide a means for the gas gun to be firmly mounted onto
the base frame. The two end plates were machined from solid blocks of AISI 1018 steel into an
inverted “T” shape with a hole in the centre of the upright to allow the barrel to pass through,
and a circular groove machined into the upright to have a transition fit with the ends of the