University of Windsor University of Windsor
Scholarship at UWindsor
Scholarship at UWindsor
Electronic Theses and Dissertations Theses, Dissertations, and Major Papers
9-10-2019
Big Data Analytics for Complex Systems
Big Data Analytics for Complex Systems
Ashraf Mohamed Abou Tabl
University of Windsor
Follow this and additional works at: https://scholar.uwindsor.ca/etd
Recommended Citation Recommended Citation
Abou Tabl, Ashraf Mohamed, "Big Data Analytics for Complex Systems" (2019). Electronic Theses and Dissertations. 7795.
https://scholar.uwindsor.ca/etd/7795
This online database contains the full-text of PhD dissertations and Masters’ theses of University of Windsor students from 1954 forward. These documents are made available for personal study and research purposes only, in accordance with the Canadian Copyright Act and the Creative Commons license—CC BY-NC-ND (Attribution, Non-Commercial, No Derivative Works). Under this license, works must always be attributed to the copyright holder (original author), cannot be used for any commercial purposes, and may not be altered. Any other use would require the permission of the copyright holder. Students may inquire about withdrawing their dissertation and/or thesis from this database. For additional inquiries, please contact the repository administrator via email
Big Data Analytics for Complex Systems
by
Ashraf Mohamed Abou Tabl
A Dissertation
Submitted to the Faculty of Graduate Studies
through the Industrial and Manufacturing Systems Engineering Graduate Program in Partial Fulfillment of the Requirements for
the Degree of Doctor of Philosophy at the University of Windsor
Windsor, Ontario, Canada
Big Data Analytics for Complex Systems
by
Ashraf Mohamed Abou Tabl APPROVED BY:
______________________________________________ Shihab S. Asfour, External Examiner
University of Miami
______________________________________________ A. Hussein
Department of Mathematics and Statistics
______________________________________________ Z. J. Pasek
Department of Mechanical, Automotive and Materials Engineering
______________________________________________ H. ElMaraghy
Department of Mechanical, Automotive and Materials Engineering
______________________________________________ W. ElMaraghy, Advisor
Department of Mechanical, Automotive and Materials Engineering
iii
DECLARATION OF CO-AUTHORSHIP / PREVIOUS
PUBLICATION
I. Co-Authorship
I hereby declare that this thesis incorporates material that is a result of joint research of the author and his supervisor Prof. Waguih ElMaraghy. Chapter 5 of the thesis was co-authored with Professor Alioune Ngom, Professor Luis Rueda, Dr. Abedalrhman Alkhateeb, Mr. P. Quang, and Mr. S. Jubair. In all cases, the key ideas, primary contributions, experimental designs, data analysis, interpretation, and writing were performed by the author, and the contribution of the co-authors was providing feedback on refinement of ideas and editing of the manuscript. This joint research has been submitted to Journals and Conferences that are listed below.
I am aware of the University of Windsor Senate Policy on Authorship, and I certify that I have properly acknowledged the contribution of other researchers to my thesis, and have obtained written permission from each of the co-authors to include the above material(s) in my thesis.
I certify that, with the above qualification, this thesis, and the research to which it refers, is the product of my own work.
II. Declaration of Previous Publication
This thesis includes seven original papers that have been previously published/submitted for publication in peer-reviewed journals and conferences, as follows:
Thesis
Chapter Publication title/full citation Publication status*
4
Ashraf Abou Tabl, W. ElMaraghy. “Big Data Analytics for Defects Detection in Manufacturing Systems (Industry 4.0)”, International Journal of Computer Integrated Manufacturing(IJCIM) ID: TCIM-2019-IJCIM-0178.
iv
5
Ashraf Abou Tabl, A. Alkhateeb, L. Rueda, W. ElMaraghy, A. Ngom. “A machine learning approach for identifying gene biomarkers guiding the treatment of breast cancer,” Frontiers in Genetics. doi: 10.3389/fgene.2019.00256.
Journal (published)
5
Ashraf Abou Tabl, A. Alkhateeb, P. Quang, L. Rueda, W. ElMaraghy, A. Ngom.” A novel approach for identifying relevant genes for breast cancer survivability on specific therapies” Evolutionary Bioinformatics, 2018, Evolutionary Bioinformatics, 14, doi: 10.1177/1176934318790266.
Journal (published)
5
S. Jubair, A. Alkhateeb, A Abou Tabl, L. Rueda, A. Ngom, “Identifying subtype specific network-biomarkers of breast cancer survivability”, Evolutionary Bioinformatics, (EVB-2019-0142).
Journal (Submitted)
5
Ashraf Abou Tabl, Alkhateeb A, ElMaraghy W and Ngom A. Machine learning model for identifying gene biomarkers for breast cancer treatment survival [version 1; not peer reviewed]. F1000Research 2017, 6(ISCB Comm J):1681
(doi: 10.7490/f1000research.1114873.1) (Non-referee Journal) (Abstract and Poster)
Journal (published)
5
Ashraf Abou Tabl, Alkhateeb, A., ElMaraghy, W., & Ngom, A. (2017, August). Machine Learning Model for Identifying Gene Biomarkers for Breast Cancer Treatment Survival. In Proceedings of the 8th ACM International Conference on Bioinformatics, Computational Biology, and Health Informatics (pp. 607-607) (ACM 2017), Boston, MA. doi>10.1145/3107411.3108217
Conference proceeding (published)
5
Ashraf Abou Tabl, Alkhateeb, A., Rueda, L., ElMaraghy, W., & Ngom, A. (2018, March). Identifying gene biomarkers for breast cancer survival using a tree-based approach. BHI 2018 IEEE International Conference on Biomedical and Health Informatics, Las Vegas, NV, USA, March 2018.
v
I certify that I have obtained written permission from the copyright owner(s) to include the above-published material(s) in my thesis. I certify that the above material describes work completed during my registration as a graduate student at the University of Windsor.
I declare that, to the best of my knowledge, my thesis does not infringe upon anyone’s copyright nor violate any proprietary rights and that any ideas, techniques, quotations, or any other material from the work of other people included in my thesis, published or otherwise, are fully acknowledged in accordance with the standard referencing practices. Furthermore, to the extent that I have included copyrighted material that surpasses the bounds of fair dealing within the meaning of the Canada Copyright Act, I certify that I have obtained written permission from the copyright owner(s) to include such material(s) in my thesis.
vi
ABSTRACT
The evolution of technology in all fields led to the generation of vast amounts of data by modern systems. Using data to extract information, make predictions, and make decisions is the current trend in artificial intelligence. The advancement of big data analytics tools made accessing and storing data easier and faster than ever, and machine learning algorithms help to identify patterns in and extract information from data. The current tools and machines in health, computer technologies, and manufacturing can generate massive raw data about their products or samples. The author of this work proposes a modern integrative system that can utilize big data analytics, machine learning, super-computer resources, and industrial health machines’ measurements to build a smart system that can mimic the human intelligence skills of observations, detection, prediction, and decision-making. The applications of the proposed smart systems are included as case studies to highlight the contributions of each system.
The first contribution is the ability to utilize big data revolutionary and deep learning technologies on production lines to diagnose incidents and take proper action. In the current digital transformational industrial era, Industry 4.0 has been receiving researcher attention because it can be used to automate production-line decisions. Reconfigurable manufacturing systems (RMS) have been widely used to reduce the setup cost of restructuring production lines. However, the current RMS modules are not linked to the cloud for online decision-making to take the proper decision; these modules must connect to an online server (super-computer) that has big data analytics and machine learning capabilities. The online means that data is centralized on cloud (supercomputer) and accessible in real-time. In this study, deep neural networks are utilized to detect the decisive features of a product and build a prediction model in which the iFactory will make the necessary decision for the defective products. The Spark ecosystem is used to manage the access, processing, and storing of the big data streaming. This contribution is implemented as a closed cycle, which for the best of our knowledge, no one in the literature has introduced big data analysis using deep learning on real-time applications in the manufacturing system. The code shows a high accuracy of 97% for classifying the normal versus defective items.
vii
them with the proper drug molecules. In the learning phase, a couple of feature-selection techniques and supervised standard classifiers are used to build the prediction model. Most of the nodes show a high-performance measurement where accuracy, sensitivity, specificity, and F-measure ranges around 100%.
The third contribution is the ability to build semi-supervised learning for the breast cancer survival treatment that advances the second contribution. By understanding the relations between the classes, we can design the machine learning phase based on the similarities between classes. In the proposed research, the researcher used the Euclidean matrix distance among each survival treatment class to build the hierarchical learning model. The distance information that is learned through a non-supervised approach can help the prediction model to select the classes that are away from each other to maximize the distance between classes and gain wider class groups. The performance measurement of this approach shows a slight improvement from the second model. However, this model reduced the number of discriminative genes from 47 to 37. The model in the second contribution studies each class individually while this model focuses on the relationships between the classes and uses this information in the learning phase. Hierarchical clustering is completed to draw the borders between groups of classes before building the classification models. Several distance measurements are tested to identify the best linkages between classes. Most of the nodes show a high-performance measurement where accuracy, sensitivity, specificity, and F-measure ranges from 90% to 100%.
viii
DEDICATION
To God
For the privilege of giving me this life
To my Father, Mother, and Brothers
For their infinite love and support throughout my life
To my Wife and my Kids
ix
ACKNOWLEDGMENT
Firstly, I would like to extend my sincere gratitude to my dissertation adviser, Professor Waguih ElMaraghy, for giving me the opportunity to collaborate with him and for his guidance, encouragement, time and effort throughout the course of this research. His continuous support has benefited my research tremendously.
I would like to thank the committee members for their feedback and constructive comments that led me to make significant improvements to this dissertation. I extend a special thanks to Professor Hoda ElMaraghy for her comments and suggestions during committee meetings and Intelligent Manufacturing Systems (IMS) Centre meetings. My sincere thanks also go to Professor Zbigniew J. Pasek for his guidance, suggestions, and challenging questions. Many thanks to Professor Abdulkadir Hussein for providing valuable feedback and recommendations.
I would also like to thank my current and former colleagues at the IMS Centre for their help and support; many thanks to Dr. Mohamed Hanafy, Dr. Mohamed Kashkoush, Dr. Mohamed Abbas, Dr. Abdulrahman Seleim, Dr. Jessica Olivares, Mr. Ahmed Marzouk, Mr. Mostafa Moussa, and Mr. Hamid Tabti.
I would like to express my best and sincerest gratitude to Dr. Abedalrhman Alkhateeb, Professor Alioune Ngom, and Professor Luis Rueda from the School of Computer Science for all their support, help, guidance, patience, and encouragement, as well as to my parents, family, and friends for being always there for me. None of this would have been possible without you.
Additionally, I would like to thank the Department of Mechanical, Automotive & Materials Engineering for the Graduate Assistantship it provided.
x
TABLE OF CONTENTS
DECLARATION OF CO-AUTHORSHIP / PREVIOUS PUBLICATION ... iii
ABSTRACT ... vi
DEDICATION ... viii
ACKNOWLEDGMENT ... ix
LIST OF FIGURES ... xiii
LIST OF TABLES ...xvi
LIST OF ABBREVIATIONS ... xvii
CHAPTER 1. INTRODUCTION ... 1
1.1 Overview ... 1
1.2 Research Motivation ... 3
1.3 Problem Statement ... 4
1.4 Research Objective and Scope ... 5
1.5 Research Gaps and Novelty ... 8
1.6 Thesis Hypothesis ... 10
CHAPTER 2. LITERATURE REVIEW ... 12
2.1 Overview ... 12
2.2 Big Data Analytics in Complex Systems-Related Domains ... 12
2.3 Data Mining, Artificial Intelligence, Machine Learning, and Neural Networks (Deep Learning) ... 16
2.3.1 Data Mining ... 17
2.3.2 Artificial Intelligence ... 18
2.3.3 Machine Learning (ML) ... 19
2.4 Neural Networks ... 20
2.5 Manufacturing Systems Paradigms... 24
2.6 Cyber-Physical Systems (CPSs) ... 26
2.7 Internet of Things (IoT) ... 27
2.8 Cloud Computing (CC) ... 28
2.9 Big Data Analytics for Healthcare ... 30
CHAPTER 3. RESEARCH METHODOLOGY ... 31
3.1 Overview ... 31
3.2 Research Plan ... 31
3.3 Manufacturing System ... 35
3.3.1 Big Data Predictive Analytics Workflow ... 35
xi
3.3.3 Convolutional Neural Network (CNN) ... 41
3.4 Healthcare ... 42
3.4.1 IDEF0 for Healthcare ... 42
3.4.2 Naive Bayes classifier ... 44
3.4.3 Support Vector Machine (SVM) ... 44
CHAPTER 4. MANUFACTURING SYSTEMS APPLICATION... 46
4.1 Overview ... 46
4.2 Case Study 1 ... 48
Big Data Analytics for Defects Detection in Manufacturing Systems (Industry 4.0). (Abou Tabl et al. 2019) ... 48
4.2.1 Abstract ... 48
4.2.2 Problem Definition ... 48
4.2.3 Introduction ... 49
4.2.4 Background ... 51
4.2.5 Materials and Methods ... 53
4.2.6 Model Architecture - Methodologies and Model Design... 57
4.2.7 Tuning the Model Hyper parameters ... 60
4.2.8 Results ... 60
4.2.9 Conclusion ... 62
CHAPTER 5. HEALTH INFORMATICS APPLICATION ... 63
5.1 Overview ... 63
5.2 Case Study 2 ... 64
A machine learning approach for identifying gene biomarkers guiding the treatment of breast cancer. (Tabl et al. 2019) ... 64
5.2.1 Abstract—Objective... 64
5.2.2 Background ... 64
5.2.3 Materials and Methods ... 66
5.2.4 Results and Discussion... 69
5.2.5 Biological Insight ... 72
5.2.6 Conclusion ... 80
5.3 Case Study 3 ... 81
A novel approach for identifying relevant genes for breast cancer survivability on specific therapies. (Tabl et al. 2018) ... 81
5.3.1 Abstract ... 81
5.3.2 Background ... 81
xii
5.3.4 The bottom-up Multi-class Classification approach ... 85
5.3.5 Feature Selection ... 90
5.3.6 Class Imbalance ... 90
5.3.7 Classification ... 90
5.3.8 Results and Discussion... 91
5.3.9 Biological Insight ... 97
5.3.10 Conclusion ... 99
5.3.11 Supplementary Materials ... 99
CHAPTER 6. CONCLUSION ... 105
6.1 Overview ... 105
6.2 Novelties and Contributions ... 105
6.2.1 Manufacturing Domain ... 105
6.2.2 Health Informatics Domain ... 105
6.3 Research Significance and Benefits... 106
6.3.1 Manufacturing Domain ... 106
6.3.2 Health Informatics Domain ... 107
6.4 Limitations... 107
6.5 Future Work ... 108
6.6 Conclusion ... 108
REFERENCES ... 110
APPENDIX A: SAMPLE OF PATIENTS GENE EXPRESSION AND CLINICAL DATA ... 122
APPENDIX B: COMPUTE CANADA SETUP AND CNN CODE FOR MANUFACTURING SYSTEM (SAMPLE) ... 124
A. Compute Canada Setup (Sample) ... 124
B. CNN Code (Sample) ... 124
C. CNN Testing Code (Sample) ... 128
D. CNN Web Cam Code (Sample) ... 130
E. CNN Code Results (Sample) ... 132
APPENDIX C: CLASS IMBALANCE TECHNIQUES FOR HEALTH INFORMATICS SYSTEM (SAMPLE) ... 133
A. Over-sampling with synthetic data ... 133
B. Using a cost-sensitive classifier ... 133
C. Resampling ... 134
xiii
LIST OF FIGURES
Figure 1. Data, information, knowledge, and insight. ... 1
Figure 2. Extracting business value (fifth V) from the four main V’s of big data by IBM (Steve Chadwick 2016). ... 3
Figure 3. Significant applications of big data. ... 6
Figure 4. Components of smart manufacturing (Industry 4.0). ... 12
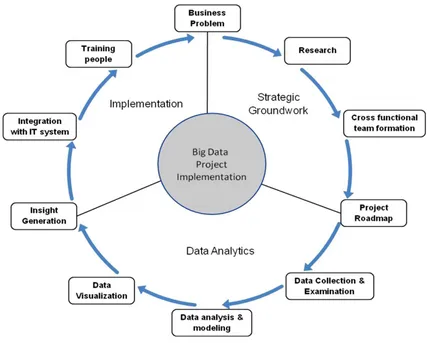
Figure 5. Big Data project implementation phases (Dutta & Bose, 2015). ... 13
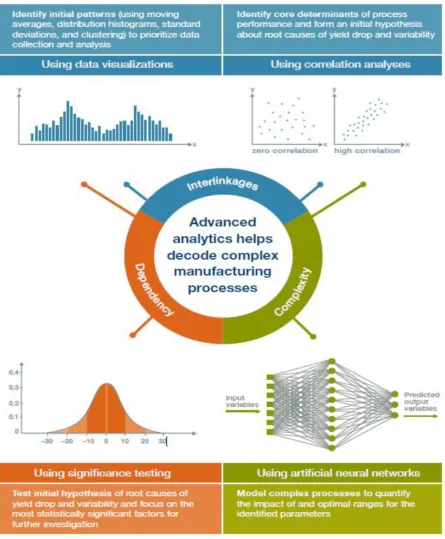
Figure 6. Advanced analytics for complex manufacturing processes (Auschitzky et al., 2014). ... 14
Figure 7. The framework of big data in PLM (J. Li et al., 2015). ... 15
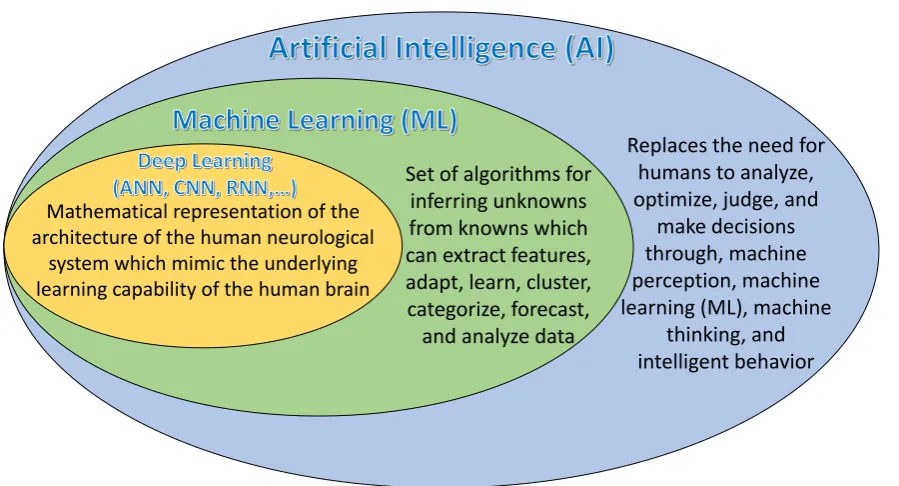
Figure 8. The relationship among different AI disciplines. ... 16
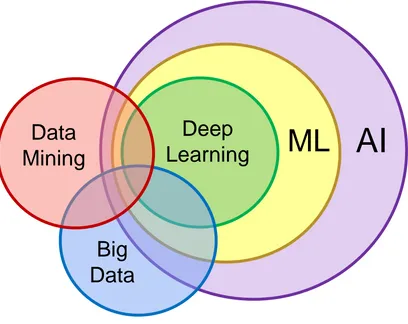
Figure 9. Venn diagram for AI, DM, and big data. ... 18
Figure 10. Human neuron and A multilayer perceptron (MLP) with two hidden layers (Liu et al. 2018). ... 22
Figure 11. 2D data set displayed on a graph. ... 23
Figure 12 Manufacturing systems paradigms positioning. ... 25
Figure 13. Cyber-Physical System structure (Gölzer et al., 2015). ... 27
Figure 14. Cloud Computing (“Cloud Computing,” 2016)... 29
Figure 15. Research plan. ... 32
Figure 16. IDEF0 for big data analytics for both domains. ... 33
Figure 17. Detailed IDEF0 for big data analytics for both domains. ... 34
Figure 18. Zachman framework. ... 35
Figure 19. Big Data analytics predictive workflow. ... 36
Figure 20 IDEF0 for smart manufacturing system. ... 36
Figure 21. Detailed IDEF0 for the smart manufacturing case study. ... 38
Figure 22. IDEF0 for data classification part. ... 40
Figure 23. Convolution neural network (CNN) layers (Jermyjordan 2019). ... 41
Figure 24. IDEF0 for the healthcare section (gene biomarkers). ... 42
Figure 25. The optimal hyperplane for binary classification by SVM (Liu et al. 2018). ... 45
Figure 26. Benefits of big-data analytics techniques (NIST, 2018). ... 47
Figure 27. iFactory at IMS lab, University of Windsor. ... 50
Figure 28 History of the four industrial revolutions. ... 52
Figure 29. Upgrading existing manufacturing systems (EigenInovations 2019). ... 54
Figure 30. Real-time /Non-real time data analytics (Steve Chadwick 2016). ... 55
Figure 31. Real-time monitoring using data analytics (Steve Chadwick 2016). ... 55
Figure 32. Normal class, good image (left), and defected class, bad image (right). ... 56
Figure 33. Structure of convolutional neural networks (CNN) (FreeCodeCamp, 2019). ... 57
xiv
Figure 35. Rectified Linear Unit RELU. ... 59
Figure 36. Softmax activation function. ... 59
Figure 37. Results based on the accuracy, batch size, and the number of epochs with dropout 0.1. .... 61
Figure 38. Results based on the accuracy, batch size, and the # of epochs with dropout 0.2. ... 62
Figure 39. Patient class distribution. ... 67
Figure 40. Multi-Class classification model with performance measures. ... 71
Figure 41. Node Four DS vs. Rest with six genes relations matrix. ... 73
Figure 42. Circos plot for the biomarker genes in node number two for the DR samples based on the correlation coefficient among genes expressions (p<0.05). ... 75
Figure 43. Circos plot for the biomarker genes in node number two for the Rest samples based on the correlation coefficient among genes expressions (p<0.05). ... 75
Figure 44. Circos plot for the biomarker genes in node number three for the LH samples based on the correlation coefficient among genes expressions (p<0.05). ... 76
Figure 45. Circos plot for the biomarker genes in node number three for the Rest samples based on the correlation coefficient among genes expressions (p<0.05). ... 76
Figure 46. Boxplots for the nine biomarker genes in node number three show the minimum, first quartile, median, third quartile, and maximum gene expression values for each group of samples (LH vs Rest). ... 77
Figure 47. Boxplots for the 10 biomarker genes in node number one show the minimum, first quartile, median, third quartile, and maximum gene expression values for each group of samples (DH vs Rest). ... 78
Figure 48. Boxplots for the 14 biomarker genes in node number two show the minimum, first quartile, median, third quartile, and maximum gene expression values for each group of samples (DR vs Rest). ... 79
Figure 49. The distribution of breast cancer subtypes samples in each class. ... 83
Figure 50. The distribution of breast cancer subtypes samples in each treatment therapies samples. .. 84
Figure 51. Percentages of patient class distribution. ... 85
Figure 52. Schematic representation of the proposed models based on the linkage type. ... 86
Figure 53. The five linkage types: Single, Complete, Average, Centroid, and Ward’s linkage. ... 88
Figure 54. Ward’s linkage model: classification model with performance measures... 92
Figure 55. Ward’s Linkage model DR vs. (DS, LS) Node with five genes relations matrix. ... 94
Figure 56. Boxplot for the biomarker genes in Ward’s linkage model shows the minimum, first quartile, median, third quartile, and maximum gene expression values for each group of samples (DH vs. LH) and (DR vs. (DS, LS)). ... 95
Figure 57. Circos plot for the biomarker genes in Ward’s linkage model for the DS class samples based on the correlation coefficient among genes expressions (p<0.05). ... 96
Figure 58. Circos plot for the biomarker genes in Ward’s linkage model for the LS class samples based on the correlation coefficient among genes expressions (p<0.05). ... 96
Figure 59. Network genes pathway that includes most frequently altered neighbour genes for (DSCAM, MARK2, ROBO1). ... 98
xv
xvi
LIST OF TABLES
Table 1. A sample of the literature review. ... 9
Table 2. Features comparison of DML, FMS, and RMS (Koren & Shpitalni, 2010). ... 24
Table 3. Manufacturing systems paradigms (H. A. ElMaraghy, 2005). ... 26
Table 4. Results (Accuracy and loss) With different batch sizes, Epochs, and Drop out. ... 60
Table 5. list of classes with the number of samples in each class, with the number of genes for each class after filter feature selections. ... 66
Table 6. illustrates the results of using mRMD 2.0 vs mRMR on each node then applying random forest classifier on each node. ... 69
Table 7. Gene biomarkers for each class versus the rest at each node. ... 70
Table 8. Comparison of the standard classifiers at each node of the proposed model. ... 72
Table 9. Class list with the number of samples in each class. ... 83
Table 10. Computing the distance between each pair of classes; di,j is the distance between classes i and j. ... 87
Table 11. Ward ‘s linkage model: 37 biomarker genes. ... 93
Table 12. Single linkage model: 41 biomarker genes. ... 99
Table 13. Complete linkage model: 31 biomarker genes. ... 99
Table 14. Average linkage model: 34 biomarker genes. ... 100
Table 15. Centroid linkage model: 49 biomarker genes. ... 100
Table 16. A sample of the patient's clinical data. ... 122
xvii
LIST OF ABBREVIATIONS
AI Artificial Intelligence ANN Artificial Neural Network BC Breast Cancer
BD Big Data
BDA Big Data Analytics BOL Beginning Of Life
CBDM Cloud-Based Design and Manufacturing CC Cloud Computing
CNC Computer Numerically Controlled CNN Convolutional Neural Networks CPS Cyber-Physical Systems
DH Deceased and Hormone DL Deep Learning
DML Dedicated Manufacturing Lines DPI Dot Per Inch
DR Deceased and Radio DS Deceased and Surgery DSS Decision Support System EOL End Of Life
FMS Flexible Manufacturing Systems GD Gradient Descent
HaaS Hardware As A Service
xviii
I4.0 Industry 4.0
IDEF0 Function modelling methodology which refers to “ICAM DEFinition for Function Modeling" where ICAM is an acronym for "Integrated Computer Aided Manufacturing.” IG Information Gain
IMS Intelligent Manufacturing Systems IoT Internet of Things
IP Internet Protocol
KDD Knowledge Discovery in Databases KNN K Nearest Neighbor
LH Living and Hormone LR Living and Radio LS Living and Surgery MAS Multi-Agent Systems ML Machine Learning MOL Middle Of Life
MRI Magnetic Resonance Imaging
mRMD Maximum Relevance Maximum Distance mRMR Minimum Redundancy Maximum Relevance NIST National Institute of Standards and Technology NN Neural Networks
NSF National Science Foundation PLM Product Lifecycle Management
xix
RMS Reconfigurable Manufacturing Systems RNN Recurrent Neural Networks
SGD Stochastical Gradient Descent
SMOTE Synthetic Minority Over-Sampling Technique SVM Support Vector Machine
1
CHAPTER 1. INTRODUCTION
1.1
Overview
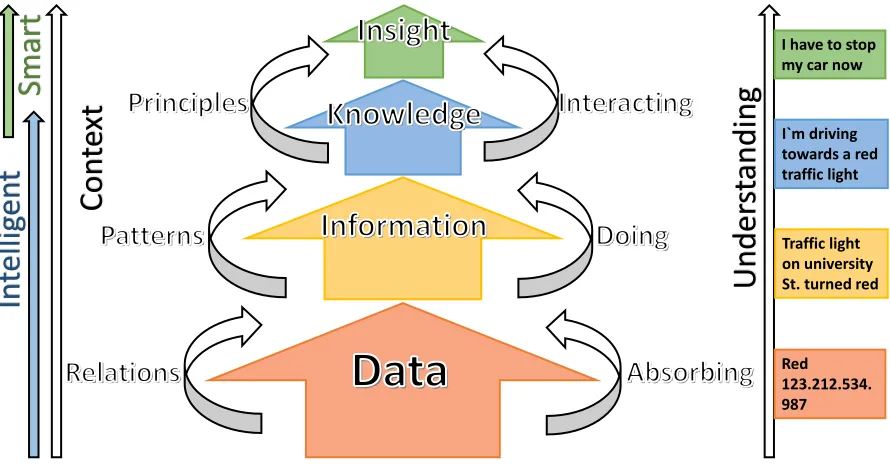
Data is a simple isolated fact that is not significant alone because it does not relate to other data and comes as raw observations, statistics, and measurements. These facts (data) are put, related, combined, and connected in a context, and information appears after the understanding of these relations. This information will help to identify patterns. By processing, investigating, and studying these patterns, we acquire knowledge. With a complete understanding of the outcomes and effects of such knowledge, future consequences can be predicted, decisions can be made, and choosing between alternatives become more comfortable, which will all lead to insight (ElMaraghy 2009).
Therefore, based on these definitions, it is clear that data is the primary source of information, which, in turn, is the primary source of knowledge, which is the primary source of insight. This hierarchy is shown in Figure 1 below. It is clear that the main reason for having the data, information, and knowledge is to have the ability to make the correct decisions.
11
Con
te
xt
Under
st
and
ing
Red 123.212.534. 987 Traffic light on university St. turned red I`m driving towards a red traffic light I have to stop my car now
In
tellig
en
t
Smart
Figure 1. Data, information, knowledge, and insight.
2
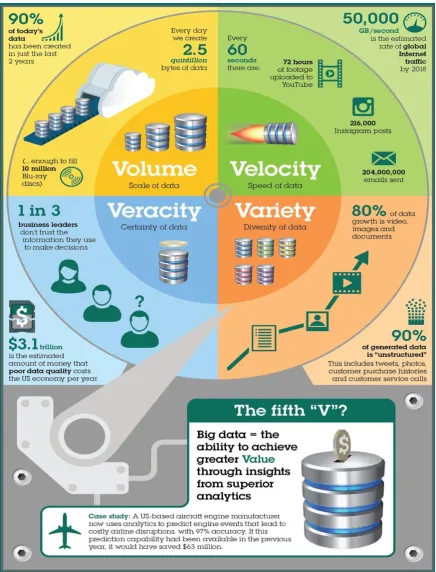
variety means the data exists in different formats such as structured, unstructured, or semi-structured (Dumbill 2013).
According to the extensive use of big data in many domains, researchers identified some other dimensions other than the three Vs. These new dimensions are value, validation, verification, veracity, vision, and volatility. From the engineering point of view, these new dimensions (the new Vs) provide a better means of characterization for the data collected from and about manufacturing applications and processes (Berman 2013), (Zheng et al. 2013).
3
Figure 2. Extracting business value (fifth V) from the four main V’s of big data by IBM (Steve Chadwick 2016).
1.2
Research Motivation
4
known as relational database management systems (RDBMS), big data cannot be analyzed using those traditional methods. As big data requires special means of storage and analysis because it is generated in a different format from small data and contains a lot of noise and redundancy in addition to useful information. Big data requires preprocessing (which includes filtering and indexing) before and after storing it in a big-data warehouse for analysis (Santos et al. 2017). The big-data storage phase must be involving the use of the fastest and most reliable computer network protocols to access and analyze the data easily. The storage mechanism has to be dynamic to adopt modern and dramatically-changeable networking technology. The streamlines of data have to be stored in modern storage servers with parallel processors for multitasking purposes. Because the amount of data is huge, the most efficient algorithms have to be utilized to store and process the data to produce reports for observers and decision makers quickly. Many statistical and computer science approaches are used to analyze the big data in all fields. However, there is a difference between managing big data in different domains, such as the manufacturing and healthcare fields and the management of big data in other fields because, in manufacturing, fast decision-making leads to not only cost saving but also high levels of sustainability and safety, which is a necessity. Hence, the most reliable and efficient algorithm has to be selected for collecting, preprocessing, storing, and analyzing data and making informed decisions in this area. Reducing processing time is the biggest challenge in this field, such as the time it takes for driverless, autonomous cars to make decisions. Mistakes can cost lives.
Therefore, this research is motivated by big-data analytics, which is the main enabler of many complex systems, such as smart manufacturing systems (the fourth industrial revolution), health informatics, and many others. The fourth industrial revolution is known as smart manufacturing (Industry 4.0). The idea behind Industry 4.0 is that it is different from the first three industrial revolutions, which were the results of advancements in mechanization, electricity, and IT, respectively. Now, the introduction of the internet of things (IoT) and cyber-physical systems (CPSs) to the manufacturing environment is leading to a fourth industrial revolution. In Industry 4.0, field devices, machines, production modules, and products are comprised of CPSs that autonomously exchange data and information, trigger actions, and control each other independently.
Moreover, one essential enabler of sustainable manufacturing in smart manufacturing (Industry 4.0), which is the scope of this research, is reliable systems for storing, analyzing, and synthesizing very large amounts of data (big data up to the scale of terabytes) throughout the whole manufacturing system lifecycle.
1.3
Problem Statement
5
there cannot be one approach that solves all manufacturing decision-making problems. Some complex systems are not yet ready to manage and take full advantage of the big data that is available to them due to the lack of pipelined data acquisition, processing, analysis, and finally, decision-making procedures that are tailored to the specific manufacturing problem.
Therefore, it is necessary to adopt smart decision-making tools for big data that are tailored to the specific manufacturing problem of how to be responsive and adaptive in a dynamic market and continuous technology development. To achieve this purpose, there is a need to integrate cutting-edge technologies, such as big data analytics, machine-learning tools, and the IoT, to accomplish a pipelined process that can be used to solve the decision-making issues that are faced in modern complex systems. Each system has it is own parameters and characteristics. Such pipeline processes must be able to identify the key characteristics in the system (e.g., the genes related to breast cancer or the vision features of the production line in a manufacturing system) to feed into the learning process. This may require initial human intervention to guide the identification and selection of features that are obtainable and relevant to the prediction problem at hand. Often, the various industries (whether it be manufacturing, healthcare, or otherwise) that desire to take advantage of big data for prediction and quality improvement have no clear idea of the characteristics that might be useful for their desired goal. This phase of handpicking relevant variables, and sometimes even creating new variables that are relevant to the goal of prediction, involve human-guided data mining.
It is essential for modern complex systems to tune their parameters based on the learning process. The development of a continuous learning process that can detect unusual events using the key characteristics of a system and predict outcomes and, hence, make a decision is the goal for our proposed systems. The proposed modern complex system is required to strive to improve performance and report any decline in performance measurements, such as the error, specificity, and sensitivity of the outcomes. Therefore, this work claim is that, currently, whether it is in the healthcare or manufacturing industry, there is a lack of pipelined and problem-specific processes that take full advantage of big data to achieve improved outcomes.
1.4
Research Objective and Scope
6
Big Data
Applications Government Health Care Manufacturing Systems Computer Science Financial Trading Electronic Commerce Telecommunic ation Astronomy • Marketing• Retail production
• …..
• Forecasting churn
• Identify fraud
• …..
• Stock market
• Financial trading
• …..
• Quality check
• Error fixing (Diagnosability)
• …..
• Intelligent recommendation systems
• Search engines
• …..
• Large synoptic survey telescope
• The Sloan Digital Sky Survey of telescopic information
• …..
• Smart cities
• Political election forecasting
• Employment and inflation forecasting
• …..
• Disease surveillance
• Treatment Guidance
• Online diagnosis
• ……
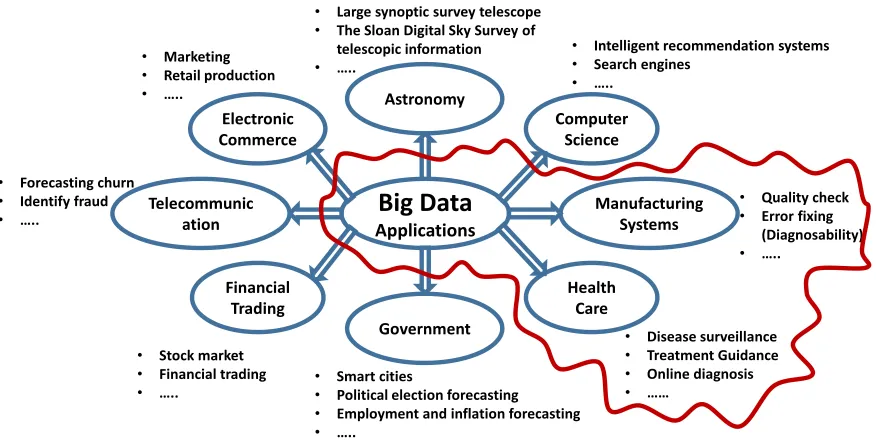
Figure 3. Significant applications of big data.
Big-data analytics is still not widely used in some domains, such as the manufacturing domain, in which the IoT and cloud computing should be integrated into the decision-making process (see the literature survey). These pieces of new technologies can potentially be exploited in modern systems. The essential big-data research is currently concentrated on capturing, processing, and analyzing big data (Li et al. 2017).
The literature has many proposed big-data analytics solutions for complex systems. However, there is a need to come up with comprehensive approaches that can put the different data analytic pieces together and utilize them in an integrative way. A modern complex system can integrate any new learning model and interact with other learning models with minimum human interference.
Nevertheless, the nature of the target outcomes to be improved via big-data analytics are various as well as the types of potential characteristics that are used as inputs, relevant to the outcomes. This makes it difficult to have one single procedure that fits and solves each and every problem in each and every domain. Intelligent outcome-improving decision-making procedures need to be tailored for each and every class of similar industry problems.
7
In summary, the objectives for the manufacturing domain are:
Develop a new method or tool for gathering, analyzing, and processing big data (structured or non-structured) generated from manufacturing system facilities that support real-time decision-making and knowledge discovery using big data and data mining tools.
Develop a tool that will support decision makers in designing and operating their manufacturing systems sustainably as well as economically.
Build an integrative model for complex modern systems, which consists of big data, IoT, CPS, ML and DL. These components are represented in state of the art model for a real-time decision-making process.
Add the missing enablers which iFactory lacks to convert it to Industrial 4.0 (Transfer I3.0 to I4.0).
Extract hidden features in the product, which can predict the unusual situations (e.g. defective vs normal) product to speeds up the prediction performance.
While
the objectives for the health informatics domain are: Develop machine learning models to find gene biomarkers, that are related to breast cancer survivability based on specific treatments.
Develop a hierarchical one-versus-rest model for predicting five-year survival based on the treatment and gene expression.
Develop a Semi-supervised learning model to find borders between classes groups in a multi-class learning problem.
Develop a new method or tool for gathering, analyzing and processing big data (structured or non-structured) generated from a healthcare system.
Develop a model that supports real-time decision-making and knowledge discovery using big data analytics and data mining tools.
8
1.5
Research Gaps and Novelty
From the literature review, it is evident that most researchers consider many things, but not a big-data analytics completely-pipelined process with methods and tools in some domains, such as manufacturing systems. In December 2016 at the IEEE International Conference on Big Data in Washington D.C. The National Institute of Standards and Technology (NIST) presented a summary of the Symposium on Data Analytics for Advanced Manufacturing with the theme of “From Sensing to Decision-Making,” which highlighted the key challenges, issues, and needs for implementing big-data analytics for smart manufacturing systems (Narayanan et al. 2017). Then in 2018, the NIST reported that even when manufacturers have some data analytics tools, which are implemented with technical barriers that prevent the widespread adoption of data analysis in practice, they are not using the scale of big-data nor a real-time making, which has led to limited success because there are delays in the decision-making process (NIST 2018).
Babiceanu proposed future work that focuses on big-data algorithms developed for manufacturing operations (Babiceanu et al. 2016). Also (Qiu et al. 2015) considered the benefits of sharing assets and services by having a system for these assets, an information infrastructure, and finally, a decision support system (DSS) for big data in manufacturing supply chains.
9
Table 1. A sample of the literature review.
Paper
Manufact uring System
CPS IoT Cloud Computing
Big Data
Decision Making National Institute of Standards
and Technology (2018) x x x x x Babiceanu, R. F., & Seker, R.
(2016) x x x x x
Baheti, R., & Gill, H. (2011) x x x x x Gölzer, P., Cato, P., Amberg,
(2015) x x x x x
Wang, L., Törngren, M., Onori,
(2015) x x x x x
Borgia, E. (2014) x x x x x Qiu, X., Luo, H., Xu, G.,
Zhong, R., (2015) x x x x
Xu, X. (2012) x x
Dutta, D., & Bose, I. (2015) x x Kumaraguru & Morris, (2014) x x x
Wu, D., Rosen, D. W., Wang,
L., (2015) x x x x x
For a long time, companies used to get rid of data because they had too much data to manage. However, with the existence of big-data tools like the Spark ecosystem, they can now manage massive amounts and different types of data. The stored data, with its different formats and huge size, complicates processing and analysis. Therefore, some machine-learning tools are used to create metadata catalogues that can help data analysts to develop decision-making models. Therefore, companies tend to use big data only for tracking purposes, not as a basis for improving operations.
10
indicated that they most likely result from data variety, not data volume, because heterogeneous data mixing is more significant than the data volume. Therefore, the emphasis is not on the “big” part of the big data but, rather, the problem of data variety. In these two domains, research gaps are identified as not only the lack of decision-making methods and tools for big data but also how to manage this huge sort of data, starting with collecting, storing, analyzing, securing, and processing this data — taking the variety, velocity, and volume of data into considerations. Finally, integration solutions needed to connect all the data sources (software and hardware technologies) to create data standers that are manageable (Obitko et al. 2013).
It is clear that the industrial automation and manufacturing sector is already a large producer and consumer of a lot of data. During the last few decades, manufacturing companies demonstrate significant productivity gains regarding both improved quality and efficiency based on the utilization of processed data and advanced methods of data analysis. Today, the big-data paradigm is a promising concept for another substantial wave of gains to achieve improved efficiency in design, production, product quality, and achieving customers’ needs. According to (Manyika et al. 2011), big data can help manufacturers to reduce their product development times by 20% to 50%, as well as defects before production through simulation and testing. By using real-time data, companies can also manage demand planning across extended enterprises and global supply chains while reducing defects and rework within production plants (Obitko et al. 2013).
From the above literature, we can claim that the significant gaps in the literature on big-data analytics in the various industries is that there seems to be no published research about the employment of a complete pipeline to take full advantage of big data (concerning volume, variety, and velocity) in real-time decision-making in the manufacturing industry. And also the claim that there could exist a single big-data analytic pipeline that can solve every problem in all domains. Such claims have been made without substantiating them. Our aim in this thesis is to fill this understanding gap and provide a few case studies that support the need for tailoring different data analytic pipelines for different situations and that such pipelines need to be partially human-guided. Nevertheless, some generality can be achieved within classes of similar issues. In particular, in this thesis, we consider case studies in which the desired decision-making problems are based on the classification of the outcomes of interest.
1.6
Thesis Hypothesis
Human-guided big-data analytic pipelines can be used as decision-making tools for specific categories of similar issues that are relevant to the manufacturing and healthcare industries.
11
that extend from data acquisition and feature selection (both human-guided and automatic) to the prediction of the desired outcomes in real-time, which have some degree of generality within the classes of industry issues that are considered here. These pipelines are designed to accommodate large datasets and use cloud-based computational tools to build and select models and use new input data for predicting the desired outcomes.
12
CHAPTER 2. LITERATURE REVIEW
2.1
Overview
In this section, I discuss the main components of big data analytics for complex systems, such as the smart manufacturing complex system (Industry 4.0). A definition and extensive literature review for each component are represented in this chapter.
Figure 4. Components of smart manufacturing (Industry 4.0).
2.2
Big Data Analytics in Complex Systems-Related Domains
13
Figure 5. Big Data project implementation phases (Dutta & Bose, 2015).
14
Figure 6. Advanced analytics for complex manufacturing processes (Auschitzky et al., 2014).
15
availability, and process efficiency in manufacturing systems. (Hazen et al. 2014) Stated that data quality is a significant step in analytics and proposed a method for controlling and monitoring data quality in supply chain practices. Stating the problems and issues and suggestions for research.
(Li et al. 2015) stated that the vast amount of data related to the three main stages of product lifecycle management (PLM), which are beginning of life (BOL), middle of life (MOL), and end of life (EOL), are analyzed and concluded. The framework of big data in PLM is shown in Figure 7 below.
Figure 7. The framework of big data in PLM (J. Li et al., 2015).
16
parallel computation, increasing robustness (the systems degrade smoothly with agent failure), and increasing scalability (agents can be added when required).
(Zhong et al. 2015) proposed a significant big data methodology as a framework with its key stages starting with data collection, cleansing (to remove the noise), compression, classification, pattern recognition, machine learning, KDD, and decision-making.
Techniques and tools are required to process and analyze big data, such as log, text, audio, video, or other files. These tools have some key resources, such as memory, storage, network, and processing capabilities. For example, the most known one is the Apache Spark Ecosystem (Loshin 2013).
2.3
Data Mining, Artificial Intelligence, Machine Learning, and Neural Networks
(Deep Learning)
The new generation of artificial intelligence (AI) simulates, extends, and stretches human intelligence. AI replaces the need for humans to analyze, optimize, judge, and make decisions through machine perception, machine learning (ML), machine thinking, and intelligent behaviour, such that AI ultimately provides intelligence for systems. Therefore, as the most disruptive technology in the world, a new generation of AI technology called AI 2.0, which includes ML, big data, cloud computing, the IoT, and other cutting‐edge AI technologies, is profoundly influencing and changing manufacturing systems worldwide (Cheng et al. 2019). The relationships between different AI disciplines are shown in Figure 8.
Replaces the need for humans to analyze, optimize, judge, and
make decisions through, machine perception, machine learning (ML), machine
thinking, and intelligent behavior Set of algorithms for
inferring unknowns from knowns which can extract features, adapt, learn, cluster, categorize, forecast,
and analyze data Mathematical representation of the
architecture of the human neurological system which mimic the underlying learning capability of the human brain
17
2.3.1
Data Mining
Data mining (DM) is an interdisciplinary task that is usually defined as the process of extracting valid, unknown, precise information from different huge databases to adjust and improve business decision-making (Fayyad et al. 1997). DM is based on computational intelligence, such as artificial neural networks, machines learning (association rules and decision trees), and advanced statistical techniques, such as logistical regression, that have created new intelligent tools for the extraction of useful knowledge and information. Nowadays, and due to a large amount of data generated by complex systems, traditional data analysis methods are no longer the best choice to use. DM approaches have created new intelligent tools for automatically extracting useful information and automatically. Therefore, the main objective of DM is knowledge discovery, and DM methodology is a technique used to extract predictive information and knowledge from databases (Wang 2007).
18
Figure 9. Venn diagram for AI, DM, and big data.
The Venn diagram shown in Figure 9 illustrates the overlapping of multidisciplinary AI, DM, and big data analysis.
2.3.2
Artificial Intelligence
In attempts to make machined have human functions, AI is considered to be an emerging interdisciplinary subject that involves theory, methodology, technology, and system applications that integrate cybernetics, statistics, computer science, mathematical logic, neurophysiology, and other disciplines and is used to mimic, extend, and stretch human intelligence. In industrial engineering, AI is used to make machines do several tasks and become highly human-independent. With that being mentioned, revolutionary AI reduces the time and cost of production and improves the quality of products, and machines can adapt to their surrounding environments, which means they can be aware of any unusual behaviour, decision-making, and most importantly, learn from previous experiences (JU et al. 2018, Zhang et al. 2018).
Data is the new gold, and extracting information from raw data can create revenue for any organization. From predicting customer’s potential product interests to clustering customers for targeted sales packaging, all of these examples of the new dimensions of DM in different industries, and manufacturing systems are not exceptions.
/85
Definitions and
Terminologies
Deep
Learning
ML
AI
Data
Mining
19
The iFactory can generate large amount of data, including performance reports and logs. Machines sensors can also add to that amount of data. Making sense of the generated data requires collaboration from two fields, DM to extract information from the raw data, and big data to facilitate the access to data and store the new data. From this perspective, we are using DM as a tool to extract actionable information from (usually) very big data generated from iFactory. DM is considered to be part of ML.
2.3.3
Machine Learning (ML)
Machine Learning Definition (algorithms for inferring unknowns from knowns). ML represents a powerful set of algorithms that can extract features, adapt, learn, cluster, categorize, forecast, and analyze data, amplifying our understanding of things like obesity and our capacity to make predictions with unprecedented precision. ML application examples include Netflix, Alexa, speech recognition, and Tesla driverless cars.
A keyword in the field of ML is “finding patterns” in big data and using and learning from those patterns to make predictions. These predictions will be decisions or assist humans in making decisions. Therefore, the essence of ML is finding an objective function f that forms the best mapping between an input variable X and an output variable Y (i.e., Y = f(X)). The goal of ML is to find this optimal mapping to enable more predictions of outputs. The types of ML can be classified into three categories (Cheng et al. 2018) based on the differences among input samples:
2.3.3.1
Supervised Learning
If the learning process can be guided by prior knowledge, then this type of ML has supervised learning. The sample I has both an input feature vector xi and a corresponding output label, yi. Because we know label vector yi, a supervised algorithm can learn yi and categorize the new samples that have no label. If the variable yi has a continuous value, then the supervised learning approach involves the use of a regression model while if the value is categorization-based (e.g., “cancer,” “normal” samples or “defected,” “normal”) products, then the supervision problem is called classification. As an example of supervised learning in regression (DeGregory et al. 2018), linear regression is the most commonly-used model for characterizing the relationship between a dependent variable and one or more explanatory variables (Bishop 2006). Logistical regression differs from linear regression by predicting categorical outcomes or classifying outcomes. In obesity, this is most relevant to the classification of obesity-related disease states or risks.
20
2.3.3.2
Unsupervised Learning
Sample i has only an input features vector xi; no corresponding output label yi exists. The goal of the learner is to group all samples in the sample space, using techniques such as cluster analysis.
In this proposal, we have an unsupervised classification model showcased in Case Study 3, “A novel approach for identifying relevant genes for breast cancer survivability on specific therapies.”
2.3.3.3
Semi-Supervised Learning
Semi-supervised learning can also be classified into a single category similar to the above two categories of ML. Here, semi-supervised learning possesses features and partial labels, and it contains classification, regression, and clustering methods. Only one or two of them are included in supervised learning and unsupervised learning (Yu et al. 2018).
In this proposal, we have a semi-supervised classification model showcased in Case Study 3, “A novel approach for identifying relevant genes for breast cancer survivability on specific therapies.”
2.3.3.4
Decision Tree Analysis
Decision tree learning is a predictive algorithm that uses both categorical and numerical data to assign samples to specific classes (Bishop 2006). Here, we will use decision trees to group subjects based on their characteristics into classes of varying health risks based on blood pressure and body fat percentage cut-offs. Unlike regression models, which rely on the minimization of error through least squares, decision tree analysis involves determining thresholds derived from input data. For example, falling above or below the threshold for patient age moves the patient into the appropriate class. While decision trees are effective standalone models for classification, the algorithm’s performance is, in some cases, improved by using random forests, which aggregate the results of randomly-generated decision trees to produce an effective model (Bishop 2006).
2.4
Neural Networks
21
Neural networks are used to predict both continuous numerical and categorical data. There are two phases of effective neural network development. The first phase is what is known as training or learning. During the training phase, weights that are associated with connections between nodes are adjusted until the model performs well. This completed model is then applied to new data to make a prediction. This application of the model is called the testing phase. There are many variations of neural networks that are adapted for different conditions and applications (Bishop 2006).
2.4.1.1
Deep Learning
For many tasks, it is difficult to know what features should be extracted to feed to the AI algorithms. Aiming at learning feature hierarchies with features from higher levels of the hierarchy formed by the composition of lower level features (Bengio 2009), deep learning methods have the potential to overcome the deficiencies above in current intelligent fault diagnosis methods (Hinton et al. 2006). In deep learning methods, automatically learning features at multiple levels of abstraction enable systems to learn complex functions. For machines to learn about these complicated functions, deep architectures are needed that are composed of numerous levels of non-linear operations. Through the deep architectures, deep learning-based methods can adaptively capture representative information from natural input signals through non-linear transformations and approximate complex non-linear functions with a small margin of error. Deep learning is part of ML. It was invented based on an artificial neural network (ANN) with multiple processing layers that tries to obtain hierarchical data representations. There are deferent deep learning techniques, such as CNN, recurrent neural networks (RNNs), and ANNs. The following is a brief about deep learning techniques (Zhao et al. 2016).
2.4.1.2
Convolutional Neural Network (CNN)
22
the objects regardless of their places in the images and to decrease the length of the feature map. This reduces the number of the model’s parameters.
2.4.1.3
Recurrent Neural Networks (RNNs)
(Schmidhuber 2015) Indicated that the RNN is one of the deepest neural networks. It can also address and create memories of sequences of input patterns. Connections between units from the directed cycle can also be built using RNNs.
Different from a primary neural network in which multi-layer perceptron can only map from input data to target vectors, an RNN can map from the entire history of previous inputs to target vectors in principle and allow the memory of prior inputs to be kept in the network’s internal state. RNNs can be trained by backpropagation through time for supervised tasks with sequential input data and target outputs.
2.4.1.4
Artificial Neural Networks (ANNs)
ANNs are believed to be the most commonly-used algorithm (Hopfield 1982). In its most popular form, there are three components in an ANN: the input layer, a hidden layer, and the output layer. Units in the hidden layer are called hidden units because their values are not observed. ANN is an intelligence technique based on several simple processors or neurons. The circles labelled “+1” are intercept terms and are called bias units. Figure 10(a) is a human neuron, and Figure 10(b) is a simple model of an ANN. aij represents the jth neuron unit in the ith layer.
Figure 10. Human neuron and A multilayer perceptron (MLP) with two hidden layers (Liu et al. 2018).
The “neuron” in ANN is a computational unit that takes as input x1; x2; x3 and an intercept term. The output y can be obtained using the following formula:
𝑦 = 𝑓(𝑊
𝑇𝑥) = 𝑓 ∑ 𝑊
𝑖𝑥
𝑖+ 𝑏
3𝑖=1
( 1 )
23
layer. This interconnection is what simulates and achieves human neurological performance. W is the weight matrix, where the values are updated during the learning process in an iterative procedure. W is updated during the forward-backward learning process in which the ANN computes the error and improves the learning rate based on a cost function (Liu et al. 2018). Many cost functions can be used. Gradient descent (GD) and Stochastic gradient descent (SGD) are commonly used to optimize cost reduction based on the learning rate (α). The vanishing problem in GD during deeper ANNs pushed for better optimization methods, such as dropout and ADAM (a method for stochastic optimization method (Kingma et al. 2014).
2.4.1.5
K Nearest Neighbour
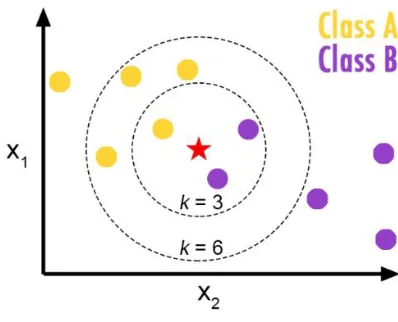
K nearest neighbour (KNN) the idea of this classifier is simple, highly efficient and effective. It assigns a class to a sample point based on the smallest distance to a previously classified neighbouring point. In two-dimensional dataset in Figure 11. A simple Euclidean distance can be used to calculate the distance between the test data and the input data for class prediction.
KNN was presented by (Fix et al. 1951). However, it is still widely used for ML applications, such as pattern recognition, text categorization, ranking models, and object recognition and event recognition applications. (Bhatia 2010) discussed many different variations of KNN that were derived from the basic model in detail. The basic and straightforward characteristics of this approach are one of its main advantages. The biggest drawback is that it is heavy on computation time because of the exhaustive distance calculation between every data point. However, because of the evolutional computational resources, it is still feasible to use KNN.
White noise is one of the most common problems encountered in data processing, especially image processing. In image processing, filters for noise reduction and eliminations are designed based on KNNs. NVIDIA implemented a filter based on KNN to remedy this issue (Kharlamov et al. 2007). Deng et al. focused on scaling a KNN for big data applications. The results showed that the proposed
24
KNN classification worked well in terms of accuracy and efficiency and, thus, its appropriateness for use in dealing with big data.
2.5
Manufacturing Systems Paradigms
Nowadays, manufacturing companies are facing frequent increasing and unpredictable market changes due to market competition and demand for new products, new product variants, and customized products. Therefore, to be competitive, manufacturers must have high-quality manufacturing systems and reasonable product prices but also the ability to quickly respond to market changes from the demand side, as well as from the variety perspective. Therefore, manufacturing systems should be immediately adaptable to market changes, product changes, government regulation changes, and system failures (Koren et al. 2010).
In this section, we identify three distinct manufacturing systems paradigms: dedicated manufacturing lines (DMLs), flexible manufacturing systems (FMSs), and reconfigurable manufacturing systems (RMSs). A comparison between the three paradigms is shown in Table 2 Below.
Table 2. Features comparison of DML, FMS, and RMS (Koren & Shpitalni, 2010).
Dedicated FMS/CNC RMS/RMT
System structure Fixed Changeable Changeable
Machine structure Fixed Fixed Changeable
System focus Part Machine Part family
Scalability No Yes Yes
Flexibility No General Customized (around
a part family) Simultaneously
operating tools Yes No Possible
Productivity Very high Low High
Cost per part Low (For a single part,
when fully utilized)
Reasonable (Several parts simultaneously)
Medium (Parts at variable demand)
25
varieties) production (i.e., whenever we need to have many varieties, using a DML will not be the right solution. Therefore, DMLs have high throughput and limited flexibility (Koren et al. 2010).
The FMS paradigm has a changeable system structure and a fixed machine structure. Therefore, it can be used to solve the flexibility issue of the DMLs by providing the ability to produce varieties of goods in reasonable volumes. This can be done through general-purpose computer numerically controlled (CNC) machines, but it increases the overall system cost. Therefore, FMSs solve the flexibility issue but create high equipment costs and do not have high throughput like DMLs.
On the contrary, the last manufacturing system paradigm is RMSs. It fills the gaps of both the previous paradigms by having the ability and flexibility of production when needed and as needed (ElMaraghy 2005). As shown in Figure 12 below, DMLs (mass production) have a low scope and high scale (minimal varieties) while FMSs (mass customization) have a medium scope and medium scale. The Job Shop has a high scope and low scale (minimal quantity), and finally, RMSs can fit anywhere in the chart by adjusting scale and scope.
Figure 12 Manufacturing systems paradigms positioning.
The definitions and the objectives of the main three manufacturing systems paradigms, DML, FMS, and RMS, are summarized by (ElMaraghy 2005) in Table 3 below.
Job Shop
Flexible
Manufacturing
System (FMS)
Reconfigurable
Manufacturing System
(RMS)
14
Dedicated
Manufacturing
Lines (DML)
Product
ion
V
olum
e
(Scal
e)
26
Table 3. Manufacturing systems paradigms (H. A. ElMaraghy, 2005).
Paradigm Definitions and objectives
Dedicated manufacturing lines (DMLs)
A machining system designed for the production of a specific part type at high volume.
Cost-effectiveness is the driver achieved through pre-planning and optimization.
Flexible manufacturing systems (FMSs)
A Flexible Manufacturing System is an integrated system of machine modules and material handling equipment under computer control for the automatic random processing of palletized parts.
The objective is to cost-effectively manufacture several types of parts, within pre-defined part families that can change over time, with minimum changeover cost, on the same system at the required volume and quality. Reconfigurable
manufacturing systems (RMSs)
A Reconfigurable Manufacturing System is designed for a fast change in structure to quickly adjust production functionality and capacity, within a part family, in response to changes in market requirements.
The objective is to provide precisely the functionality and capacity that is needed when it is required.
2.6
Cyber-Physical Systems (CPSs)
One of the main challenges of Industry 4.0 is CPSs (Chen 2017), which is defined by the US National Science Foundation (NSF) as the tight conjoining of and coordination between computational and physical resources (NSF 2018). Lee et al. investigated the challenges that faced CPSs and found that the main problem is the fact that the data generated from different sources have orientations. Current-day abstraction systems do not work when it comes to the calls and thread methods. Other challenges from the system-design and architecture perspective, specifically computer networking, make current manufacturing systems incompatible with CPS (Lee 2008). (Lv et al. 2019) applied a CPS model to an automated electric vehicle using a ML approach. The method optimized different CPS parameters to improve different performance objectives, such as dynamic vehicle performance, and drivability, along with varying styles of driving. The results validate the feasibility and effectiveness of the proposed CPS-based method for three driving techniques, which are aggressive, moderate, and conservative (Lv et al. 2019).
27
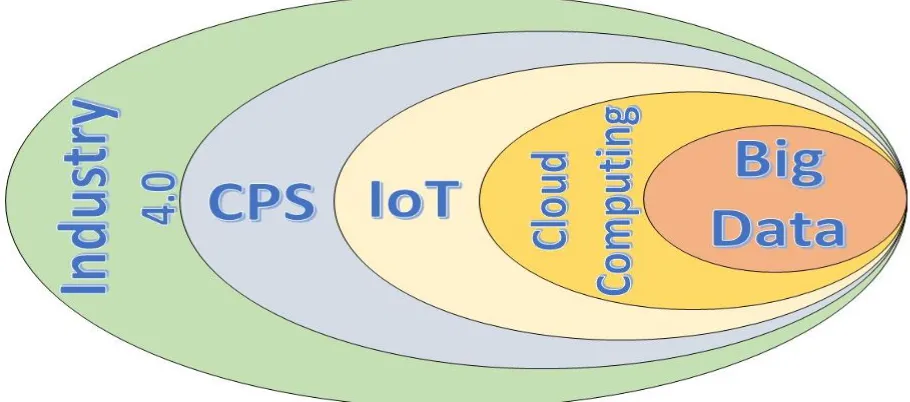
resources (Baheti et al. 2011). While (Lee et al. 2013) introduced recent advances in manufacturing informatics related to big data, cyber-physical-systems, predictive manufacturing systems, and Industry 4.0 and stated that due to the lack of smart analytical tools, many manufacturing systems are not prepared to deal with big data because it involves more than just connecting machines to sensors or connecting machines to each other. It provides users with the vision needed to make improved decisions. They also enhanced the manufacturing information system with 5C roles, which are (1) connection (networks and sensor), (2) cloud (data availability), (3) content (meaning and correlation), (4) community (social and sharing), and (5) customization (value and personalization). (Lee et al. 2014) Introduced a cyber-physical system framework for self-aware and self-maintaining machines, which is defined as a system that can self-assess its degradation and strengths and make smart maintenance decisions to avoid possible problems. Because the CPS is still in the initial phases of expansion, it is important that we define CPS enablers. Cloud computing, IoT, and big data (see Figure 13) are examples of CPSs. Each of these terms is introduced in the following sections.
Figure 13. Cyber-Physical System structure (Gölzer et al., 2015).