Two Step Approach for Emotion Detection on Twitter
Data
Matla Suhasini
Assistant Professor, CSE Dept.
Stanley College of Engineering and Technology for
Women
Hyderabad, India
Srinivasu Badugu
Associate Professor, CSE Dept.
Stanley College of Engineering and Technology for
Women
Hyderabad, India
ABSTRACT
“Emotional states of individuals, also known as moods, are central to the expression of thoughts, ideas and opinions, and in turn impact attitudes and behavior”. In this paper we have proposed a method which detects the emotion or mood of the tweet and classify the twitter message under appropriate emotional category. Our approach is a two-step approach, it is so called as it uses two approaches for the classification process, one is Rule Based approach and the other is Machine Learning approach. The first approach is the Rule Based Approach (RBA), our minor contributions in this approach are pre-processing, tagging, feature selection and Knowledge base creation. Feature selection is based on tags. Our second approach is Machine Learning Approach (MLA), in this the classifier is based on supervised machine learning algorithm called Naïve Bayes which requires labeled data. Naïve Bayes is used to detect and classify the emotion of a tweet. The output of RBA is given to MLA as input because MLA requires labeled data which we have already created through RBA. We have compared the accuracies of both the approaches, observed that, with the rule based approach we are able to classify the tweets with accuracy around 85% and with the machine learning approach the accuracy is around 88%. Machine learning approach performance is better than rule based approach, the performance has been improved as we have removed the error data while training the model. The approaches are involved with the concepts of Natural Language Processing, Artificial Intelligence, and Machine Learning for the development of the system. Our major contributions in this paper are detection of emotion for non hashtagged data and the labeled data creation for machine learning approach without manual creation.
General Terms
Knowledge Base, Seed List, Twitter Data, Machine Learning
Keywords
Emotion, Natural Language Processing, POS Tagging
1.
INTRODUCTION
The development of social network platforms has given people a new way to generate and consume a great deal of information on the web. In the past, people used to get information from portal websites. A large number of websites provide a long list of topics varying from politics to entertainment [2]. These traditional online information sources are useful but less efficient because they often contain redundant information. However, since the arrival of online social network platforms, people tend to get information from these platforms because of their fast and efficient features.
Microblogging is an increasingly popular form of communication on the web. It allows users to broadcast brief text updates to the public or to a selected group of contacts
[3]. A large number of social network platforms such as Twitter, Google+, and Facebook provide information for users. Among all Twitter is the most popular microblogging platform in the world. It is also the fastest growing social network platform and has a dominant position in the area of microblogging [2]. Compared with regular microblogging platforms, Twitter messages commonly referred to as tweets are much shorter. This feature makes Twitter easier for people to get the main point from the massive amount of information available online. Twitter users can follow whichever people and information source they prefer [3,4]. Twitter thus has become a powerful platform with many kinds of information from worldwide breaking news to purchasing products at home [15]. Researchers also noticed that tweets often convey pertinent information about the user‟s emotional states [11]. Emotion analysis on Twitter has thus become an important research issue in the microblogging area [1].
Despite the diversity of uses emerging from such a simple communication channel, it has been noted that tweets normally tend to fall in one of two different content camps: users that microblog about themselves and those that use microblogging primarily to share information [3]. In both cases, tweets can convey information about the mood state of their authors. Even when a user is not specifically microblogging about their personal emotive status, the message can reflect their mood. As such, tweets may be regarded as microscopic instantiations of mood. It follows that the collection of all tweets published over a given time period can unveil changes in the state of public mood at a larger scale [1].
Twitter allows individuals to express their opinions, feelings, and thoughts on a variety of topics in the form of short text messages. These short messages may also include the emotional states of individuals (such as happiness, anxiety, and depression) as well as the emotions of a larger group (such as opinions of people in a certain country or affiliation). In fact, Twitter can be considered as a large repository that includes a rich ensemble of emotions, sentiments and moods. For example the tweet "Great Christmas spent with my amazing family" expresses a happy mood and the tweet "Feelings Hurt Tonight!" expresses sadness [3,4].
focused on microbloggers response to the death of Michael Jackson or a political election in Germany, while others analyze broader social and economic trends, such as the relationship between Twitter mood and both stock market fluctuations and consumer confidence and political opinion. The results generated via the analysis of such collective mood aggregators are compelling and indicate that accurate public mood indicators can be extracted from online materials. Using publicly available online data to perform emotion analyses significantly reduces the costs, efforts and time needed to administer large-scale public surveys and questionnaires. These data and results present great opportunities for psychologists and social scientists [5, 6, 7].
2.
RELATED WORK
Some researchers have explored social media such as:
The study led by Maryam Hasan et al [2] proposed a new approach for automatically classifying text messages of individuals to infer their emotional states. To model emotional states, they utilized the well-established Circumplex model that characterizes affective experience along two dimensions: valence and arousal. They selected Twitter messages as input data set, as they provide a very large, diverse and freely available ensemble of emotions. Using hash-tags as labels, their methodology trains supervised classifiers to detect multiple classes of emotion on potentially huge data sets with no manual effort by using weka tool. They investigated the utility of several features for emotion detection, including unigrams, emoticons, negations and punctuations. To tackle the problem of sparse and high dimensional feature vectors of messages, they utilize a lexicon of emotions. They have compared the accuracy of several machine learning algorithms for classifying Twitter messages. Their technique has an accuracy of over 90%, while demonstrating robustness across learning algorithms.
Twitter to investigate the potential use of social media to detect depressive disorders. Park [8] ran some studies to capture the depressive mood of users in Twitter. They studied 69 individuals to understand how their depressive states are reflected in their personal updates. The analysis was conducted in three major steps: (1) surveying the users to identify their depression level, (2) collecting tweets of these users, and (3) comparing the depression levels of users with their language usage in tweets. They found that social media contains useful signals for characterizing the depression in individuals. Their results showed that participants with depression exhibited increase in the usage of words related to negative emotions and anger in their tweets.
Another work to diagnose depressive disorders in individuals done by Choudhury [9]. They measured behavioral attributes including social engagement, emotion, language and linguistic styles, ego network, and mentions of antidepressant medication. Then they leveraged these behavioral features to build a statistical classifier that estimates the risk of depression. Their models showed an accuracy of 70% in predicting depression. They have crowdsourced data from Twitter users who have been diagnosed with mental disorders. Another effort for emotion analysis on Twitter data accomplished by Bollen and his colleagues [3]. They tried to find a relationship between overall public mood and social, economic and other major events. They extracted six dimensions of mood (tension, depression, anger, vigor, fatigue, confusion) using an extended version of POMS (Profile of Mood States), a psychometric instrument. They found that social, political, cultural and economic events have
a significant and immediate effect on the various dimensions of public mood.
Recently, Golder studied how individual mood varies from hour-to-hour, day-to-day, and across seasons and cultures by measuring positive and negative effect in Twitter posts, using the lexicon LIWC [10]. Studies were included where a pooled relative measure of an adverse effect (odds ratio or risk ratio) from RCTs could be directly compared, using the ratio of odds ratios, with the pooled estimate for the same adverse effect arising from observational studies. Empirical evidence from this overview indicates that there is no difference on average in the risk estimate of adverse effects of an intervention derived from analyses of RCTs and meta-analyses of observational studies. This suggests that systematic reviews of adverse effects should not be restricted to specific study types.
Some researchers applied lexical approach to identify emotions in text. For example Strapparava and Mihalcea [11] constructed a large lexicon annotated for six basic emotions: anger, disgust, fear, joy, sadness and surprise. In another work, Choudhury [12] identified a lexicon of more than 200 moods frequent on Twitter. Inspired by the Circumplex model, they measured the valence and arousal of each mood through mechanical Turk and psychology literature sources. Then, they collected posts which have one of the moods in their mood lexicon in the form of a hash-tag at the end of a post.
In [13], three independent annotators manually coded a sample of public tweets and found 9 representative categories including Information Sharing, Self Promotion, Opinions, Random Thoughts, Me Now, Questions to Others, Presence Maintenance, Anecdotes by Me, and Anecdotes by Others. Among them, Me Now (e.g., “tired and upset") and Random Thoughts (e.g., “I miss NY"), frequently displayed profile owner's emotions were the two most popular categories. In order to quantitatively measure depressive symptoms on network level, the authors conducted a longitudinal study on a person-to-person interconnected social network [14]. They assessed over 12,000 people repeatedly over 32 years to retrieve the results. These previous observations give ample ground for using OSN data in studying depressive signs and depression, with the ultimate goal of building a real-time healthcare system.
Akshi Kumar and Teeja Mary Sebastian proposed and investigated a paradigm to mine the sentiment from a popular real-time microblogging service, Twitter, where users post real time reactions to and opinions about “everything”. In the paper, they expound a hybrid approach using both corpus based and dictionary based methods to determine the semantic orientation of the opinion words in tweets. To uncover the sentiment, they extracted the opinion words (a combination of the adjectives along with the verbs and adverbs) in the tweets. The corpus-based method was used to find the semantic orientation of adjectives and the dictionary-based method to find the semantic orientation of verbs and adverbs. The overall tweet sentiment was then calculated using a linear equation which incorporated emotion intensifiers too [19].
same level, both outperforming the state-of-the-art baseline. The two classification tasks are: 1) Positive versus Negative and 2) Positive versus Negative versus Neutral. For each of the classification tasks they have used previously proposed state-of-the-art unigram model as their baseline and reported an overall gain of over 4% for two classification tasks: a binary, positive versus negative and a 3-way positive versus negative versus neutral. They have presented a comprehensive set of experiments for both the tasks on manually annotated data that is a random sample of stream of tweets. They have investigated two kinds of models: tree kernel and feature based models and demonstrated that both the models outperform the unigram baseline. For their feature-based approach, they did feature analysis which reveals that the most important features are those that combine the prior polarity of words and their parts-of-speech tags [20].
Aamera Z.H.Khan, Mohammad Atique, V. M. Thakare presented a paper which consists of new entity-level sentiment analysis method for Twitter. The method first adopts a lexicon based approach to perform entity-level sentiment analysis. The method gave high precision, but low recall. To improve recall, additional tweets that are likely to be opinionated are identified automatically by exploiting the information in the result of the lexicon-based method. A classifier is then trained to assign polarities to the entities in the newly identified tweets [21].
3.
PROPOSED SYSTEM
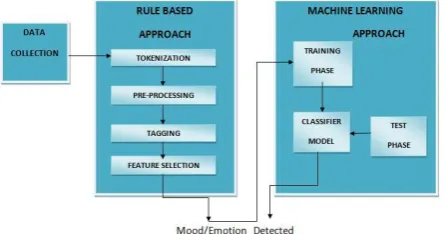
[image:3.595.57.280.407.524.2]In this paper we have proposed a knowledge Based approach and machine learning approach for detecting the emotion or mood of the tweet.
Fig. 1 Architecture of Emotion Detection System
Figure 1 describes the architecture of the system which includes data collection, pre-processing, tagging, knowledge base preparation, knowledge validation and classification.
The system is based on 2 approaches:
1. Rule Based Approach
2. Machine Learning Approach
3.1
Data Collection
“The data is obtained from Sentiment140 [17], containing 10,48576 tweets. The dataset consists of six attributes the first is polarity, second is id, third is date, fourth is query, fifth is username and sixth is tweet. Considered only the tweet part that is the sixth attribute. In the dataset their purpose is to identify the sentiment, sentiment says whether the tweet is positive or negative but the proposed system purpose is not to identify the sentiment instead it identifies the finer level of emotion”[1].
Characteristics of Tweets:
(1)Length: The maximum length of a Twitter message is 140 characters. The average length of a tweet is 14 words or 78 characters. This is very different from the previous sentiment classification research that focused on classifying longer bodies of work, such as movie reviews.
(2)Language model: Twitter users post messages from many different media, including their cell phones. The frequency of misspellings and slang in tweets is much higher than in other domains.
(3)Domain: Twitter users post short messages about a variety of topics unlike other sites which are tailored to a specific topic. This differs from a large percentage of past research, which focused on specific domains such as movie reviews.
3.2
Rule Based Approach
Rule-based systems are used as a way to store and manipulate knowledge to interpret information in a useful way. A rule based system is based on rules generated for problem solving. A rule is a set of conditions and its associated actions. Knowledge is represented in the form of rules. On the left hand side if the pattern matches then the right hand side action will take place.
A rule is in form of if……then.
Below are the different tasks performed in Rule Based Approach:
3.2.1
Tokenization and Pre-processing
Tokenization: “The tweets are stored in a comma separated value file with six attributes; the sixth attribute contains the tweet. We have used NLTK tokenizer. NLTK uses Punkt Sentence Tokenizer; this tokenizer divides the text into a list of sentences and word tokenizer for dividing a sentence into words. Simple Tokenizer divides the strings into substrings using the string split() method. When tokenizing using a particular delimiter string, use the split() method directly, as this is more efficient. The simple tokenizer is not available as separate function; instead, we can just use the split() method directly. Using split method with space as delimiter we have made the text into tokens. The whole sentence is made into tokens”.
Example:
Input: “@kely I was very excited to see wow excited http://bit.ly/1ZLfF”
Output: „@kely‟, „I‟, „was‟, „very‟, „excited‟, „to‟, „see‟, „wow‟, „excited‟, „ http://bit.ly/1ZLfF‟
Pre-processing: “Analyzing data that has not been carefully screened can produce misleading results. If there is much irrelevant and redundant information or noisy and unreliable data reduces the performance. Removing such noisy data is preprocessing”.
1. “Tweets often contain usernames which start with the @ symbol before the username (e.g. @Marilyn). All words that start with the @ symbol are removed using regular expression”.
2. “Many tweets can contain url links. All url links are removed using regular expression”.
4. “Tweets may contain special characters such as (*,/,.,> etc…) can be stripped of using strip() function”.
Strip(): The method strip() returns a copy of the string in which all characters have been stripped from the beginning and the end of the string (default whitespace characters).
5. “The tweets are converted to lower case”.
6. “Some tweets may contain short forms; all those short forms are replaced with full forms. For this we have maintained a predefined list”.
7. “The text should be standardized, social media often contains shortcuts, and the necessary text should be standardized to full form”.
Example:
Input: „@kely‟, „I‟, „was‟, „very‟, „excited‟, „to‟, „see‟, „wow‟, „excited‟, „ http://bit.ly/1ZLfF‟
Output: „I‟, „was‟, „very‟, „excited‟, „to‟, „see‟, „wow‟, „excited‟
3.2.2
Tagging
“After performing tokenization and preprocessing, on the tokens we have applied part-of-speech tagging. POS tagging plays vital role in feature extraction process as it goes in semi semantic way. The same word may have many different meanings depending on its usage. For example, “over” as a verb may have a negative connotation. “Over” may also be used as a noun to refer to the cricket over, which does not carry a positive or negative connotation. In POS tagging, tag is applied for the word based on its previous and next (following) word. Tagging is based on context. Each word is tagged”.
Example:
Input: „I‟, „was‟, „very‟, „excited‟, „to‟, „see‟, „wow‟, „excited‟
Output: ('I', 'PRP'), ('was', 'VBD'), ('very', 'RB'), ('excited', 'JJ'), ('to', 'TO'), ('see', 'VB'), ('wow', 'RB'), ('excited', 'JJ').
3.2.3
Feature Selection
“Anyhow the features can also be extracted using tf-idf method, but tf-idf method goes with syntax whereas POS tagging goes with the semantics. All tags are not the emotional words, to know the emotion carrying words we have referred the Russell's Circumplex Model of Affect. The Circumplex modal suggests that emotions are distributed in a two-dimensional circular space, containing pleasure (valence) and activation (arousal) dimensions [16]. We have observed that the emotion carrying words are mainly nouns, adjectives. In the process of feature selection we have considered adjective phrases, noun phrases, adjectives, few verbs and adverbs. All specified tags may not be useful, to know the most specific emotional words we have taken the more frequently occurred words in the dataset as features. As a result, feature space does no longer include all the words, but instead it only contains the emotional words from the defined Knowledge base [1]. This method reduces the size of feature space dramatically, without losing informative terms”.
JJ-adjective NN_NN noun-noun
NN-noun JJ_NN adjective-noun
RB-adverb JJ_JJ adjective-adjective
VB-verb RB_VB adverb-verb
RB_JJ adverb-adjective
Negation
The words with preceded by negated word can be called as negated features for example “not happy”, “cannot sleep”. The negation features have the ability to completely show the opposite side of a tweet. The negation feature changes the semantic of the sentence, so these features are very important.
Example1:
Input: ('I', 'PRP'), ('was', 'VBD'), ('very', 'RB'), ('excited', 'JJ'), ('to', 'TO'), ('see', 'VB'), ('wow', 'RB'), ('excited', 'JJ').
Output: very excited 1
wow excited 1
3.2.4
Classification Rules
3.2.4.1
Classification
“Rule based approach is used to classify the tweets under four class categories. The rule based applies certain rules to get a conclusion. Here a seed list is maintained, the seed list consists of different emotional words which are nothing but our extracted frequent features along with category. The tweet is read line by line along with its tag. A rule is written in the form of if and then (if the specified tag has occurred then return the word). Here the tweet is read along with its tag in order to avoid the computational cost, if all the words are made to read then the time required to read 1 million records will be more. So to avoid the unnecessary computation the specified tags (like verbs, nouns, adverbs, adjectives and their combinations) which carry the emotions are considered. Then the extracted word is checked against the seed list. If the word is present in the seed list then the word is stored on to a dictionary. Same process is repeated for every tweet. The emotional words in the tweet will fall under some category. If more number of words in a tweet falls under any one of the category then that class label is assigned to the tweet”. Here we have considered four different classes, they are:
“C1 – Happy-Active Class”
“C2 – Happy-Inactive Class”
“C3 – Unhappy-Active Class” “C4 – Unhappy-Inactive Class”
“The happy-active class specifies more happy emotions like „sohappy‟, „excited‟, enjoy', 'excited', 'proud', 'amazing', 'delighted', 'wonderful etc”.
“The happy-inactive class specifies less happy emotions like 'calm','peace','quiet','silent','convinced','content','satisfied','rela xing','resting' etc”.
“The unhappy-active class specifies less sad emotions like 'nervous','anxious','tennsion','afraid','fear','angry','furious','both er','disturbed','mad' etc”.
“The unhappy-inactive specifies more sad emotions like 'sad', 'miserable', „very sad‟, „sorrow‟, „disappointed‟ etc”.
Example 1:
Input1: very excited: c1, wow excited: c1
Output: C1 I was very excited to see, wow excited
Example 2:
Input: sad: c4, miss: c4
Output: C4 im sad now Miss.Lilly
Example 3:
Output: C3 ok I'm sick and spent an hour sitting in the shower cause I was too sick to stand and held back the puke like a champ. BED now
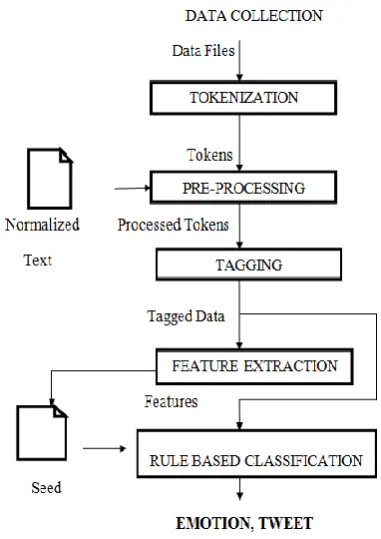
[image:5.595.72.263.138.408.2]Note: - C1: happy active class, C2- happy inactive class, C3- unhappy active class, C4- unhappy inactive class
Fig. 2 Workflow of Rule based Emotion Detection Approach
3.3
Machine Learning Approach
Another approach is using supervised machine learning classifier. A number of statistical classification techniques are available that have been applied to text categorization, we are using Bayesian classifier. In the supervised learning there are two phases: namely, (1) Training Phase and (2) Testing Phase. For our task of classification Naive Bayes is used which have been shown to be easy and effective in previous text classification work.
Bayesian classifiers build a probabilistic model based on the word features in different classes. Texts are classified based on posterior probabilities generated based on the presence of different classes of words in text. Naive Bayes has been widely used for classifying text because it is simple and fast. The Naive Bayes classification method is based on Bayes rule. The aim of this method is to choose the class with a highest probability.
3.3.1
Training Data Creation
The required training data is already created through rule based classification approach [1]. The data after removing error tweets is fed to the training algorithm.
3.3.2
Training Phase
The output of the rule-based classification is used as input for the training phase. It is used so as to reduce the time and cost. The training data can be created manually but for that we need an expert which is expensive. Manual creation of training data takes much time meanwhile rule based can be developed. Rule based is easy to create when compared with manual creation of training data. Training data is created in a
semi-automatic way through rule based system as far as our approach.
In the training phase the tweet is supplied with a class label. Every tweet is associated with a class label. In our work we have used four class labels, so each tweet will fall under one of the specified class category. The text should be converted to numeric because the machine learning algorithm works with numeric data. The Naïve Bayes conditional independence assumption is:
(Eq3.1)
The above assumption says that the probability of the tweet of certain class is going through the length of the tweet, the probability of each word is classified as Vj or class. The values are the number of times a word occurred in the given tweet.
(Eq3.2)
Where,
n = total no. of words with specified class
[image:5.595.312.538.370.755.2]nk = no. of times word occurred with the specified class Vocabulary = size
Fig. 3 Block Diagram of Training
Procedure Steps:
1. Calculate nk i.e., no. of times the word occurred with class
2. Calculate n i.e., total no. of words for given class
3. Calculate p(wk/vj) = nk/n i.e. the probability of word for the given class
4. Calculate the probability of each class
5. Calculate the vocabulary i.e., the total no. of unique words
6. Repeat the process
Pseudocode:
F1: open the input file
for l in f1:
l1 = l.strip()
arr = re.split('\s+',l1)
for w in arr:
if i == 0:
c = w
hash_c[c] = hash_c.get(c,0)+1
i = i+1
get(w1,0)+1
hash_wd[t] = hash_wd.get(t,0)+1
hash_cf[c] = hash_cf.get(c,0)+1
val = hash_cf[clss]
prob = (p/val)*100
prob_w = ((p+1)/(val+uniq_wdc))*100
Example:
Input: C1 excited to see you
Output: excited c111 0.01 3
3.3.3
Testing Phase
In the testing phase, tweet without class label is provided it means that the tweet is unseen before. With the previous examples or experiences provided to the Bayesian algorithm in training phase the machine is categorizing the tweet into one of the class category provided. The input in the test phase is a new tweet and the output is class label.
The naive Bayes Classifier combines the model with a decision rule, which picks up the hypothesis with maximum probability. In simple words, we pick the class which has maximum value.
This can be formalized as follows:
(Eq3.3)
where Vj represents the class from all V classes and W represents the word
The (Vj) is the prior probability of the class Vj and (W|Vj) isthe probability of word
W for the given class Vj
Fig. 4 Block Diagram of Testing
Procedure Steps:
1. Read the file line by line.
2. Read the tweet word by word
3. Calculate the probability of each word in the tweet against each class
4. Check for the maximum probability for each word against all classes, the word with maximum probability class is considered.
5. Repeat the process
6. Check maximum for all the words in the tweet, the class which is having highest number of words in the given tweet is considered as the class of that tweet.
7. Repeat the process.
Pseudocode
for tt in file:
t = tt.strip()
t1 = re.split("\s+",t)
if line == "":
pass
else:
wds = re.split('\s+',line)
for w in wds:
if w in c1_hash:
c1p=c1_hash[w]
c1tf=c1tf*float(c1f[1])
fre = float(float(ff1)/size)
fre1 = float(fre)*c1tf
maximum = max(lis)
Example:
Input: She is so excited to do work
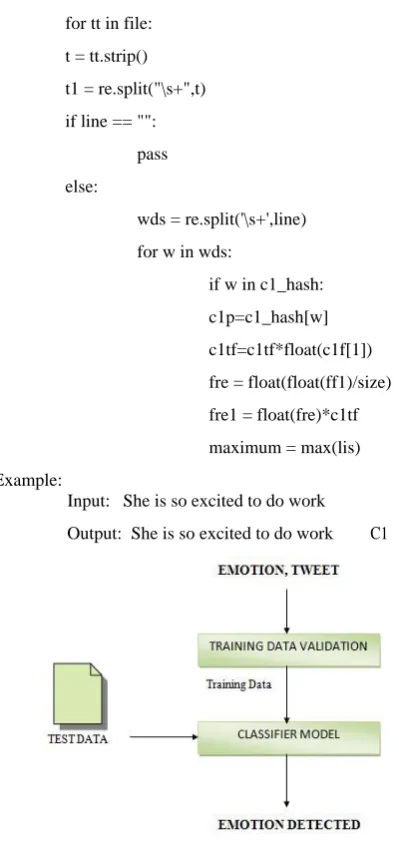
[image:6.595.319.519.82.507.2]Output: She is so excited to do work C1
Fig. 5 Workflow of Learning Based Emotion Detection Approach
4.
EXPERIMENTAL RESULTS
The system consists of four classes of emotions namely (c1) Happy-Active, (c2) Happy-Inactive, (c3) Unhappy-Active, and (c4) Unhappy-Inactive. “We have used the Russels circumplex model as reference to know the emotion carrying words. Russel‟s circumplex model [18] suggests that emotions are distributed in a two-dimensional circular space, containing pleasure and activation dimensions. The activation dimension measures if one is likely to take an action in a mood state. The pleasure dimension measures how positive or negative a person feels”.
In our rule based system we have classified the complete 1 million records, it gives the accuracy over 85%. Here we are using non-exhaustive cross-validation called k-fold cross validation technique to validate the result. Since the rule based classification includes a countable number of error data which reduces the performance, such tweets should be avoided. The output of RBA is fed to MLA.
4.1
Performance Evaluation
8000 tweets randomly, from this 80% tweets are used for training and 20% are used for testing.
Table 1. Machine learning Naïve Bayes Tweet Count No. of tweets for training No. of tweets for testing
6400 1600
[image:7.595.317.533.428.479.2]For the Machine learning algorithm the Test phase tweets have been distributed in the following way and shown with the help of confusion matrix.
Table 2. Confusion Matrix for MLA
N=1600
C1(Hap py-Active)
C2(Hap py-Inactive)
C3(Unhap py-Active)
C4(Unhap py-Inactive)
C1(Happy
-Active) 348 32 99 1
C2(Happy
-Inactive) 32 391 16 2
C3(Unhap
py-Active) 6 4 346 4
C4(Unhap py-Inactive)
0 2 6 311
Emotion detection system is then evaluated based on Precision, Recall and F-measure score obtained.
4.1.1
Precision
Precision is also referred to as positive predictive value.
Precision=TP/(TP+FP) (Eq4.1)
Where, TP and FP are the number of true positive and false positive predictions for the considered class.
4.1.2
Recall
Recall is commonly referred to as sensitivity, corresponds to the true positive rate of the considered class.
Recall=TP/(TP+FN) (Eq4.2)
Table 3. Precision and Recall for MLA
Category Precision Recall
C1 0.72 0.86
C2 0.85 0.89
C3 0.96 0.93
C4 0.97 0.95
The above table gives the precision and recall of each class.
Fig.6 Precision and Recall
4.1.3
F-Measure
[image:7.595.82.235.526.621.2]The F-score is a measure of test‟s accuracy. F1 score can be interpreted as a weighted average of the precision and recall, where F1 score reaches its best value at 1 and worst at 0. The F-measure of the system is 0.882.
Table 4. F-measure for MLA
Category F-measure
C1 0.78
C2 0.9
C3 0.9
C4 0.95
The above table gives the F-measure.
Fig. 7 F-measure
Validation
The Naïve Bayes is validated by using k-fold non-exhaustive cross validation technique. Randomly generated tweets are fed to the model and checked for its category.
Table 5. Accuracy of RBA and MLA
Approach Rule Based Machine Learning
Overall
Accuracy 85.1% 88%
The above table provides the accuracy of the earlier approach and ML approach. The rule based system (earlier approach) accuracy is over 85% and the accuracy of MLA is over 88%. Compared with the earlier approach RBA [1] the accuracy of MLA is more because some error data has been removed while training the algorithm.
Fig. 8 Accuracy
5.
CONCLUSION AND FUTURE WORK
We have proposed an Emotion Detection System, a method for classifying Twitter messages into distinct emotional classes they express. With the proposed system we are able to detect and classify the emotion of the tweet. The system
0
0.5
1
1.5
C1
C2
C3
C4
Precision
Recall
0%
50%
100%
Rule
Based
Machine
Learning
[image:7.595.319.538.554.702.2] [image:7.595.71.264.640.753.2]performance has been increased in the second approach that is machine learning approach when compared to the first approach that is Rule based approach. The proposed method can be used by healthcare professionals or counseling agencies to monitor and track a patient's emotional states, or to recognize anxiety or systemic stressors of population. This technology can measure public mood of people in a community, which may help social scientists to understand the quality of life of population.
In the future we would like to explore other machine learning algorithms on different datasets. Among future directions, we also hope to analyze the confidential data like terrorists data, so that we could be able to predict the future attacks.
6.
REFERENCES
[1] Srinivasu Badugu, Matla Suhasini, March 2017, “Emotion Detection on Twitter Data using Knowledge Base Approach”, International Journal of Computer Applications, Volume 162 – No 10, pp. 0975 – 8887.
[2] Maryam Hasan, Elke Rundensteiner, and Emmanuel Agu, May 2014, “EMOTEX: Detecting Emotions in
Twitter Messages,” ASE
BIGDATA/SOCIALCOM/CYBERSECURITY Conference, 27-31.
[3] Johan Bollen, Huina Mao, and Alberto Pepe, 2011, “Modeling public mood and emotion: Twitter sentiment and socio-economic phenomena,” in International AAAI Conference on Weblogs and Social Media (ICWSM'11).
[4] Mike Thelwall, Kevan Buckley, and Georgios Paltoglou, 2007, “Sentiment in twitter events,” Journal of the American Society Tavel, Modeling and Simulation Design. AK Peters Ltd, P.
[5] Ed Diener and Martin E. P. Seligman, 2004, “Beyond money: toward an economy of well-being,” in PSYCHOLOGICAL SCIENCE IN THE PUBLIC INTEREST, American Psychological Society.
[6] Ed Diener, 2009, Assessing well-being: The collected works of Ed Diener, vol. 3, Springer.
[7] Shigehiro Oishi Ed Diener Ed Diener, “Subjective wellbeing: The science of happiness and life satisfaction,”
[8] Minsu Park, Chiyoung Cha, and Meeyoung Cha, 2012, “Depressive moods of users portrayed in twitter,” in Proc. of the ACM SIGKDD Workshop on Healthcare Informatics, HI-KDD.
[9] Munmun De Choudhury, Michael Gamon, Scott Counts, and Eric Horvitz , 2013, “Predicting depression via social media.,” in International AAAI Conference on Weblogs and Social Media (ICWSM'13), The AAAI Press.
[10]Golder S, Loke YK, Bland M, 2011, Meta-analyses of Adverse Effects Data Derived from Randomized
Controlled Trials as Compared to Observational Studies: Methodological Overview. PLoS Med 8(5): e1001026. doi:10.1371/journal.pmed.1001026.
[11]Munmun De Choudhury, Scott Counts, and Michael Gamon, 2012, “Not all moods are created equal! Exploring human emotional states in social media,” in Sixth International AAAI Conference on Weblogs and Social Media (ICWSM'12).
[12]Carlo Strapparava and Rada Mihalcea, 2008, “Learning to identify emotions in text,” in Proceedings of the 2008 ACM symposium on Applied computing. ACM, pp.1556-1560.
[13]M. Naaman, J. Boase, and C.-H. Lai. 2010, Is it Really About Me? Message Content in Social Awareness Streams. In ACM Conference on Computer Supported Cooperative Work (CSCW).
[14]D. Kleinbaum, L. Kupper, and K. Muller. 2007, Applied regression analysis and other multivariable methods. Duxbury Pr.
[15]Go, A., Bhayani, R., & Huang L. 2009, Twitter Sentiment Classification Using Distant Supervision. Retrieved December 6, 2014, from http://cs.stanford.edu/people/alecmgo/papers/TwitterDist antSupervision09.pdf
[16]J. A. Russell, 1980, “A circumplex model of affect, 1980,” Journal of Personality and Social Psychology, vol. 39, pp. 1161-1178.
[17]http://sentiwordnet.isti.cnr.it
[18]David H. Olson, Douglas H. Sprenkle, Candyce S. Russell, 1979, “Circumplex Model of Marital and Family System: I. Cohesion and Adaptability Dimensions, Family Types and Clinical Applications”, Wiley Online Library, Vol.18, Issue 1, pg. 3-28.
[19]Akshi Kumar and Teeja Mary Sebastian. 2012, “Sentiment Analysis on Twitter”, International Journal of Computer Science Issues, Vol. 9, Issue 4, No. 3, ISSN (Online): 1694-0814.
[20]Apoorv Agarwal Boyi Xie, Ilia Vovsha, Owen Rambow, Rebecca Passonneau, 2011, “Sentiment Analysis of Twitter Data”, Proceedings of the Workshop on Language in Social Media, pg. 30-38.