ABSTRACT
Hart, William J. Effect of Computer Animation Instruction on Spatial Visualization Performance. (Under the direction of Dr. Theodore J. Branoff)
The purpose of this study was to determine the effect of a sixteen week long animation class on spatial visualization performance. The students in the treatment group were provided instruction consisting of four hours of lecture/lab each week. Lecture/Lab consisted of lessons on the fundamentals, history, and techniques of animation. The students were provided instruction in and opportunity to use three different animation packages (Flash ®, TrueSpace ®, and 3D Studio Max ®).
The spatial visualization performance of the students in the animation group was compared to a control group of students in a Foundation of Graphics (GC120) class.
A paired T-test was completed on each group to determine progress made within each group. An Independent Samples T-test was used to make a comparison between the animation test group and the control group.
EFFECT OF COMPUTER ANIMATION INSTRUCTION ON SPATIAL VISUALIZATION PERFORMANCE
by
WILLIAM J. HART
A thesis submitted to the Graduate Faculty of North Carolina State University in partial fulfillment of the requirements
for the degree of Masters of Science
DEPARTMENT OF MATHEMATICS/SCIENCE/TECHNOLOGY EDUCATION Raleigh
2003
APPROVED BY:
_____________________________ ___________________________
Dr. Aaron C. Clark Dr. V. William Deluca
DEDICATION
I dedicate this work to the three guiding people in my life. My loving wife, C. J. Hart, whose support and constant encouragement made this work
BIOGRAPHY
April 16, 1947 ……….. Born Seattle Washington
1965 …………... Graduated from Carson High School
Carson, CA
1966 – 1974 ………... United States Air Force Electronic Systems Instructor 1974-1978………... Senior Test Equipment Design
Technician, Pertec Computer Corp. 1978-1985……… Senior Designer (PCB/IC)
Collins Radio, Cedar Rapids, IA 1986-1992……….... Construction Superintendent/Trainer
Thomas Construction Co. Inc. Gardena, CA
1997………. A.A.S. in Computer Aided Drafting University of New Mexico –Valencia Los Lunas, NM
2000……… B.S. in Technology Education North Carolina State University
Raleigh, NC
Honors/ Awards/ Professional Organizations
ACKNOWLEDGEMENTS
It is with deep appreciation that I thank Dr. Alice Scales for her guidance and continuous encouragement in this endeavor. I also wish to thank Dr. Aaron Clark and Dr. V. William (Bill) Deluca for their support and encouragement. I wish to thank Dr. Theodore Branoff for acting as the committee chair and for providing me with an education in the process of thesis writing. I thank all of the committee members for allowing me to use their guidance to bring this endeavor to a successful conclusion.
I also give my thanks to my co-workers and fellow students for their assistance in locating materials and for reminding me when materials were to be returned to the library.
TABLE OF CONTENTS
Section Page
LIST OF TABLES vii
LIST OF FIGURES viii
CHAPTER ONE: INTRODUCTION 1
Summary of Relevant Research 1
Learning Theory 2
Purpose of Study 4
Research Questions and Hypotheses 5
Assumptions 6
Definition of Terms 7
Summary 8
Spatial Visualization an Animation 9
Test for Measuring Spatial Abilities 9
Animation Studies and Spatial Ability 16
Computer-Aided Design and Spatial Abilities 26
Cognitive Interaction Learning Theory 27
Summary 29
CHAPTER 3: RESEARCH METHODOLOGY 30
Introduction 30
Purpose of Study 30
Research Questions and Hypotheses 31
Null Hypotheses 31
Instrumentation 33
Target Population 35
Sample 35 Procedures 36
Dependent Variable 37
CHAPTER FOUR: PRESENTATION OF DATA 40
Introduction 40
Description of Participants 40
Group One – Technical Graphics (Control Group) 40
Group Two – Animation (Experimental Group) 41
Analysis of Scores 43
Question 1 44
Question 2 45
Question 3 46
Summary 47 CHAPTER FIVE: SUMMARY, CONCLUSIONS, DISCUSSION,
RECOMMENDATIONS 48
Introduction 48
Statement of Problem 50
Research Questions and Hypothesis 50
Procedures 52
Demographic Data on Participants 53
Analyses 54
Conclusions and Discussion 56
Implications for Teaching 58
Recommendations for Future Research 58
REFERENCES 59
LIST OF TABLES
Number Page
LIST OF FIGURES
Number Page
Figure 1.1. Theoretical Learning Model………..………...…….…3
Figure 2.1. Revised Minnesota Paper Form Board Test ……….………....…..10
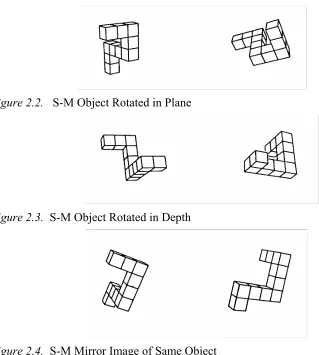
Figure 2.2. S-M Same Object Rotated in Plane ………...…..…...…11
Figure 2.3. S-M Same Object Rotated in Depth ………...…………....……11
Figure 2.4. S-M Mirror Image of Same Object ……….………...…11
Figure 2.5. PSVT Visualization of Developments ……….…..…12
Figure 2.6. PSVT Visualization of Rotations…… ……….……..…12
Figure 2.7. PSVT Visualization of Views ……….………...…13
Figure 2.8. Visualization of Rotations with Coordinate Axes Added ………….….14
EFFECT OF COMPUTER ANIMATION INSTRUCTION ON
SPATIAL VISUALIZATION PERFORMANCE
CHAPTER ONE: INTRODUCTION
Summary of Relevant Research
The use of computer animation in computer-assisted instruction medium is a way of taking advantage of capabilities that computer technology has provided. From an instructional viewpoint, computer animation can be used as a visual aid to illustrate, provide meaning, and give organization to the material being taught. The advancements in computer animation allow realistic scenes to be generated and provide interactive tools that students are able to use to create an environment that they are able to control. This ability provides the opportunity for a better
understanding, greater retention, and improved spatial performance of instructional material (Klein, 1985; Proffitt & Kaiser, 1986).
Learning Theory
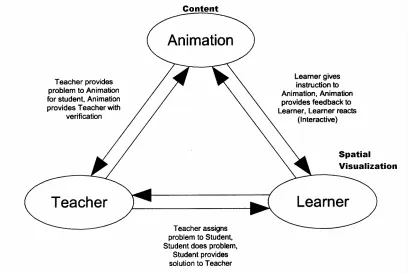
Cognitive Interaction Learning theories may be a better way to understand the learning process for obtaining and for improving spatial visualization ability. Within this cluster of theories, learning occurs when cognitive function interacts with the meaningful psychological environment around it. The cognitive interaction theories have two forms, linear and field (Bandura, 1993; Bigge & Shermis, 1998, p. 159). Under this premise, the followers of the adult learning philosophy of the Experiential Learning theory will learn (cognitive process) by experience (doing) (Fenwick, 2000; Knox, 1980) and would fall into the category with the Cognitive Interactionist philosophy.
The linear and field forms of the cognitive interaction theory are very similar in nature. The followers of the linear form of cognitive interaction believe that perception and behavioral changes [learning] occur in sequence. The followers of the field version of cognitive interaction believe that there is a simultaneous interaction occurring between the learner and their psychological environment (Bigge & Shermis, 1998).
interaction theory by extrapolation the learner should be able to improve his/her spatial visualization performance.
Figure 1.1. Theoretical Learning Model
Purpose of Study
Previous work has indicated that spatial visualization can be taught and that there is a natural progression in learning and improving spatial visualization skills (Baartmans & Sorby, 1996; Klein, 1985; Proffitt and Kaiser, 1986). Thus the purpose of this study, from a theoretical standpoint, was to investigate whether instruction in computer animation improved spatial visualization skills. By comparing the results of the scores from the Purdue Spatial Visualization Test – Visualization of Rotations between students taking a Foundations of Graphics class with students taking a computer animation class, an attempt was made to determine which of the groups provided the most improvement in spatial performance. This study compared the difference in spatial performance between students taking the introductory Foundations of Graphics class and students taking the animation class. These classes are currently taught in the Department of Mathematics, Science, and Technology Education at North Carolina State University. The rotations section of the Purdue Spatial Visualization Test used in this research study was developed by Guay (1976), and has been widely used to assess students’ spatial visualization ability (Branoff, 1998, 1999; Baartmans & Sorby, 1996).
The need for study in the area of spatial visualization performance can be summed in these words, “… in terms of cognitive development, researchers have pointed to spatial ability as playing a fundamental role in the formation of
Research Questions and Hypotheses
In order to create orthographic projections, the student must be able to perform 3 mental tasks: (1) rotate an object to another plane, (2) change the object from two-dimensional to three-dimensional, and (3) to change an object’s size (Zavotka, 1987; Sorby, 2000). All three of these tasks are considered to be spatial in nature. Thus, the specific questions investigated by this study can be stated by means of the following questions:
1. Will instruction in a sixteen week computer animation course significantly improve spatial visualization performance in undergraduate students?
2. Will instruction in a sixteen week basic technical graphics course significantly improve spatial visualization in undergraduate students?
3. Will instruction in a sixteen week computer animation course provide higher scores indicating a higher development of spatial visualization than a sixteen week basic technical graphics course?
Questions 1 and 2 were answered by using a paired samples T-test between pretest and posttest scores on the Purdue Spatial Visualization Test – Visualization of Rotations (PSVT:R) collected at the beginning and end of the sixteen week instruction period. The hypotheses for questions 1 through 3 were:
H1N – There will be no significant difference between the pre-test and
H2N – There will be no significant difference between the pre-test and
posttest mean scores on the Purdue Spatial Visualization Test – Visualization of Rotations for students who take a Foundations of Graphics class or
introduction to engineering graphics class (Group 1).
To answer question 3 it was necessary to use the posttest data for both of the groups. Using the posttest results in an independent sample T-test was performed to see if there was a significant difference in mean scores between the animation group and the graphics group.
H3N – There will be no significant difference between the posttest mean scores on the Purdue Spatial Visualization Test – Visualization of Rotations for students who take a computer animation class (Group 2) and students who take the Foundations of Graphics class or introduction to engineering
graphics class (Group 1). G2=G1
Assumptions
Definition of Terms
1. Analytic skill: The ability to identify figures concealed in a complex background field (Stancil & Melear, 1991).
2. Computer animation: A series of rapidly changing computer screen displays presenting a geometrical shape and varying positions giving the impression of movement (Mayton, 1991).
3. Dependent variable: A dependent variable is a variable that is influenced by an independent variable. The dependent variable in this study was student
performance on the posttest instrument.
4. Image and imagery: The terms image and imagery in this study refer to
nonverbal modes of thought, where memory representations of concrete objects and events are actively generated and manipulated by an individual (Caraballo-Rios, 1985).
5. Independent variable: An independent variable is a variable that is manipulated by the researcher. The independent variable in this study was the treatment applied to the test group.
6. Instructional visual display or instructional graphical display: Displays that are presented during an instructional situation where the main message is presented by a drawing or illustration (Klein, 1985).
the term “interactiveness” refers to the two-way communication that can be carried out between the computer and its human operator.
8. Spatial visualization: Spatial visualization is "The ability to formulate mental images and to manipulate these images in the mind" (Lean and Clements, 1981 p. 286). Guay (1980) indicated that the defining element of spatial visualization is the ability to manipulate the mental image and not the perception of that image.
Summary
CHAPTER TWO: REVIEW OF LITERATURE
Spatial Visualization and Animation
The use of animation is employed in many fields of study. Reports and presentations of chemists, engineers, mathematicians, advertising agencies, commercial designers, and architects all use graphics to explain how things work (Bodner & Guay, 1997; Rieber, 1987, 1989; Strong & Smith, 2001). When
appropriate, animation, a sequential series of images that gives motion to objects, is used to illustrate such presentations. The study being reported here deals with the effect of computer animation on the understanding and improvement of spatial performance.
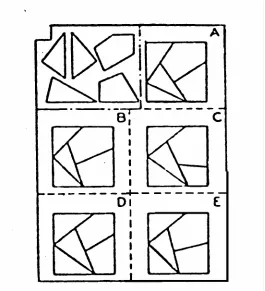
Test for Measuring Spatial Abilities
Figure 2.1. Revised Minnesota Paper Form Board Test
Figure 2.2. S-M Object Rotated in Plane
Figure 2.3. S-M Object Rotated in Depth
Figure 2.4. S-M Mirror Image of Same Object
The Mental Rotations Test (MRT) developed by Vandenberg and Kuse (1978) was a continuation of Shepard and Metzler’s work with the S-M test.
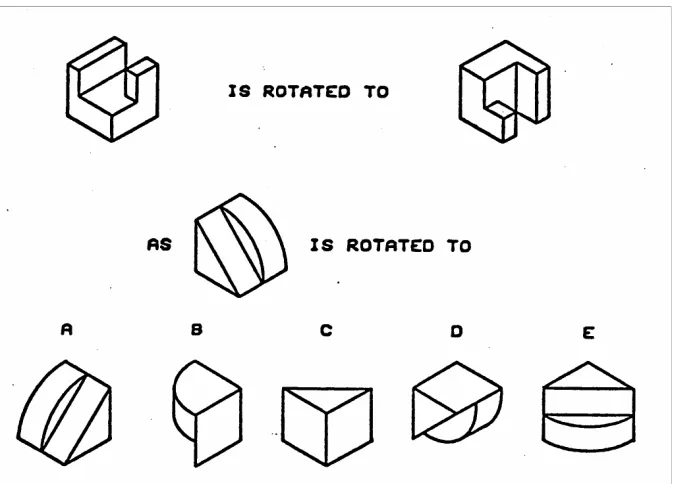
The Purdue Spatial Visualization Test (PSVT) series was developed by Guay (1976). The actual test consists of three parts: Developments, Rotations, and Views. The Visualization of Developments (PSVT:D) tests the ability of subjects to
viewpoints (Figure 2.7). The series of subtests utilizes different processes to measure spatial ability.
Figure 2.5. Visualization of Developments
Figure 2.7. Visualization of Views
Guay & McDaniel (1978) completed a study on spatial performance tests. Comparisons of the RMPFB, S-M, and the three subtests of the PSVT were made. A categorization of these tests was made by Guay & McDaniel (1978). They divided the tests into groups by processing styles. The gestalt group (object processed as a whole) included the S-M, Visualization of Rotations and Visualization of Views. The analytical group included the RMPFB and the Visualization of Developments. This group was characterized by Guay & McDaniel (1978) as a trial and error method of processing.
Spatial Visualization Test – Visualization of Rotations and modified the test items by adding coordinate axes to the objects. The modified form (Figure 2.8.) of test
questions had mixed results.
Figure 2.8. Visualization of Rotations with Coordinate Axes Added
Branoff determined that the addition of the axes only had a small influence on the scores for the PSVT:R between the treatment groups. The effect of the axes system indicated more time was required for the test subjects to process the test items. The addition of the coordinate axes indicated that there was no significant difference between male/female ability in rotation of the test items (Branoff, 1998). Branoff (1999) replicated previous findings but indicated that the practical
significance on adding the coordinate axes needed to be examined.
In a study, by Seddon, Eniaiyeju, and Chia (1985), the ambiguity in results for visualization in rotations about the Z axis or the X and Y axes was thought to be in statistical methods used in research. They tested the effect of different figures and the cognitive functions that occurred with each type of figure. The figures that Seddon et al. (1985) used provided spatial information that required a different kind of thought process to analyze rotations in different axes. Using the test items illustrated in Figure 2.9, they concluded that the type of psychological reasoning used to understand rotations of the Z axis could not be used to understand rotations of the X and/or Y axes. This work was continued by Shubbar (1990).
Animation Studies and Spatial Ability
Blake (1977) investigated motion as an instructional media. In a study utilizing 84 subjects (42 males and 42 females) taken from undergraduate psychology courses, Blake tested the hypothesis that motion in visual media can enhance the learning of complex spatial relations. Blake determined that one of the most important factors in media selection was the degree of detail to be included in the visual presentation. Accordingly, Blake indicated that the increased signal-to-noise ratio in the information theory meant that learning would decrease as a function of the irrelevant cues that are presented simultaneously with the critical cues. Blake concluded that commercial instructional media was done in such detail that it was difficult to isolate the relevant cues because the detail was distracting. The increased detail would not necessarily be a critical portion of the presentation and thus it would cause interference and irrelevant cues (noise). The irrelevant cues impeded learning, by requiring the subject to devote additional time to scan the images, thus decreasing the amount of time available to focus on the relevant cues. “If motion is to be used to reduce the complexity of perceiving visual information, it follows that it should clarify critical information and not add any irrelevant cues” (Blake, 1977, p. 996). Thus it is necessary to clarify what critical information should be presented and not add irrelevant cues.
illusion of motion. He also stated that experimenters have failed to demonstrate the significant differences among the media presentations because of the large internal variance caused by individual differences in learning from different modes of instruction. Blake further noted that motion could only enhance learning if it adds significantly to the viewer’s perception of the relations between objects. Blake’s research determined “… viewers with sufficient spatial ability to perceive spatial relations presented without the use of motion should not show any improvement in learning with the addition of motion. For them, motion cues became extraneous or irrelevant” (Blake, 1977, p. 978).
Caraballo (1985) described research on motion in the following manner: "The research on motion as an instructional variable is neither as vast nor has been carried as systematically as the research assessing the instructional effectiveness of visuals" (p.14). According to Caraballo variations on this outlook have been made by
researchers since the 1970s. .
involving time and was as effective as the slide presentation for teaching concepts involving motion.
Pictures, graphs, animations, or other types of graphics are considered a type of drawing or illustration (Klein, 1985). As a group, these graphics have been increasingly used in education as a tool in which concepts and detailed information can be presented (Klein, 1985). Klein felt that there were a considerable number of theories supporting the use of graphics as a learning tool, however, there is
considerable disagreement in theoretical approach and the validity of the various theories among researchers. The perceptual efficiency theory (visuals are more readily perceived because they are a better communicator) had no empirical support according to Moore & Nawrocki (1978). Realism theories (people learn better if information is present in the most concrete manner) were supported by literature, but these views did not have the support of Moore & Nawrocki. “Generally speaking there is belief that pictures aid in learning because they are pleasing. … there is little evidence to support the notion that preferences for a particular stimuli … affect performance” (Moore & Nawrocki, 1978, p. 17).
down a slope or a bent ray of light that passes through a lens (Klein, 1985, p. 30). The temporal rule was defined as “some regularity in association between motions or changes of at least two objects” (Klein, 1985, p. 30). This example for the temporal rule was the internal moving parts of an engine or clock. Klein simplified his temporal rule by stating that a motion in part A results in a motion in part B.
Caraballo (1985) completed a study in which he investigated types of presentations and the effect each had on learning. The study consisted of eighty college students who were randomly assigned to one of the following groups for a different treatment condition. His instruction conditions consisted of (1) no instruction, (2) text only, (3) text and still graphics, and (4) text plus still and
animated graphics. Caraballo's study indicated that the text plus still graphics was as or more effective than text only or text plus still and animated graphics in promoting achievement. Another conclusion was that the decision to include an animated sequence must follow a careful analysis of its effectiveness in promoting specific goals and the effectiveness in reaching the schools. Additionally, his study showed that still graphics might be as effective as, or more effective than, the animated sequences.
of the program. Each of the commercials was 30 seconds in length. The test subjects were broken into three groups of 45 subjects. Each group viewed all of the commercials, only the sequence of viewing was altered between groups to control for position and order bias. The difference in the commercials was the level of
animation. The commercials that had total animation ranked higher than those that were a combination of animation and live action and totally non-animated. Their findings determined that animation, although traditionally popular with children as an attention getting device, provided the least amount of time for perception and recognition of the topic presented to occur. Bush and Gresham also looked into the use of animation as a training tool for military trainees. They found consistent increases in the amount that the trainees learned in situations involving animation. They determined that the use of animation was effective in facilitating
comprehension and learning. They concluded that animation was a viable method of execution for advertisers, and that there were no negative perceptions toward
advertisements that used animations. Additionally, Bush and Gresham determined that advertisements containing animation were perceived better than advertisements without animation and that brand recall was better for animated advertisements.
(1986) stated that the realism and quality of motion were limited by the amount of computing power available. Profitt and Kaiser concluded that computer generated displays allowed a greater freedom and control that were impossible with
conventional methods. They also stated that computer simulation would rarely achieve a level of realism that would cause an observer to confuse a simulation with reality (p 491).
Shubbar (1990) investigated rotation and diagrams of three-dimensional structures using the rotation of molecules for chemistry visualization problems. In the study Shubbar used 96 boys aged 15-16 drawn at random from all of those following science courses in one senior high school in Bahrain. These students were classified as above average in terms of general education ability and achievement. From the results of this study, Shubbar determined that the ability to visualize molecular structure was dependent on understanding the significance of the tools used to illustrate the structure, and the cues which were used to portray depth. He discussed foreshortening of lines, overlapping of lines, and the representation of angles. According to Shubbar, the psychological importance of the visual cues demonstrated that a general level of spatial relationships in the diagrams for the structures of molecules needed to be understood. It was also stated that if the cues and their relationships were removed, the subject would have a decreased
understanding of molecular structure.
researchers required students to look at diagrams of a three-dimensional model and then select which of four other diagrams could represent the model. The student was always able to refer to diagrams showing the orientation of X and Y axes. The teaching method was used to assist the student in preparing for this test and
employed animation with an explanation describing how to visualize the rotation of the molecular structure. The animation provided a shadow cue to assist in visualizing the rotation of the molecule. According to Shubbar, this particular method was proven to enable the students to visualize rotations in the molecular diagrams. According to test results, an increase in recognition did in fact occur. This increase in recognition was dependent upon the rotational speed of the shadow in the
animations. Shubbar stated that, at the time of his study, computer aided animation technology was not advanced enough to allow the test subject to readily control rotational speed. Testing and training, therefore, was done by hand and recorded on video tape. Shubbar concluded the videotape provided an effective means of presenting the sequences of diagrams for instructional purposes.
The fundamental logic behind this thought was, “that specific analysis of animations containing multiple depth cues significantly improved depth perception” (Wiley, p.41). Computers are capable of presenting objects in graphical three-dimensional form (model) that can be manipulated to provide different views and allow user control of the model. Wiley felt that the ability to control the movement of an object in real time allowed the learner to get more realistic visual information to promote visual learning and improve spatial ability.
Later, Williamson and Abraham (1995) investigated the effects of computer animation on particulate mental models. In order to determine the effect of
animation on student visualization of chemistry concepts, Williamson and Abraham sought answers for the following questions:
1. Will computer animation of concepts improve the understanding of the particulate nature of matter?
2. Would computer animation improve course achievement?
The sample group for this research consisted of two sections of the first semester of general chemistry at a Midwestern university. These two sections were the only sections offered for this class and consisted of a total of approximately 400 students. One section was randomly assigned as the control group and the other as the treatment group. Part of this study used animations illustrating the ion bonding of iodine and hydrogen atoms and the resulting molecular compound. The
Additionally, the quality of the animation may promote deeper encoding of
information than that of static pictures (p. 532). Williamson and Abraham compared animation to static visuals such as transparencies or chart diagrams and determined that static visuals failed to provide an adequate understanding to allow formation of mental models.
Mayton (1991) completed a study in which he investigated the effects of animated visual information used in conjunction with text and static images. In his work, Mayton established three different treatment groups. These groups were composed of a total of 72 introductory psychology undergraduates at The Ohio State University. The first group used static images without cueing strategy; the second used static images with cueing strategy the third group used animated visuals with cueing strategy. The results indicated that both of the groups who were able to incorporate cueing outperformed the group that did not have cueing. The group that used the animated visual performed the best even after re-testing a week later. Mayton concluded that animated instruction could be used to teach a dynamic process.
somehow managed to improve high spatial ability subjects and [allowed subjects] to make better use of their performance. The actual test results indicated that lower ability subjects improved more through the use of animation than through the use of text only or static pictures. The improvements shown by participants indicated that the students with lower ability were almost equal with the students of higher ability after the use of animation. This result agreed with Hays’ contention that using three-dimensional objects moving in time and space could aid the lower spatial ability students, allowing them to reach the same degree of understanding that students with higher spatial ability could attain. Additionally, graphical representations in animated form help student construct knowledge in a shared domain and improve performance (Enyedy, 1997).
In an article written by Johns and Brander (1998), they stated that using interactive computer animation software during mechanical skills training leads to improved cognitive, perceptual, and motor skills, (p.8). Their article was written to illustrate how animation could be used in a teaching environment. The purpose of animation, as described by Johns and Brander, was to improve perception of mechanical mechanisms and how to make adjustments and alignments on those mechanisms. Through application of this idea, Johns and Brander felt animations create a three-dimensional simulated world in which spatial performance could be developed. This simulated construct provides an environment that allows
could practice manipulating the objects and thereby gain knowledge within the spatial concept of the object (Johns & Brander, 1998).
Computer-Aided Design and Spatial Abilities
Sexton (1992) attempted to evaluate computer aided design as an
enhancement for teaching spatial visualization while teaching projection theory to students. A sample of 71 male undergraduate students enrolled at Ohio University in the College of Engineering formed the treatment (31) and control (40) groups. These students were taking IT101, an Engineering drawing course. Using the MRT, Sexton attempted to measure the difference in spatial visualization performance using three-dimensional CAD wireframe models versus traditional methods with two-dimensional CAD. Results from this study did not indicate significant
improvement in spatial visualization performance by using three-dimensional CAD wireframe models. Sexton thought that more research should be completed using three-dimensional CAD.
Devon, Engel, Foster, Sathianathan, & Turner (1994) investigated the effect of solid modeling on spatial visualization. The sample group for this study consisted of thirteen of fifteen sections of a first year engineering course, EG 50, with
students felt the solid modeling software was of more help than the wireframe software in helping them visualize objects in three dimensions.
Sorby (2000) presented the results of a study using three-dimensional solid modeling software and a two-dimensional drafting package in an engineering graphics class. Her sample consisted of 180 students taking GN135- Introduction to Computer Aided Drafting and Design at Michigan Technological University. Sorby used the PSVT:R (Guay, 1977), MCT, and the Differential Aptitude Test: Space Relations (DAT:SR) (Vandenberg & Kruse, 1978). Sorby’s conclusions were that just working with 3-D modeling software does not improve spatial visualization skills as much as sketching and hand drawing. Additional findings indicated that the spatial skills measured were an indication of the person’s ability to interact with the computer in a 3-D modeling environment. Sorby also indicated that spatial skills were not necessary for effective use of 2-D drafting software.
Cognitive Interaction Learning Theory
Pictures have played an important part in education. As such, the traditional theories on learning and the interaction of pictures [graphics] and text on retention have been questioned. Paivio’s dual coding theory states that text is normally processed and encoded by the verbal system, and that pictures are processed and encoded by both the imaging and verbal systems (Paivio, 1986). As such Schnotz and Grzondziel (1996) investigated the effects of mental representations in picture comprehension and the effect of animation. Research supported the idea that animated pictures support the construction of a mental model as well as the
respective mental simulations (Schnotz & Grzondziel, 1996, p.12). This cognitive function provides feedback and experience from the learning situation and is related to the Interactionist Learning theory.
Within the experiential learning theory presented by Kolb, the process of learning is based on reflecting upon existing knowledge (experience) and then forming new concepts that are applied in an active experimentation phase.
Experimentation determines which new conceptualization will provide the desired result. The process of experimentation then provides additional concrete experience (knowledge) from which the learner is able to use in the future (Kolb, 1984).
Summary
The effect of animation on spatial visualization has been investigated many times. Test instruments have been developed to measure spatial visualization. The tests have evolved and determinations have been made on the validity of each. The Mental Rotations Test and the Purdue Spatial Visualizations Tests are the most widely used to measure spatial visualization.
Animation has been hypothesized as a tool that could be used to improve spatial visualization. Research has indicated that static images provide cues which improve visualization. From this research, assumptions have been made which indicate that animated images should also be effective in improving spatial visualization (Blake, 1977; Klein, 1985; Wiley, 1990).
The results of this research have been mixed and as a result have not lead to any firm conclusions. Improvement in spatial visualization has been observed but the results of the research have not shown a significant change in spatial
CHAPTER 3: RESEARCH METHODOLOGY
Introduction
The review of the literature led the researcher to conclude that there could be other factors (not yet examined) which influence spatial visualization ability. One factor is the effects of a technical animation class on spatial visualization. The learning theory presented in this study allows for the learner to control the animation environment and for the animation system to provide immediate feed back to the learner. This allows for continuous interaction between the animation system and the learner. The teacher in this learning theory provides the control and guidance so the learner can reap the maximum benefit from the learning situation. Additionally, this chapter describes the methodology used in devising and conducting a study investigating the effects of a technical animation class on the spatial visualization ability of undergraduate students.
Purpose of Study
Research Questions and Hypotheses
As indicated in the previous chapters, certain abilities are required in order to perform spatial tasks. Zavotka (1987) stated that the ability to (1) rotate an object to another plane, (2) change the object from two-dimensional to three-dimensional, and (3) to change an object’s size are considered to be spatial in nature. As such, the questions to be investigated by this study can be stated by means of the following research questions:
1. Will instruction in a sixteen week computer animation course (group 2) significantly improve spatial visualization performance in undergraduate students?
2. Will instruction in a sixteen week basic technical graphics course (group 1) significantly improve spatial visualization in undergraduate students? 3. Will instruction in a computer animation course (group 2) provide higher
scores indicating a higher development of spatial visualization than a basic technical graphics course (group 1)?
Null Hypotheses
To answer the research questions the following hypotheses were formed: H1N – There will be no significant difference between the pre-test and
H2N – There will be no significant difference between the pre-test and
posttest mean scores on the Purdue Spatial Visualization Test – Visualization of Rotations for students who take an undergraduate technical graphics course (Group 1).
H3N – There will be no significant difference between the posttest mean scores on the Purdue Spatial Visualization Test – Visualization of Rotations for undergraduate students who take a computer animation course (Group 2) and students who take a technical graphics course (Group 1). G2=G1
Research Design
Since the researcher collected the data from two intact classes, this study used a non-equivalent control-group design (see Table 3.1). The purpose of selecting this design was to maximize the likelihood that measured differences between the
experimental and control groups would reflect the actual differences. When
Table 3.1. Research Design
Group Pretest Treatment Posttest
1- Technical Graphics (control) O1 X1 O2 2- Animation (experimental) O1 X2 O2
Key
Group – 1-control , group2 experimental, Nominal level
Score – O1-score on pretest, O2-score on posttest, Interval level
Treatment – X1-treatment provided to control group, X2 – treatment for experimental group X1 – 16 week course in technical graphics
X2 – 16 week course in animation
Instrumentation
The spatial abilities of individuals of almost all ages have been measured. Many tests have been developed for measuring different spatial factors in the
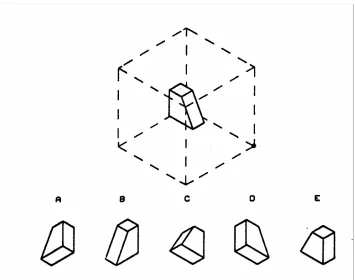
The Purdue Spatial Visualization Test, designed by Guay, is a series of items that include three different tasks to test spatial ability. This research used the Purdue Spatial Visualization Test – Visualization of Rotations (PSVT:R). The test contains thirty test items. Each test item provides an example set of figures and a test set of figures. The example set shows a new figure before and after it has been rotated about one or more axes.
The PSVR test starts off with items requiring a rotation of 90 degrees on one axis. These test items are followed by items requiring a rotation of 180 degrees on one axis, then items requiring a 90 degree rotation on two axes, and finally items requiring a rotation of 90 degrees on one axis and 180 degrees on another axis (Guay, 1980, p. 10).
The test items also provide a view of a new figure and five possible views of this figure if it is rotated about the same axes as the example set. The rotation sub-test requires the most gestalt techniques in processing strategy. Because the gestalt processing method works with mental visual images of figures as a complete unit, the PSVT:R is the best method to measure the spatial ability without the inference of analytic methods changing the strategy used in visualization. With this in mind, the PSVT:R test was chosen to be used as the test instrument for this study.
1978, Bodner & Guay, 1997). The PSVT:R contains 30 items and is a paper and pencil test with a time limit of 20 minutes. The test is considered appropriate for ages thirteen (13) and older (Guay, 1980). The instructions are designed to be
self-explanatory. The difficulty of test items is dependent on the number of axes the object is rotated around. Example items are rotated about one or more axes. The examples are used to indicate the amount of rotation and how the rotation is applied. The stimulus item [the object to be mentally rotated] for each of the questions is different and is in the form of “truncated hexahedrons, right circular cylinders, right rectangular prisms, or right triangular prisms” (Guay, 1980, p.10).
Target Population
The target population for this study is students in fields that require visualization skills for the mental manipulation of three dimensional objects. Professions in chemistry, mathematics, various fields in engineering, and technical graphics are the primary target groups considered for this study. However, this research could be applied to the general population in any area that has an interest in or requires improved spatial visualization requirements.
Sample
twelve (12) students that were enrolled in an animation class (a special topic class) also taught in the fall semester of 2001.
Procedures
Each class took the PSVT:R as a pre-test during the second week of the semester. This helped to eliminate students that dropped the class in the first week. The posttest was administered during the last week of class. The researcher
administered the pretests and posttests to all of the classes that participated in the study.
The treatment provided to group 1 was that of the normal instruction and assignments for the Foundations of Graphics classes. Instruction included the topics of sketching, geometric relationships, multiview sketching, isometric sketching, dimensioning practices, and section and auxiliary views. Instruction in AutoCAD ® was also provided to acquaint the students with CAD applications. The students in group 1 were required to learn how to use the AutoCAD ® program by completing provided tutorials and completing two major projects that allowed the students to demonstrate their competency in technical graphic fundamentals and AutoCAD ® .
The projects consisted of simple animation actions for Flash ®, the animation of a cross sectional view of an internal combustion engine and in TrueSpace ®, objects rolling off a table and bouncing on the floor. Primary emphasis was placed on 3D Studio Max ® in which the students were required to create a one minute animation on any technical subject of their choosing.
Analysis of Data
Questions 1 and 2 were answered by using a paired samples T-test (small sample) for a difference in means between the pretest and posttest scores on the Purdue Spatial Visualization Test – Visualization of Rotations (PSVT:R) collected at the beginning and end of the sixteen week instruction period. Question 3 was answered by using an independent sample T-test for a difference in means between the posttest score of groups 1 and 2.
The pretest data was collected from each class in the second week and the posttest data was collected the last week of class for both groups. The pretest/posttest data collected for both sample groups appears in Table 4.1.
Dependent Variable
Independent Variables
The independent variable for this study was the treatment provided to the classes. The technical graphics class was taught by the researcher and used as the control group. The animation class received the treatment of a sixteen week course in animation and was taught by another instructor. The instructors of both groups worked together as colleagues. The researcher acted as a substitute instructor in the animation classes.
Summary
The validity of the Purdue Spatial visualization of Rotations Test has been shown and identified as the most appropriate instrument for testing spatial
visualization without the influence of analytical processes (Guay, 1980).
The sample groups used in this study consisted of thirty-one (31) students, and is considered to be a representative sample of the students taking the various Graphic Communications classes.
Additionally, the researcher administered the test to each of the sample groups and read the instructions with no variation as provided with the PSVT:R. The questions to be addressed by this research are:
1. Will instruction in a sixteen week computer animation course (group 2) significantly improve spatial visualization performance in undergraduate students?
3. Will instruction in a computer animation course (group 2) provide higher scores indicating a higher development of spatial visualization than basic technical graphics course (group 1)?
The research design for this study was a non-equivalent control-group design and used the Purdue Spatial Visualization Test – Visualization of Rotations (PSVT:R) as the test instrument. The target group for this research is anyone in the professions in chemistry, mathematics, various fields in engineering, and technical graphics.
CHAPTER FOUR: PRESENTATION OF DATA
Introduction
This chapter is divided into two sections. The first section presents demographic data on the participants. The second section presents the data related to the analysis of the scores for the PSVT:R.
Description of Participants
Group One – Technical Graphics (Control Group)
The Foundation of Graphics class is an introductory class in the technical graphics area. The emphasis of this class is to provide an orientation to the language of engineering graphics. This includes a knowledge base of the various types of drawings (perspective and parallel projections) with emphasis on the principles of orthographic projections (multiview), the need for sections and auxiliary drawings, and dimensioning and tolerancing standards, plus visualization techniques.
Additional work is focused on the Concurrent Engineering Design Method. The principles learned are applied using a software package to produce a final project for the class.
with twenty-four students but through attrition class size was reduced to nineteen (19) students by the end of the semester.
The final student makeup for the class taught in the fall semester of 2001 was 6 females and 14 males. These students were primarily electrical engineering, civil engineering, and mechanical engineering majors who were taking the class as a general education elective. Additionally, there was a Technology Education major and a Psychology major enrolled in the class. The former was required to take the class and the latter was taking the class as an elective. A summary of the
demographic data appears in Table 4.1.
Group Two – Animation (Experimental Group)
The animation class was taught in the fall semester of 2001. The class had no pre-requisites and was open to all students. The treatment was that of a fifteen-week course, (consisting of four hours of lecture/lab each week) in which animation fundamentals, history, and techniques were taught. The students were shown how to use three different animation packages. These packages included: Flash ®, a two dimensional program for web page animation; TrueSpace ®, a three dimensional animation package for animated game creation; and 3D Studio Max ®, a
professional animation package. As each animation package was discussed, the students developed a mini-project. At the end of the sixteen week course each
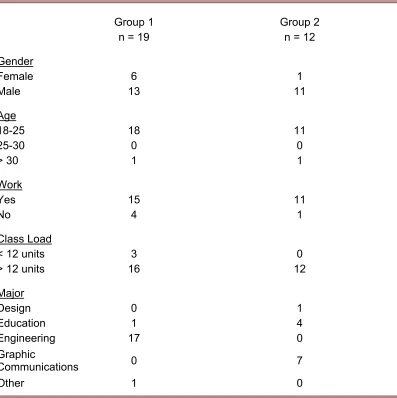
Table 4.1. Demographic Data
Group 1 Group 2
n = 19 n = 12
Gender
Female 6 1
Male 13 11
Age
18-25 18 11
25-30 0 0
> 30 1 1
Work
Yes 15 11
No 4 1
Class Load
< 12 units 3 0
> 12 units 16 12
Major
Design 0 1
Education 1 4
Engineering 17 0
Graphic
Communications 0 7
Other 1 0
Demographic data was collected from each of the students by the researcher. The class started with sixteen students and finished with thirteen students. At the beginning of the semester, the class consisted of two females and fourteen males. By the end of the semester, three of the males had dropped out. The females in the class had no previous experience in technical graphics. However, one female was
several of the technical graphics courses, and many of them had considerable experience in the technical graphics area. Four of the students in this class were Technology Education majors and seven were Graphic Communications majors. The only exception was the female who was a design major. The age of the students in this group ranged from twenty-four to twenty-nine and one student was forty-two. Eleven of the twelve students were employed in part time work and also had a
minimum of twelve semester hours of course work. A summary of the demographic data appears in Table 4.1.
Analysis of Scores
Utilizing the data collected from the classes, the groups (technical graphics or animation) were analyzed by performing a paired sample T-test for questions 1 and 2 and an independent samples T-test for a difference in means for question 3. The scores for each group are provided in Appendix A.
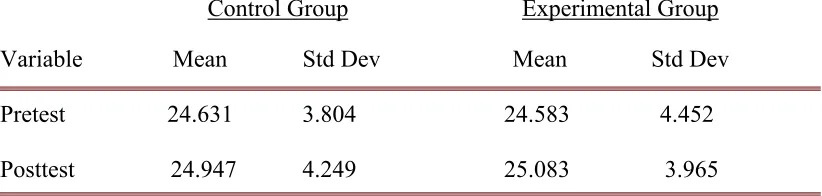
Table 4.2 examines the scores obtained on the PSVT:R for both the control and experimental groups as seen in questions 1 and 2.
Table 4.2. Pretest and Posttest Scores by Treatment Group
Control Group Experimental Group
Variable Mean Std Dev Mean Std Dev Pretest 24.631 3.804 24.583 4.452
Question 1
To investigate question 1, will training in computer animation significantly improve spatial visualization performance, the data collected for Group 2 (animation group) will be analyzed using the following hypothesis.
H1N – There will be no significant difference between the pre-test and posttest mean scores on the Purdue Spatial Visualization Test – Visualization of Rotations for students who take a computer animation class (Group 2). H1A – There will be a significant increase between the pre-test and posttest mean scores on the Purdue Spatial Visualization Test – Visualization of Rotations for students who take a computer animation class (Group 2).
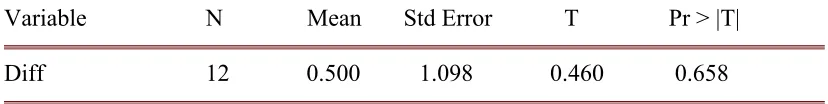
The results of the paired sample T-test using the pretest and posttest for the Experimental group are given in Table 4.3. As shown the analysis failed to reveal a significant difference between the pretest and posttest groups. A T-score of 0.460 and a corresponding p value of 0.658 indicate that there is no significant difference between the pretest and post test score on the PVST:R for the Animation (experimental) group. Thus the analysis of the data leads to the conclusion that the null hypothesis cannot be rejected for Question 1.
Table 4.3. Analysis of Mean Gain Scores for the Experimental Group
Question 2
To investigate question 2, will training in a Foundations of Graphics significantly improve spatial visualization performance, the data collected for Group1 and the second hypothesis will be used.
H2N – There will be no significant difference between the pre-test and
posttest mean scores on the Purdue Spatial Visualization Test – Visualization of Rotations for students who take a foundation of graphics class (Group 1). H2A – There will be significant increase between the pre-test scores and posttest mean scores on the Purdue Spatial Visualization Test – Visualization of Rotations for students who take a foundation of graphics class (Group 1).
The results of the paired sample T-test using the pre-test and posttest for the Control group are given in Table 4.4. As shown, this analysis failed to reveal a significant difference between the two groups (pre-test and posttest), a t-score of 0.440 with a corresponding p-value of 0.669. The analysis of the data leads to the conclusion that the null hypothesis cannot be rejected for Question 2.
Table 4.4. Analysis of Mean Gain Scores for the Control Group
Question 3
Investigation of question 3, will training in computer animation provide higher average scores on the PSVT:R than the Foundations of Graphics class and introduction to engineering graphics class, will be completed by using the data collected for the graphics group and the animation group and hypothesis 3.
H3N – There will be no significant difference between the posttest mean scores on the Purdue Spatial Visualization Test – Visualization of Rotations for students who take a computer animation class (Group 2 – Treatment) and students who take the Foundations of Graphics class or introduction to engineering graphics class (Group 1 – Control). G2 = G1
H3A – There will be a significant difference between the posttest mean scores on the Purdue Spatial Visualization Test – Visualization of Rotations for students who take a computer animation class (Group 2) and students who take the Foundations of Graphics class or introduction to engineering graphics class (Group 1). G2 ≠ G1
by the statistical software; this test indicated that there was no significant difference between the variations of the posttest scores.
Table 4.5. Analysis of Posttest Scores between Treatment Groups
Variable DF T Pr > |T| Posttest 24.8 0.090 0.929
Summary
CHAPTER FIVE: SUMMARY, CONCLUSIONS, DISCUSSION,
RECOMMENDATIONS
Introduction
The purpose of this study was to investigate the effect of using computer animation as a tool for improving spatial visualization performance in college students. The researcher investigated whether the use of computer animation and computerized modules of instruction can produce beneficial results on the
understanding and improvement of spatial visualization abilities. The results of this study are expected to be important in the advancement of the use of computer animation in teaching.
Animation is capable of providing both real and apparent motion which provides realism and results in improved viewer perceptions of the relations between objects (Blake, 1977). Computer animation takes advantage of the ability to provide meaning, illustrate, and give organization to the material being taught (Klein, 1985; Profit & Kaiser, 1986). As such, animation is used in many fields of study (Bodner & Guay, 1997; Strong & Smith, 2001).
animation. Animated visuals allowed better retention in student learning and
communicated ideas involving time and space better than text (Hays, 1996; Mayton, 1991).
Viewer controlled animation provides significantly improved depth perception and can increase conceptual ideas through the development of mental models (Williamson & Abraham, 1995; Wiley, 1990). Additionally, viewer
controlled animation leads to improvement in cognitive, perceptual, and motor skills and allows the creation of a three-dimensional simulated world in which spatial performance can be developed, assisting in anchoring the student into reality for the use of visual objects (Johns & Brander, 1998).
In order to develop animation tools that improve spatial visualization, previously developed tests have been used as measurement instruments. These tests have been developed and validated over time and usage. The list of tests include the Revised Minnesota Paper Form Board (Likert & Quasha, 1970), the S-M mental rotations test (Shepard & Metzler, 1971) later revised by Vandenberg and Kuse (1978), The Purdue Spatial Visualization Test (a series of three tests) developed by Guay (1976) and later experimentally modified by Branoff (1998, 1999) with coordinate axes added and a molecular rotations test developed by Seddon,
Statement of Problem
The purpose of this study was to determine whether instruction in technical animation improves spatial visualization in undergraduate students more than instruction in technical graphics. A sample of 31 students was used as a control and experimental group. The research design was a non-equivalent control-group design to maximize the likelihood that measured differences would reflect real differences and to improve validity. A pretest and posttest were administered to each group using the PSVT:R.
Research Questions and Hypothesis
To study the possibility of improving spatial visualization skills, the investigation asked the following questions:
1. Will instruction in a sixteen week computer animation course (group 2) significantly improve spatial visualization performance in undergraduate students?
2. Will instruction in a sixteen week basic technical graphics (group 1) significantly improve spatial visualization performance in undergraduate students?
3. Will instruction in a computer animation course (group 2) provide higher scores indicating a higher development of spatial visualization than basic technical graphics course (group 1)?
of Rotations (PSVT:R) collected at the beginning and end of the sixteen week instruction period. The hypotheses for questions 1 and 2 were:
H1N – There will be no significant difference between the pre-test and posttest mean scores on the Purdue Spatial Visualization Test – Visualization of Rotations for students who take a computer animation class (Group 2).
The results of the paired sample T-test for the animation group using the pre-test and postpre-test are given in Table 4.3. This analysis failed to reveal a significant difference between the two groups (pre-test and posttest), a t-score of 0.460 with a corresponding p-value of 0.658. The high p-value as seen in Table 4.3 would indicate that no significant improvement in spatial visualization performance had occurred over the period of the course and the students had not collectively improved their spatial visualization performance.
H2N – There will be no significant difference between the pre-test and
To answer question 3 it was necessary to use the posttest data for both of the groups. Using the posttest results, a difference in means test was performed to see if there was a significant difference in mean scores between the animation group and the graphics group.
H3N There will be no significant difference between the posttest mean scores on the Purdue Spatial Visualization Test – Visualization of Rotations for students who take a computer animation class (Treatment) and students who take the Foundations of Graphics class (Control). G2 = G1
Procedures
The sample groups were administered the thirty question PSVT:R as a pretest during the second week of a sixteen week class in either animation (group 2) or in a beginning technical graphics class (group 1).
Treatment for the experimental group was provided in the form of
instruction. The instruction included animation history, theory, and techniques. The students were provided hands on experience with three different animation packages and were required to produce short animations with each.
Treatment for the control group consisted of the normal Foundations of Graphics class. The students were instructed in sketching, isometric sketching, multiview sketching, dimensioning, and section and auxiliary views. Additional training was provided in a CAD package.
do their best. The researcher administered the pretest and post test to both of the sample groups. The instructions from the PSVT:R were read to the students prior to the start of the evaluation and no other form of instruction was given. All groups received the same instructions. Scores for students that took the pretest but not the posttest were removed from the sample group to prevent skewing of the results of mean calculations.
The pretest and posttest scores collected were used to perform
comparisons within each group to determine if any significant difference existed in the before and after test scores or between the groups in the posttest scores. The researcher taught the students in the technical graphics group. Dr. A. Clark taught the students in the animation group.
Demographic Data on Participants
The choice of this population was made for practical considerations that involved the availability of subjects, the willingness of their instructor to participate, and cooperativeness of the students to work with the educational research efforts of the university.
The sample groups in this study consisted of students from two classes in the Graphic Communications Program area group of the Department of
2). Group 1 consisted of 6 females and 13 males for a total sample size of 19. The students in group 1 were primarily biological and chemical engineering students, with a few electrical and civil engineering students who were taking the class as a general education elective. Group 2 consisted of 1 female and 11 males for a sample size of 12 students. The female in the class had no previous experience in technical graphics. All of the male students in the class had previously taken several of the technical graphics courses, and many of them had considerable experience in the technical graphics area. Most of the students in this class were either Technology Education or Graphic Communications majors. The only exception was the female who was a design major.
Analyses
Question 1 – Will instruction in a sixteen week computer animation class (group 2) significantly improve spatial visualization scoreson the Purdue Spatial Visualizations Test – Visualization of Rotations? It was hypothesized that there would be no significant difference between the pretest – posttest scores on the
Question 2 – Will instruction in a sixteen week basic technical graphics class (group 1) significantly improve spatial visualization scores on the Purdue Spatial Visualizations Test – Visualization of Rotations? It was hypothesized that there would be no significant difference between the pretest – posttest scores on the PSVT:R for the treatment group. Analysis using a paired samples T-test between the pretest/posttest indicated there was no significant difference in scores between the pretest and posttest (t = 0.44, p = 0.6686). The failure to reject the null hypothesis indicated there was no significant difference between the pretest and posttest scores on the Purdue Spatial Visualizations Test – Visualization of Rotations for the
technical graphics group. This indicates that there was no significant improvement in the spatial visualization scores of the students that took part in the sixteen week technical graphics class. The findings support Null Hypothesis #2.
Question 3 – Will training in a sixteen week computer animation class (group 2) provide higher scores on the Purdue Spatial Visualizations Test –
on the Purdue Spatial Visualizations Test – Visualization of Rotations for the animation and technical graphics groups. The findings support Null Hypothesis #3.
Conclusions and Discussion
Although the results of this study cannot be generalized to populations other than the ones that are similar to those that were used in this study, the results
indicated the following:
A. The students in the animation group did not significantly improve their spatial visualization. A possible explanation for the lack of significant improvement is that the spatial visualization of these students were previously developed and that no further improvement in scores could be measured with the PSVT:R.
B. The students in the technical graphics class did not significantly improve their spatial visualization. A possible explanation for the lack of
significant improvement is that the spatial visualization of these students were previously developed and that no further improvement in scores could be measured with the PSVT:R.
C. The lack of significant difference in spatial visualization performance between the test groups is surprising. It had been noted that animation should improve spatial visualization performance.
significant improvement in spatial visualization of these students could not be measured with the PSVT:R, and a different test instrument should have been used. The change in spatial visualization ability may have been too small for the
instrument to measure. It may well be necessary to use a combination of instruments to measure the change in spatial visualization. A third explanation is that the
technical graphics classes were provided with ample learning techniques that brought them to a level equal to the students in the animation group. The students in the animation class, with one exception, had taken the same Foundations of Graphics class. Many of these same students had taken additional advanced graphics courses. These classes may have only provided for further improvement in design and
technical techniques, not improvement in spatial visualization skills. A fourth explanation is that there was no real improvement in either of the test groups so no difference existed. The level of spatial visualization may have already been
developed by the students’ life experiences. A fifth possible cause for no difference is the instruction provided to the test groups. The instruction provided to the
students may have only improved technical skills and not been geared towards improving spatial visualization skills. Additionally, students in engineering and technical majors are suspected of having developed spatial visualization skills through previous life experiences. That ability would tend to attract students to the engineering and technical fields of study. Finally, it is possible that a single course in animation is not sufficient to improve spatial visualization.
completed with a larger sample and a different instrument or combination of instruments to measure the spatial visualization of the students.
Implications for Teaching
Educators in technical animation and engineering and technical graphic should consider the results of this study before integrating animation activities into the curriculum if the sole purpose is to increase spatial visualization over the course of one semester. It appears that neither instruction in animation nor technical graphics had any significant effect on students’ spatial visualization ability as measured by the PSVT:R. Teachers should use animation to some extent in
classroom activities if the opportunity presents itself. Student exposure to animation should only enhance the learning experience by providing the student with new knowledge and experience.
Recommendations for Future Research
REFERENCES
Baartmans, B. G., & Sorby, S. A. (1996). Introduction to 3-d spatial visualization. Englewood Cliffs, NJ: Prentice Hall Inc., chap. 1,2.
Bandura, A. (1993). Perceived self-efficacy in cognitive development and functioning. Educational Psychologist, 28(2), 117-148.
Bigge, M. L., & Shermis, S. S. (1998). Learning theories for teachers (6th ed.). New York: Longman, pp. 154-210.
Blake, T. (1977). Motion in instructional media: Some subject-display mode interactions. Perceptual and Motor Skills, 44, 975-985.
Bodner, G. M., & Guay, R. B. (1997). The purdue visualization of rotations test. The Chemical Educator, 2(4), 1-18.
Branoff, T. J. (1998). The effects of adding coordinate axes to a mental rotations task in measuring spatial visualization ability in introductory undergraduate technical graphics courses, Engineering Design Graphics Journal, 62(2), 16-34.
Branoff, T. J. (1999). Coordinate axes and mental rotations tasks: A solomon four group design, Engineering Design Graphics Journal, 63(3), 4-14.
Bush, A. J., & Gresham, L. G. (1986) Research note the communication effects of animation. Journal of Applied Communication Research, 14(1), 59-65.
Caraballo, J. N. (1985). The effect of various visual display modes in computer-based instruction and language background upon achievement of selected educational objectives. Unpublished doctoral dissertation, Pennsylvania State University.
Coleman, S. L., & Gotch, A. J. (1998). Spatial perception skills of chemistry students. Journal of Chemical Education, 35(2), 206-206.
Devon, R., Engel, R. S., Foster, R. J., Sathianathan, D., & Turner, G. F. W. (1994). The effect of solid modeling software on 3-d visualization skills, Engineering Design Graphics Journal, 58(2), 4-11.