Food Recognition System Using Texture
Feature Extraction
Urmila J. Dhorajiya, Prof Bijal J.Talati
ME Student, Dept. of Computer Engineering, Sardar Vallabhbhai Institute of Technology, Vasad, Anand , Gujarat, India.
Head, Dept. of Computer, Sardar Vallabhbhai Institute of Technology, Vasad, Anand, Gujarat, India.
ABSTRACT: Poor diet is one of the key determinants of an individual’s risk of developing chronic diseases. With increasing of unhealthy diets which will harm people’s life due to the affected result like Diabetics, Heart stoke etc. So that caring for healthy life give more attention to manage dietary life is very important. In this research, we aim to construct a food recognition could be used to estimate a meal’s carbohydrate content for managing dietary life, this study propose a methodology for automatic Food recognition. For this food image segment with considers feature texture using Entropy categorization and Fractal estimation (EFD) for more accuracy and classify image using the SVM classifier.
KEYWORDS: Entropy categorization and Fractal estimation(EFD), feature extraction, food recognition, image classification.
I. INTRODUCTION
Automatic food recognition is emerging as an important research topic in object recognition because of the demand for better dietary assessment tools to battle obesity. The goals of such systems are to enable people to better understand the nutritional content of their dietary choices and to provide medical professionals with objective measures of their patients’ food intake [1]. People are not very accurate when reporting the food that they consume. As an alternative to manual logging, we investigate methods for automatically recognizing foods based on their appearance. Kong and Tan [5] proposed the use of scale invariant feature transform (SIFT) features clustered into visual words and fed to a simple Bayesian probabilistic classifier that matches the food items in a food database containing images of fast-food, homemade food, and fruits. A recognition performance of 75.3% [6] was reported given that the number of references per food class in the database is larger than 50 and the number of food items to be recognized is less than 25.
In the following we will give a brief overview on food detection and recognition method. Color and texture are the fundamental character of food images, and play an important role in visual perception. Color has been engaged in identifying objects for many years. In color classification process the information concerning the spectral properties of object surfaces is extracted.
II. LITERATURE SURVAY
features for statistical texture description [18], which are also based on multifractal analysis. In this paper, we have texture descriptors suitable for food categorization. Based on multifractal analysis theory, we propose an Entropy-based categorization and Fractal Dimension estimation (EFD), and a Gabor-based image segmentation. A performance comparison between our methods and well-known texture description approaches is presented for texture classification and object (food items) categorization tasks [6].
Feature type Classification Mean Classification Std. Dev.
SIFT+BoF 75.3% 1.5
EFD+KNN 79.2% 2.1
Gabor based+KNN 72.2% 1.3
Table 1: classification rate using different method [6]
Texture is one of the most active topics in machine pattern analysis from the 1950s, which tries to discriminate different patterns of images by extracting the dependency of intensity between pixels and their neighboring pixels [2] or by obtaining the variance of intensity across pixels [3].In this research for finding texture feature from food images use of entropy categorization and Fractal Dimension Estimation(EFD). Recently, different features of color and texture are combined together in order to measure the food nutrition more accurately [4].
In the classification phase, some features (such as color and texture) for each training picture will be extracted, and stored in a feature library. In the recognition phase, each captured image will be compared with the training set, using the minimum distance measure. Among the training set pictures the one with minimum distance will be selected as the best match.
III. PROPOSED SCHEME
a. Proposed System workflow
b. Pre-processing
In image processing, normalization is a process that changes the range of pixel intensity values. Applications include photographs with poor contrast due to glare, for example. Normalization is sometimes called contrast stretching or histogram stretching. In more general fields of data processing, such as digital signal processing, it is referred to as dynamic range expansion [22].
c. Food Segmentation
Food segmentation using color and texture features the use of RGB model and entropy based fractal dimension characterization method for more feture extraction.
d. Food Recognition
The recognition module consists of two stages: description and classification. In this study, we use color and texture feature sets for the food description and both sets are histogram-based so they can be easily computed regardless the segment’s normalized based on its size. As for color features, the histogram of the 1024 most dominant food colors was used. To this end, a hierarchical version of the SVM algorithm is applied to cluster the color space created by the training set of food images. In pattern recognition, the SVM algorithm is a non-probalistics method used for classification and regression [23]. More formally, a support vector machine constructs a hyperplane or set of hyperplanes in a high- or infinite-dimensional space, which can be used for classification, regression, or other tasks. Intuitively, a good separation is achieved by the hyperplane that has the largest distance to the nearest training-data point of any class (so-called functional margin), since in general the larger the margin the lower the generalization error of the classifier.
IV. METHODS DESCRIPTION
a. A Fractal signatures for texture characterization
Fractal representation is an idealization of natural textures. Many self-similar images, e.g. textures, are complex entities formed by many structural components that as a whole can provide a fractal nature. In 1984 Pentland [19] suggested that images of natural scene can be described by fractal information. By representing a grayscale image in a 3-D space, where (x, y) denote the 2-D coordinate position and the gray-level intensity denotes the third coordinate, Pentland showed that the fractal dimension (FD) closely describes an intuitive notion of surface roughness. Maldebrot [20] showed that fractal objects are constant under certain types of scale transformations. He suggested that most of the natural phenomenons satisfy the power law. This can be written as [20]:
( )
/
DI
s
K
s
(1)where I(s) represents the unit measure, in this case the gray-level intensity, s the scale used, and D is the fractal dimension (Hausdorff-Besicovitch dimension). In texture representation, FD alone does not fully represent a rich description. Different textures may have the same FD due to combined differences in directionality and coarseness [20]. These uncertainties can be addressed by multifractal analysis [21, 15], where a point categorization is defined on the object function based on some criteria. The FD is estimated for every point set according to this categorization. A common criteria for categorization is the probably density function estimated from the image intensity [15, 16].
b. A Entropy Categorization and FD Estimation (EFD)
x s x p 2 x p
H
P M l o g P M(2)
Where s is the pixel value range, i.e. (s=0,..., 255), and PX, MP is the probability of a pixel value (in Mp). Once the entropy is estimated for all the pixels in the texture image, we cluster regions where the entropy function exhibits similar values. For a given entropy u, ¡u represents the set of pixels {x : x ∈R2 and Hx ∈ (u,u +d)}, for some arbitrary d. Once this pixel categorization is completed, we estimate dim (¡u), the FD for each ¡u. We used the Box-counting dimension to estimate the FD. For a nonempty finite subset S of a Euclidean space RN, the Box-counting dimension would represent the number of boxes of side length e (Ne) covering S [9], i.e.:
0
lo g lim
lo g
S
N
F D
(3)
In our case, the subset S represents the gray-level surface of the ¡u. Taking q×q×q cube boxes, Ne is the number of boxes that intersect with the curved surface of the image in order to cover ¡u. For each of the entropy levels we estimate one FD¡u value. The final texture signature is formed by fusing all the FD¡u into one single feature vector. Figure 1 summarizes the proposed approach.
Figure 2.E ntropy-based Multi-fractal Analysis Block Diagram (EFD).
V. EXPERIMENTAL EVALUATION
a. Texture Datasets Experiments
To assess the efficiency of the proposed signatures in order to characterize food textures, we performed several segmentation experiments using color images was created by collecting images from the web. We used the entire database, i.e., a total of 54 texture images, each texture sample image first normalizes size, then apply Gabor filter for texture segmentation and also apply EFD method for feature vector.
Food images EFD method for feature extaction (visualize image)
Segmentation result Observation
Showing both result texture of uttapam image identify EFD method more feature extract.
After analyzing results show that if food have no texture, then feature extraction is almost same.
In this image texture visualize is more in EFD method.
Table 2: food image texture and segmentation visualize result
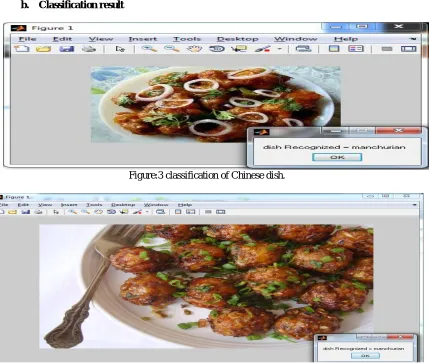
b. Classification result
Figure 5:Classification of south indian dish.
Figure 6:Classification of south Indian dish.
VI. DISCUSSION AND FUTUREWORK
From the results shown in this paper, we can see that categorization based fractal features perform better than classical texture models that use other statistical information. EFD consistently has better correct classification rates. Despite the fact that natural food textures cannot be defined as pure fractals, their structural components are arranged in such a way that follows a fractal-based description. We observed that fractal information from the filtered response can encode more discriminating power. The categorization criteria selected in multifractal analysis have also proven to be an important factor in the method’s efficiency. We found that the entropy-based categorization performed the best; As future work, we will plan to increase the number of food classes and after segment food find the area of the food item for calculate the carbohydrate content.
VII. CONCLUSION
and in a food texture dataset. We have shown that for food feature visualize result using EFD method is good and after that classify food image with use of SVM classifier.
REFERENCES
[1] R. Spector. Science and pseudoscience in adult nutrition research and practice. Skeptical Inquirer, 33,2009.
[2] Kartikeyan, B and Sarkar, A, “An identification approach for 2-D autoregressive models in describing textures,” Graphical Models and Image Processing, vol.53, pp.121-131, 1991.
[3] Haralick, R. M., Shanmugan, K. and Dinstein, I., “Textural features for image classification,” IEEE Transactions on Systems, Man, and Cybernetics, vol. 3, pp. 610 - 621, 1973. [4] Jain, A and Healey,G, “A multiscale representation including opponent color features for texture recognition,” IEEE Transactions on Image Processing, vol.7, No.1, pp. 124-128, 998.
[5] F. Kong and J. Tan, “DietCam: Automatic dietary assessment with mobile camera phones,” Pervasive Mobile Comput., vol. 8, pp. 147–163, Feb. 2012.
[6] Bosch, Marc, et al. "Food texture descriptors based on fractal and local gradient information." Signal Processing Conference, 2011 19th European. IEEE, 2011.
[7] C. Shannon, “A Mathematical Theory of Communication”, Bell System Technical Journal, vol. 27, pp. 379-423, 23-656, July, October, 1948. [8] T. Kadir, and M. Brady, “Scale, Saliency and Image Description”, International Journal of Computer Vision, vol.
45, no. 2, pp. 83-105, November 2001.
[9] N. Sarkar, and B. Chaudhuri, “An Efficient Differential Box Counting Approach to Compute Fractal Dimension of Images”, IEEE Transactions on Systems, Man and Cybernetics, vol. 24, pp. 115-120, 1994
[10] S. Lloyd, “Least squares quantization in PCM,” IEEE Transactions on Information Theory, vol. 28, no. 2, pp. 129–137, 1982.
[11] T. Ojala, M. Pietikainen, D. Harwood, A comparative study of texture measures with classification based on feature distributions, Pattern Recognition, vol. 29, no. 1, pp. 51-59, 1996.
[12]J. Zhang, M. Marszalek, S. Lazebnik, and C. Schmid, “Local Features and Kernels for Classification of Texture and Object Categories: A Comprehensive Study”, International Journal of Computer Vision, vol. 73, no. 2, pp. 213-238, June 2007.
[13]S. Lazebnik, C. Schmid, and J. Ponce, “A Sparse Texture Representation Using Affine-Invariant Regions, ” Proceedings of the International Conference on Computer Vision and Pattern Recognition (CVPR), vol. 3, pp. 319-324, 2003.
[14] J. Vehel, P. Mignot, and J. Merriot, “Multifractals, Texture, and Image Analysis, ” Proceedings of the IEEE Conference on Computer Vision and Pattern Recognition (CVPR), pp. 661- 664, 1992.
[15] K. Falconer, Fractal Geometry: Mathematical Foundations and Applications, Wiley, England, 1990.
[16] Y. Xu, H. Li, and C. Fermuller, “A Projective Invariant for Textures, ” Proceedings of the IEEE Conference on Computer Vision and Pattern Recognition (CVPR), vol. 2, pp. 1932-1939,
New York, 2006.
[17] Y. Xu, X. Yang, H. Ling, and H. ji, “A New Texture Descriptor Using Multifractal Analysis in Multi-orientation Wavelet Pyramid, ”
Proceedings of the IEEE Conference on Computer Vision and Pattern Recognition (CVPR), San Francisco, 2010.
[18] M. Varma, and R. Garg, “Locally invariant fractal features for statistical texture classification, ” Proceedings of the International Conference on Computer Vision, vol. 1, pp.1-8, 2007.
[19] A. Pentland, “Fractal-Based Description of Natural Scenes,” IEEE Transactions on Pattern Analysis and Machine Intelligence (PAMI) vol. 6, no. 6, pp. 661-674, November 1984.
[20] B. Mandelbrot, Fractals: Form, Chance and Dimension, San Francisco, CA: Freeman 1977.
[21] P. Sailhac, and F. Seyler, Texture Characterisation of ERS-1 Images by Regional Multifractal Analysis, edJ. Levy Vehel, Fractals in Engineering, Springer, pp.32-41, 1997.
[22] Rafael C. González, Richard Eugene Woods (2007). Digital Image Processing. Prentice Hall. p. 85. ISBN 0-13-168728-X.