ISSN (Print) : 2320 – 3765 ISSN (Online) : 2278 – 8875
I
nternational
J
ournal of
A
dvanced
R
esearch in
E
lectrical,
E
lectronics and
I
nstrumentation
E
ngineering
(An ISO 3297: 2007 Certified Organization)
Vol. 5, Issue 1, January 2016
Determination of ATC Using DCPTDFs Based
Approach in Deregulated Market
Sameena Khan
1, Sanjeev Kumar
2,
Kusum
3M.Tech scholar, Dept. of EE, Yamuna Institute of Engineering And Technology, Gadholi, India1 Assistant professor, Dept. of EE, Yamuna Institute of Engineering And Technology, Gadholi, India2
Assistant professor, Dept. of CSE, Maharishi Makandeshwar Engineering College, Ambala3
ABSTRACT
:
Deregulated electricity industry aims to create a competition in market to trade electricity, which gives new opportunities to deal with technical challenges of market participants and power system researchers. The benefits are efficient capacity expansion planning, cheaper electricity, cost minimization, and better services. For better transmission services support in electricity industry and full utilization of transmission assets, Available Transfer Capability (ATC)must be calculated. Available transfer capability (ATC) of transmissionnetwork is the extra amount of power transfer that can betransmitted between the buyer bus and seller bus without any loss ofsecurity. For proper operations of system under the varioustransactions, ATC calculations must be fast andaccurate enough. In this paper by using DCPTDF scheme the ATC is calculatedwith and without line contingency caseand then the corresponding values of ATC are compared. The multiple line contingencies and their effecton the value of ATC are shown. The above said methodology is implemented on IEEE 24-bus test system.KEYWORDS: Available transfer capability, DC power transfer distribution factors, and line outage contingency, and
line outage distribution factors.
I. INTRODUCTION
ISSN (Print) : 2320 – 3765 ISSN (Online) : 2278 – 8875
I
nternational
J
ournal of
A
dvanced
R
esearch in
E
lectrical,
E
lectronics and
I
nstrumentation
E
ngineering
(An ISO 3297: 2007 Certified Organization)
Vol. 5, Issue 1, January 2016
II. METHODOLOGY FOR ATCDETERMINATION
A. Power Transfer Distribution Factors Based On DC Load Flow Approach
Assuming the line resistance equal to zero, no charging capacitance of the lines, all terminal voltages equal to 1 p.u at all buses, the N-R load flow equations can be approximated in the simple form. These equations are called DC load flow. The DC load flow equation, describing the relationship between the bus voltage angle vector [] and real power injection vector [P] for a NB-bus system, is given as follows:
[P]=[B][δ]
Where, [B] is the NBx NB susceptance matrix, whose entries are:
The change in injected power at any bus i can be written as:
Ρ
i
Β
δ
iwhere
i
Ρ
matrix which shows change in real power at bus i.B is susceptance matrix.
i
Δδ matrix which shows change in voltage angle at any bus i.
The DC power transfer distribution factors (DCPTDFs) are the linear sensitivity factors which relates the change in the real power flow in a line to the change in a transaction between seller bus m and buyer bus n.Mathematically this can be defined as:
DCPTDF = ∆Pij ∆Pmn
For calculating PTDFs, the power flow equation for DC load flow and its sensitivity calculation is essential. Real power flows in a line connected between bus i and bus j using DC power flow formulation is given as:
Pij= δi−δj
xij = bij(δi− δj)
Where, xij and bijare the series reactance and susceptance of the transmission line.
i is the phase angle of voltage at bus i.
The DCPTDFs for a line between buses i and j and a transaction between a seller bus m and a buyer bus n can be expressed as:
DCPTDFij −mn =
Xim−Xjm−Xin+Xjn xij
B.Line Outage Distribution Factors
ATC is constrained by the effects of contingencies. The dc power flow can be used to compute the effects of each line outage and then the PTDFs applied to find transfer limits but by using LODFs the computational speed can be increased. LODFs and PTDFs can be combined together to evaluate the first contingency incremental transfer capability, which is the maximum increase in transaction amount from one zone to another zone. Wheneverthere occurs an outage, the power flowing on the outage line is redistributed on the remaining lines in the system. The line outage distribution factors (LODF) is a measure of this redistribution. DCLODFij-rs is the fraction of the power flowing on the
line from bus/zone r to bus/zone s before the line outage (Prso), which now flows over a line from bus/zone i to bus/zone
ISSN (Print) : 2320 – 3765 ISSN (Online) : 2278 – 8875
I
nternational
J
ournal of
A
dvanced
R
esearch in
E
lectrical,
E
lectronics and
I
nstrumentation
E
ngineering
(An ISO 3297: 2007 Certified Organization)
Vol. 5, Issue 1, January 2016
DCLODFij−rs =
∆Pij −rs
Prs°
where, r and s are the buses/zones connecting a line, whose outage is being simulated. In terms of line series reactance and elements of matrix [X] of DC load flow, DCLODFs can be expressed as:
DC LODFij −rs =
Nrsxrs(Xir − Xis − Xjr+ Xjs)
Nijxij[Nrsxrs− Xrr+ Xss− 2Xrs ]
Where,
xijand Xirare the series reactance of the line ij and irth element of matrix [X].
Nij are the number of parallel circuits connecting bus/zone i and bus/zone j.
C.ATC Determination Using DCPTDFs for Intact System
The DCPTDFs have been used to determine ATC for different transactions. A transaction from bus/zone m to bus/zone n creates a change Pij in the flow on a line from bus/zone i to bus/zone j. The new flow on the line is the sum of the
original flow Pij0 and the change in the flow. It must be less than the line flow limit,Pijmax. Thus, the new line flow:
Pijnew = (Pij°+ ∆Pij) ≤ Pijmax (1)
The maximum increase in the flow of the line between buses i and j for transaction between buses m and n, ∆Pijmaxcan
be written as:
∆Pijmax = DCPTDFij,mn ∗ Pij,mnmax(2)
From eq. (1) and (2)
Pij−mnmax ≤ Pij max − P
ij0
DCPTDFij ,mn
where,Pij ,mnmax is the maximum allowable transaction amount from bus/zone m to bus/zone n constrained by the line flow
limit from bus/zone i to bus/zone j. For the given transaction, the ATC can be defined as:
ATCmn = min{Pij ,mnmax ij ϵNl}
Where, Nlis thetotal number of lines in the system.
D.ATC Determination under Line Contingency
According to ATC principles, adequate amount of uncertainties should be accommodated in ATC calculations.Line outage as contingency cases should be taken into account for ATC calculations as it is constrained by the effect of contingencies. DCLODFs and DCPTDFs can be combined together to compute first contingency incremental transfer capability. This is the maximum increase in the transaction amount from a bus/zone to another bus/zone under (n-1) contingency condition. Consider a transaction from zone m to zone n and the outage of the line from bus/zone r to bus/zone s (line rs). The change in the flow on the line rs due to the given transaction is:
ISSN (Print) : 2320 – 3765 ISSN (Online) : 2278 – 8875
I
nternational
J
ournal of
A
dvanced
R
esearch in
E
lectrical,
E
lectronics and
I
nstrumentation
E
ngineering
(An ISO 3297: 2007 Certified Organization)
Vol. 5, Issue 1, January 2016
When the outage of line rs is considered, the part of the flow appears on line ij. Thus, the change in flow in the line ij resulting from outage of the line rs along with a new transaction from bus/zone m to bus/zone n is given by:
∆Pij ,rsnew = (DCPTDF
ij ,mn + DCLODFij,rs∗ DCPTDFrs ,mn) ∗ Pmnnew
The ATC from bus/zone m to bus/zone n, with outage of line rs is given as:
ATCmn ,rs = min{
Pijmn − Pij0
DCPTDFij,mn + DCLODFij,rs∗ DCPTDFrs ,mn
ij ϵ Nl }
All possible combinations of outage lines and limiting lines should be checked. Then, ATC can be evaluated as:
ATCmn ,rs = min(min Pmn ,ijmax , minij ,rsPmn ,ij,rsmax )
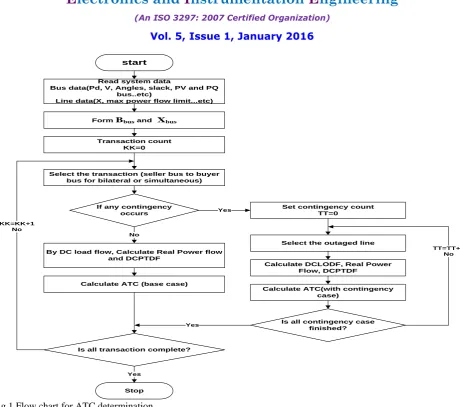
The steps explained in previous section for calculating ATC, these can be summarized in the flow chart shown in Fig.1. Whenever a transaction occurs between two buses, the real power flows of the lines changes. This is due to the change in angle. This change in line flows is given by:
[∆Pij] = DCPTDFt* Pt
Now the total line flows will be the sum of base case real power flow and the change in line flows. Mathematically it can be written as:
Ptot = Pij+ ∆Pij
is a column matrix which indicates the amount of power transferred between seller bus and buyer bus. The seller bus acts the source and the buyer bus acts as the sink for the power or the positive injection and negative injection, respectively. The entries in this matrix is +1 for seller bus and -1 for the buyer bus, all other elements will be zero for single transactions. The maximum allowable capability of the transaction using DCPTDF is given as
Pij−mnmax = [Pijmax − Pij ] DCPTDFij,mn
Where,
Pijmax Maximum transfer limit of the line between bus i and j.
Now the ATC can be expressed mathematically as:
ATCmn = min{Pij,mn max ij ε nl}
Where,
ISSN (Print) : 2320 – 3765 ISSN (Online) : 2278 – 8875
I
nternational
J
ournal of
A
dvanced
R
esearch in
E
lectrical,
E
lectronics and
I
nstrumentation
E
ngineering
(An ISO 3297: 2007 Certified Organization)
Vol. 5, Issue 1, January 2016
Fig.1 Flow chart for ATC determination
Using the steps for ATC calculation described in the previous section, ATC can be determined for all transactions in the case of intact system and contingency cases.
III. RESULTS AND DISCUSSIONS
The results have been determined for IEEE RTS 24 bus system. The results include PTDF calculations for intact system and contingency cases in all transactions. Based on the PTDFs ATC have been calculated for all transaction cases.
The transactions chosen are:
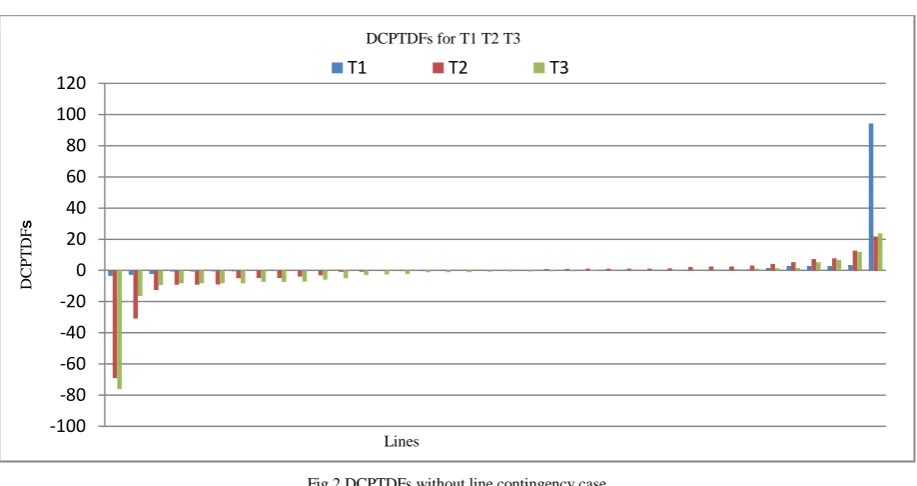
T1: transaction between seller bus1 to buyer bus 2. T2: transaction between seller bus5 to buyer bus 10 T3: transaction between seller bus11 to buyer bus 14
DCPTDFs of different Transactions T1, T2, and T3 are shown in graphical form in the Fig. 2. It is observed from the figure that PTDF for different transactions cases are different and are calculated for the ATC determination. These DCPTDFs are shown without contingency case.
start
Read system data
Bus data(Pd, V, Angles, slack, PV and PQ bus..etc)
Line data(X, max power flow limit...etc)
Form Bbus and Xbus
If any contingency occurs
Calculate ATC(with contingency case)
Transaction count KK=0
Select the transaction (seller bus to buyer bus for bilateral or simultaneous)
By DC load flow, Calculate Real Power flow and DCPTDF
Calculate ATC (base case)
Is all transaction complete?
Stop
Yes No
Set contingency count TT=0
Yes
Select the outaged line
Calculate DCLODF, Real Power Flow, DCPTDF
Is all contingency case finished?
Yes
TT=TT+1 No KK=KK+1
ISSN (Print) : 2320 – 3765 ISSN (Online) : 2278 – 8875
I
nternational
J
ournal of
A
dvanced
R
esearch in
E
lectrical,
E
lectronics and
I
nstrumentation
E
ngineering
(An ISO 3297: 2007 Certified Organization)
Vol. 5, Issue 1, January 2016
Fig 2 DCPTDFs without line contingency case
DCPTDF show what percent of a transfer would appear on each transmission line when a particular transactions happen in a system. In the results negative sign indicates that power can flow occurs in the reverse direction.
Now with DCPTDFs available for all transaction cases, ATCs are calculated for different transactions T1, T2, T3. ATCs obtained for intact case are shown in the Fig. 3. DC method is fast for calculating ATC. Base case line flows and DCPTDFs are used for evaluating ATC.
Fig.3ATC with different transactions
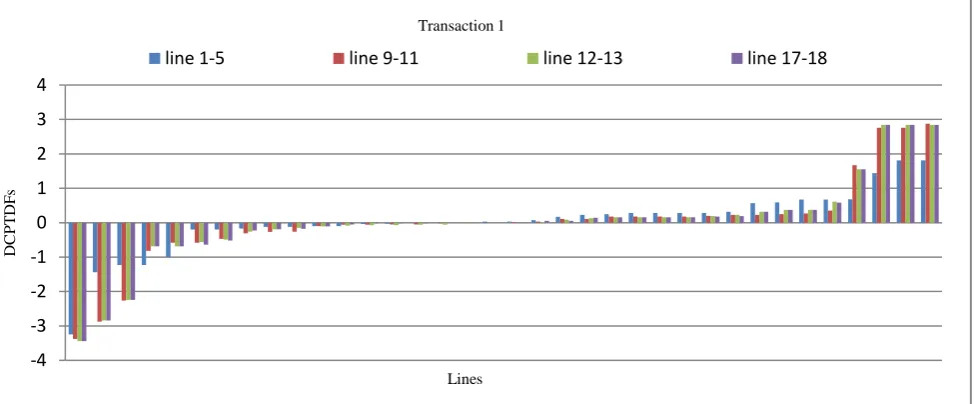
ATCs for the contingency cases are determined for eachtransaction case under line outages. DCPTDFs under lineoutages and LODFs are calculated for ATC determination.DCPTDF are shown in Figs. 4-6 for the transactions T1, T2and T3 with different outage lines. LODFs are the measure ofredistribution of the power flows in the lines due to the outageof any line in a system. It is observed from the DCPTDFs with line outages and without line outages, that there is
-100 -80 -60 -40 -20 0 20 40 60 80 100 120
D
C
P
T
D
F
s
Lines
DCPTDFs for T1 T2 T3
T1 T2 T3
0 1 2 3 4 5 6 7 8 9
A
T
C
(p
.u
)
Transactions
T1
T2
ISSN (Print) : 2320 – 3765 ISSN (Online) : 2278 – 8875
I
nternational
J
ournal of
A
dvanced
R
esearch in
E
lectrical,
E
lectronics and
I
nstrumentation
E
ngineering
(An ISO 3297: 2007 Certified Organization)
Vol. 5, Issue 1, January 2016
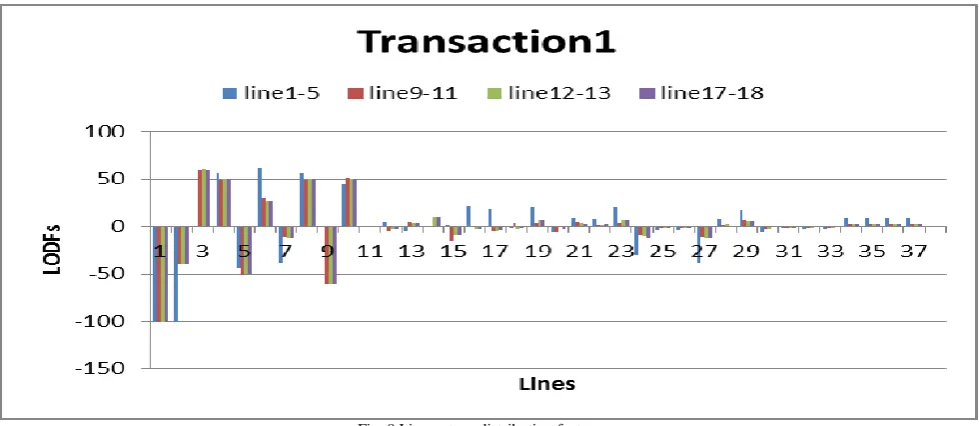
change inthe patterns of PTDFs for each line outage case for all thetransactions. DCLODFs obtained with DC load flow approachare shown in Fig. 8. ATC for line outage cases are given inTable I and are shown in Fig.7.
TABLE 1
ATC FOR LINE OUTAGES FOR DIFFERENT TRANSACTIONS
The table shows the ATC with line outages for different transactions. The ATC value is taken to be minimum value for all transactions. This value shows the unutilized value available for further transactions over already committed units.It is observed from the table that ATC decreases for line outages for all transaction cases.
Fig.4 DCPTDFs for transaction T1 -4
-3 -2 -1 0 1 2 3 4
D
C
P
T
D
F
s
Lines Transaction 1
line 1-5 line 9-11 line 12-13 line 17-18 Outage Line ATC(p.u)
T1 T2 T3
1-5 61.46 245.99 548.12
9-11 109.03 262.86 -1006.77
12-13 120.73 238.66 631.29
ISSN (Print) : 2320 – 3765 ISSN (Online) : 2278 – 8875
I
nternational
J
ournal of
A
dvanced
R
esearch in
E
lectrical,
E
lectronics and
I
nstrumentation
E
ngineering
(An ISO 3297: 2007 Certified Organization)
Vol. 5, Issue 1, January 2016
This figuredepicts the DCPTDFs for transaction 1 i.e from seller bus 1 to buyer bus 2 with different line outages. The graphs show the distribution of power over the transmissions lines when there is outage of different transmission lines.
Fig.5. DCPTDFs for transaction T2
This figure depicts the DCPTDFs for transaction 2 i.e from seller bus 5 to buyer bus 10 with different line outages. The graphs show the distribution of power over the transmissions lines when there is outage of different transmission lines. The negative distributed power over transmission lines show that power can flow in reverse direction also i.e reactive power flow over transmission lines.
Fig.6 DCPTDFs for transaction T3
This figure depicts the DCPTDFs for transaction 3 i.e from seller bus 11 to buyer bus 14 with different line outages. The graphs show the distribution of power over the transmissions lines when there is outage of different transmission
-120 -100 -80 -60 -40 -20 0 20
D
C
P
T
D
F
s
Lines Transaction 2
line1-5 line9-11 line12-13 line17-18
-100 -80 -60 -40 -20 0 20 40
D
C
P
T
D
F
s
Lines
Transaction 3
ISSN (Print) : 2320 – 3765 ISSN (Online) : 2278 – 8875
I
nternational
J
ournal of
A
dvanced
R
esearch in
E
lectrical,
E
lectronics and
I
nstrumentation
E
ngineering
(An ISO 3297: 2007 Certified Organization)
Vol. 5, Issue 1, January 2016
lines. The negative distributed power over transmission lines show that power can flow in reverse direction also i.e reactive power flow over transmission lines.
Fig.7 ATC for contingency cases for different transactions
This graph shows the ATC for different transactions with line contingency case which provides us the information about how much power can be available over transmission lines if there is outage of different lines. The maximum ATC is available for T3 during the outage of line 9-11.
.
Fig. 8 Line outage distribution factors
The graph shows the line outage distribution factors for transaction 1 with different line outages. This provides us information regarding the distribution of power over transmission lines when some lines are being outage.
0 200 400 600 800 1000
line1-5 line9-11 line12-13 line17-18
A
T
C
s
outage lines Line Contingency Case
ISSN (Print) : 2320 – 3765 ISSN (Online) : 2278 – 8875
I
nternational
J
ournal of
A
dvanced
R
esearch in
E
lectrical,
E
lectronics and
I
nstrumentation
E
ngineering
(An ISO 3297: 2007 Certified Organization)
Vol. 5, Issue 1, January 2016
IV.CONCLUSION
In this paper, methodology for ATC determination has been suggested for bilateral transactions based on DC load flow approach. Results are shown in tabular and bar charts form. DCLODFs are used to determine ATCs in contingency case. Calculation of ATC by DC load flow is easy and it is less time consuming because this method is non iterativemethod. In line contingency cases, ATC is found to decrease for all transactions as compared to ATC without line contingency case.
REFERENCES
[1] IEEE Reliability Test System,” A report prepared by the Reliability Test System Task Force of the Applications of Probability Methods Subcommittee”, IEEE Trans. On Power Apparatus and Systems, vol. PAS-98, pp. 2047-2054, Nov.-Dec. 1979.
[2] V. Ajjarappu and C. Christy, “The Continuation Power Flow: A Tool for Steady State Voltage Stability Analysis”, IEEE Trans. on
PowerSystems, vol. 7, no. 1, Feb. 1992, pp. 416-423.
[3] American Electric Reliability Council (NERC), „Available Transfer Capability Definitions and Determination‟, NERC Report, June 1996. [4] G. Hamoud, “Assessment of Available Transfer Capability of Transmission Systems”, IEEE Trans. on Power Systems, vol. 15, no. 1, Feb. 2000, pp. 27-32.
[5] R. Christie, B.F. Wollenberg, and I. Wangesteen, “Transmission management in deregulated environment,” IEEE Proc., vol. 88, pp. 170-195, Feb. 2000.
[6] Ashwani Kumar, S. C.Srivastava, “AC Power Transfer Distribution Factors for Allocating Power Transactions in a Deregulated Market”, IEEE Power Engineering Review, July 2002.
[7] Santiago Grijalva, Peter W. Sauer and James D. Weber,” Enhancement of linear ATC calculations by the incorporation of reactive power flows”, IEEE Transactions on Power Systems 2003, pp. 619-624.
[8] A. Kumar, S. C. Srivastava, and S. N. Singh, “Available Transfer Capability Assessment in a Competitive Electricity Market Using a Bifurcation Approach”, IEE Proc. On Generation, Transmission and Distribution, vol. 151, no. 2, March 2004, pp. 133 – 140.
[9] M. Patel and A. A. Girgis, “Review of available transfer capability(ATC) calculation methods”, Power Systems Conference, 2009, pp. 1-9. [10] Jitendra Kumar and Ashwani Kumar, “Multi-transactions ATC Determination using PTDF based approach in Deregulated Markets”, International Journal of Electrical and Computer Engineering (IJECE), Vol.1, No.1, September 2011, pp. 71~84, ISSN: 2088-8708.
[11]Naresh K. Yadav1, Prashant Sharma,” Available Transfer Capability Calculation Using DCPTDF Incorporating Multiple Line Contingencies And Generator Addition Under Deregulated Environment”International Journal of Advanced Research in Electrical, Electronics and Instrumentation EngineeringVol. 2, Issue 6, June 2013.