R E S E A R C H
Open Access
System value-based optimum spreading
sequence selection for high-speed downlink
packet access (HSDPA) MIMO
Mustafa K Gurcan
*, Irina Ma, Anusorn Chungtragarn and Hamdi Joudeh
Abstract
This article proposes the use of system value-based optimization with a symbol-level minimum mean square error equalizer and a successive interference cancellation which achieves a system value upper bound (UB) close to the Gaussian UB for the high-speed downlink packet access system without affecting any significant computational cost. It is shown that by removing multi-code channels with low gains, the available energy is more efficiently used, and a higher system throughput is observed close to the system value UB. The performance of this developed method will be comparable to the orthogonal frequency division multiplexing-based long-term evolution scheme, without the need to build any additional infrastructure. Hence, reduce the cost of the system to both operators and consumers without sacrificing quality.
Keywords: HSDPA MIMO, Successive interference cancellation, Minimum mean square error equalization, Resource allocation
1 Introduction
Wireless communication systems known as multiple-input multiple-output (MIMO) systems, which have mul-tiple transmit and receive antennas, can be used to exploit the diversity and the multiplexing gains of wireless chan-nels to increase their spectral efficiency. As an extension to Shannon’s capacity [1], the MIMO channel capac-ity bound was obtained by Foschini and Gans [2] and Telatar [3] independently. Assuming that perfect chan-nel state information (CSI) is available at the transmitter, the MIMO system capacity upper bound (UB) can be obtained using the eigen modes of the MIMO channel matrix by performing water-filling (WF) over the spatial sub-channels. An important MIMO system design con-sideration is to operate the system close to its capacity UB. The objective of this article is to show how the high-speed downlink packet access (HSDPA) MIMO system can operate close to its capacity UB.
The third generation partnership project (3GPP) has developed the HSDPA system, given in the Release 5
*Correspondence: [email protected]
Intelligent Systems and Networks Group, Department of Electrical and Electronic Engineering, Imperial College London, London SW7 2AZ, UK
specification [4] of the Universal Mobile Telecommuni-cations System, as a multi-code wide-band code division multiple access (CDMA) system. To further increase the data rate, the HSDPA system introduced new features [5] such as adaptive modulation and coding and fast schedul-ing. The standardization of the Dual Stream Transmit Diversity (D-TxAA) HSDPA MIMO system for a single-user in 3GPP Release 7 [6] further improved the downlink throughput without requiring a new spectrum or any additional bandwidth.
In [7], measurements are carried out to evaluate the per-formance of the standardized 3G HSDPA MIMO system with a CDMA transmission. It is shown that the current systems are utilizing only about 40% of the available down-link capacity. The capacity curve is approximately 10 dB away from the capacity UB [8] at high signal to noise ratios. There is an opportunity to improve the HSDPA system capacity, when operating over frequency selective channels, by enhancing the HSDPA MIMO standard of the equal energy allocation scheme as is specified in [6].
The frequency selectivity problem, which causes a large drop in throughput for the HSDPA due the inter-symbol interference (ISI) problem, is not a major problem for
the orthogonal frequency division multiplexing (OFDM)-based systems [long-term evolution (LTE) advanced and WiMAX] as they use a guard period to deal with the ISI problem. If the throughput reduction problem is not solved in the HSDPA system, the OFDM-based systems will have the upper hand over the HSDPA system in urban environments. The HSDPA input single-output (SISO) system has been the main focus of the study in [9], which provides tools to combat frequency selec-tivity, when bringing the HSDPA SISO performance close to the OFDM-based systems. Should the ISI problem be solved for the HSDPA MIMO-based systems, the current HSDPA MIMO system would achieve throughputs close to the LTE advanced without the need to change the whole infrastructure by using throughput optimization methods. This is the focus of the current investigation.
2 Current investigation and related work
The downlink throughput optimization for the HSDPA multi-code CDMA system [10] considers the signature sequence and the power allocation for downlink users. 3GPP standardized an approach to spread the transmis-sion symbols by using a given fixed set size of orthogonal variable spreading factor (OVSF) signature sequences. A MIMO system requires a signature sequence set size higher than the given single set of OVSF signature sequences available for a SISO system. 3GPP standardized a method to increase the OVSF set size by multiply-ing the given set with precodmultiply-ing weights and then con-catenating the weighted sets of the spreading sequences. Each concatenated spreading sequence is used to trans-mit one symbol and is orthogonal to the remaining set of spreading sequences available at the transmitter for the transmission of other symbols. However, the spreading sequences’ orthogonality is lost at the receiving end after transmission over frequency selective multipath channels. In [11,12], it is proposed that a linear minimum mean square error (MMSE) equalizer followed by a de-spreader could be used to restore partial orthogonality between the receiver de-spreading and the matched filter sequences in the detection process after receiving signals trans-mitted over a multipath channel. Recent developments have shown that linear MMSE equalizers suffer from a self-interference (SI) problem caused by ISI and multi-ple access interference, when operating over multipath channels.
SI reduces the system throughput performance, but good receiver design will minimize the degradation caused by the SI. When encountering SI various ver-sions of interference cancellers could be used in conjunc-tion with non-optimal receivers to improve the system throughput for the HSDPA system over frequency selec-tive parallel channels. In [13], it is shown that a successive interference cancellation (SIC) scheme performs better
than a parallel interference cancellation scheme, when the signal-to-noise ratio (SNR) differs over each frequency selective parallel channel. The works reported in [14-16] focus on the use of linear MMSE equalizers and SIC in reduction of the overall SI.
A two-stage SIC detection scheme with transmitter power optimization is examined in [16,17] to improve the throughput performance for multi-code downlink trans-mission. In [18], the power at the transmitter and a two-stage SIC receiver are jointly and iteratively optimized for a multi-code MIMO system. However, at each iteration of the SIC, the equalizer coefficient and the power allocation calculations require an inversion of a covariance matrix for the received signal. The dimension of the covari-ance matrix is usually large and, as such, the iterative power allocation, the linear MMSE equalizer and the SIC implementations at the receiver become computationally expensive.
The focus of the article is on an HSDPA MIMO-based radio downlink system, which has a number of paral-lel SISO or MIMO frequency selective channels over which data are transmitted. The data are represented by a number of data symbols, which are spread by a group of spreading sequences when using the HSDPA system either with or without a SIC scheme. A set of signature sequences generated from the OVSF codes with precod-ing, as specified in the 3GPP Release 7, will be considered. A receiver with a symbol-level linear MMSE equalizer will be examined to jointly optimize the transmission energy allocation and the receiver for a single user system either with or without a SIC.
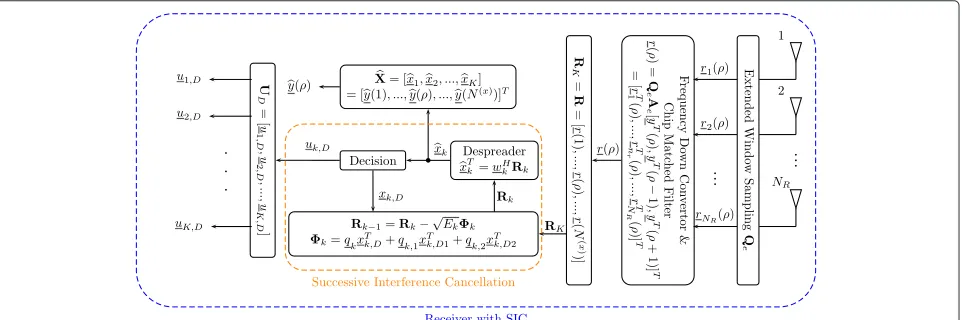
At the receiver each spreading sequence sk has a sys-tem valueλk, which is associated with the SNRγk at the output of each de-spreading unit. The system value λk for each spreading sequence depends on the transmission multipath channel and also on the availability of the SIC scheme. The implementation of each HSDPA MIMO sys-tem can be a non-SIC scheme as shown in Figure 1 or a SIC-based receiver scheme as shown in Figure 2. The non-SIC and the SIC-based receivers have different ways of determining the system values for a given number of spreading sequences, a given frequency selective multi-path channel and a total transmission energy. This article will outline MIMO transceiver structures for the non-SIC and SIC-based receivers to introduce the system value concept. The system value UB for the HSDPA MIMO sys-tem will be presented. This syssys-tem value capacity UB is close to the capacity of an additive white Gaussian noise channel. It will also be shown how the system values will be used to determine the total transmission rates for both the non-SIC and the SIC-based SISO and MIMO systems to maximize the total transmission rate.
Figure 1System block diagram for the non-SIC based MIMO HSDPA system.
be to bring the downlink throughput close to the system value UB. This will be achieved by retaining the spread-ing sequences with the highest system values for a given total received SNR corresponding to a given total trans-mission energy ET. A given number of sequences will be ordered so that the corresponding system values are used at the transmitter in ascending order. The optimum number K∗ of signature sequences will be determined to select the firstK∗-ordered signature sequences, which maximize the transmission throughput. The receivers will
operate in a sequence, where the detection is ordered in the descending order of the corresponding system values for the SIC-based systems.
As shown in [19], the WF optimization is generally used for parallel channels with different sub-channel gains to provide optimum sub-channel selection, energy dis-tribution, and also channel ordering. The iterative WF sum-capacity optimization is extensively examined in [20-23] and is proven to converge to the sum capacity UB of the multiple-access channel [20] to provide an UB for
non-discrete rates. Other sub-channel removal methods have been studied in [24-26] to determine the number of active data streams. In [24], the eigen decomposition of the covariance matrix is used to isolate the “bad” data streams so that the sum MSE is minimized. In [25], it is suggested that low signal-to-interference and noise ratio (SINR) streams will be switched off to focus the avail-able power on the remaining streams during the iterative power allocation process. In [26], the removal of sub-channels is proposed to improve the capacity when the rounding of the discrete rate does not improve the system throughput. The WF and channel removal schemes do not use the system value concept for signature sequence selection nor use rate adjustment to maximize the total throughput.
In this article, three bit rate adjustment methods will be considered with the appropriate energy allocation schemes. These methods will be applicable to both SIC and non-SIC-based receivers, when using discrete and non-discrete rates. Initially, an iterative WF algorithm will be proposed with a sub-channel removal for the selection of signature sequences. The system values will be used to maximize the throughput for non-discrete rate alloca-tion by accounting for the channel SINRs corresponding to the received signature sequences instead of using only the channel gains to find the water levels. When using dis-crete rates the signature sequence selection scheme will be further extended to optimize the total rate for the HSDPA system downlink. The system values will be used to select an optimum number of spreading signature sequences from a given total number of sequences without any prior energy allocation. The chosen optimum number of sequences will be loaded with discrete rates using both the equal SINR allocation methods proposed in this arti-cle and the equal energy allocation schemes as specified in the current HSDPA standard. The equal SINR and energy loading schemes will use the mean and the minimum of system values for a given total energy to transmit the sym-bols at the required discrete rates. These three methods will be named as the iterative WF-based continuous bit loading method, the mean system value-based discrete bit loading method, and the minimum system value-based discrete bit loading method.
The mean and minimum system value-based methods will require different and equal transmission energy allo-cations, respectively. The iterative energy allocation meth-ods will be described for the mean system value-based discrete bit loading systems.
The link throughput improvements for these three methods will be described, when considering the receiver design, power control, and signature sequence selection algorithms. A complexity reduction method will be pre-sented for covariance matrix inversions. The results show that the HSDPA MIMO system, using the optimization
methods proposed in this article, achieve a system throughput close to the system value capacity UB for the frequency selective channels. The results are then compa-rable with the LTE system, without incurring the cost of building new infrastructures.
In Section 3, two HSDPA MIMO system models will be described for receivers with the non-SIC and the SIC-based MMSE de-spreading units. In Section 4, the system value formulation will be presented and the MMSE fil-ter coefficient calculations will be given. The system value UB concept for both the non-SIC and the SIC-based receivers will be presented in Section 5. The formulation of a simplified iterative covariance matrix for use in the design of the SIC-based receivers with MMSE equalizers will be described in Appendix 2 to support the mate-rial presented in Section 5. The system value-based sum capacity/throughput maximization methods for optimum signature sequence selection, energy allocation, and rate maximization methods will be described in Section 6. These schemes will be based on the iterative WF and the mean and the minimum system value optimization meth-ods. Finally, the results will be described in Section 7 before the conclusions are given in Section 8.
3 System model
3.1 Notation
ais a scalar,ais a column vector, andAis a matrix. The identity matrix with dimensionLis given asIL.
will be used to obtain a realizable discrete rate of bp = rcode ×log2Mbits per symbol where p = 1,. . .,P are
the different discrete bit indices available. The bit rate for each spreading sequence is represented by bpk fork = 1,. . .,K∗.
A non-SIC-based system model is shown in Figure 1. In the CDMA system, the number of symbols transmit-ted per packet is given by N(x) = NTTTI
c where Tc is the chip period and NTc is the symbol period. In each parallel channel, the mapped packet of symbols corre-sponding to dk over 1 TTI is represented by an N(x) long vector xk for k = 1,. . .,K∗, where each symbol inxk carries unity average energy. The symbols overK∗ parallel channels are stored in an N(x)× K dimensional matrixX =[x1,. . .,xK] which is also expressed asX = [y(1),. . .,y(ρ),. . .,y(N(x))]T where the lengthK∗vector y(ρ) =[x1(ρ),. . .,xK∗(ρ)]T contains symbols over the symbol periods ofρ=1,. . .,N(x).
Each spreading sequence will have an energy allocated, where the assigned energies are stored in aK∗×K∗ dimen-sional amplitude matrixA=diag√E1,
√ E2,. . .,
√ EK∗
. The energy weighted symbols will then be spread by sig-nature sequences (spreading codes) and are represented by an(NTN)×K∗signature sequence matrix
S=ST
1,. . .,STnt,. . .,S T NT
T
=[s1,. . .,sK∗] (1)
where|sk|2=1 andSnt =[s1,nt,s2,nt,. . .,sK∗,nt] is aN×K
∗
spreading sequence matrix of thentth antenna. The length Ntransmit signal vector at antennantis given byznt(ρ)= SntAy(ρ)for the symbol periodρ. The vectorznt(ρ)will then be fed to a pulse shaping filter at integer multiples of Tcbefore up converting to the desired carrier frequency. The lengthN×NT MIMO transmit signal vector is given
byz(ρ)=zT1(ρ),. . .,zTnt(ρ),. . .,zTN T(ρ)
T .
Assuming the clocks at the transmitter and the receiver are fully synchronized, the signals arriving at the receive antennas will be firstly down converted to the baseband before sampling at everyTcat the output of the receiver chip match filter.
The receiver matched filtered signal vectorr(ρ)for each symbol period will be represented by anNR(N+L−1) long vector r(ρ) =[rT1(ρ),. . .,rTnr(ρ),. . .,rTN
R(ρ)] T,
where L is the number of resolvable paths in a mul-tipath wireless channel. The samples at the output of the chip match filter of the nrth antenna are repre-sented by an (N + L − 1)-length vector rnr(ρ) = [rnr,1(ρ),. . .,rnr,(N+L−1)(ρ)]. The NR(N + L − 1) × N(x)-dimensional matched filter matrix R is formed by taking r(ρ) as its ρth-column such that R = [r(1),. . .,r(ρ),. . .,r(N(x))]. Withr(ρ)and theNR(N + L−1)×K∗-dimensional MMSE linear de-spreading filter
matrixW=w1,. . .,wK∗containing de-spreading filter
coefficientswk each of which is calculated using (10) for k = 1,. . .,K∗. The estimatey(ρ) of the transmitted symboly(ρ)can be found as follows:
y(ρ)=yˆ1(ρ),. . .,yKˆ ∗(ρ)
=xˆ1(ρ),. . .,xKˆ ∗(ρ) T
=WHr(ρ).
(2)
The vectory(ρ)is used to form theN(x)×K-dimensional de-spread signal matrixXˆ =[x1,. . .,xK∗] or alternatively
ˆ
X=[y(1),. . .,y(ρ),. . .,y(N(x))]T by usingxTk = wHkRto de-spread the received signal vector of thekth channel. The de-spread signals pass through the decision device, where the signals are quantized, de-mapped and decoded to form binary data vectorsuk,Dfork=1,. . .,K.
At the output of each receiver, the mean square error (MSE) between the transmitted symbolyk(ρ)and the esti-mated symbolyˆk(ρ)is given asεk=E yˆk(ρ)−yk(ρ)2
. When the MSE is minimized, it has a relationship with the SINRγkand the system valueλkasεk = 1+1γk = 1−λk. Therefore, the system value is given by
λk=1−εk = γk 1+γk
. (3)
3.3 The SIC-based receiver model
Figure 2 illustrates the system model for a SIC-based receiver, which collects the received signals r1(ρ) to rNR(ρ)to formulate the received signal vectorr(ρ). The receiver processes and cancels the signals channel by channel to ensure that the SI is minimized. Starting from channel K∗ and by setting the received signal matrix
RK∗=R=
r(1),. . .,r(N(x)), theN
R(N+L−1)×N(x) -dimensional reduced data matrixRk−1will iteratively be
calculated usingRk−1=Rk−√Ekkfromk=K∗tok= 1 where√Ek is the allocated energy of thekth channel. The matrixkof dimensionNR(N+L−1)×N(x)will be constructed ask=qkxTk,D+qk,1xTk,D1+qk,2xTk,D2, where the lengthN(x) vectorsxk,D,xk,D1 = JN(x) xk,Dandxk,D2 = JT
N(x)xk,D are the detected stream of the current sym-bol period, the detected streams with ISI symsym-bols received in the previous and the next symbol periods, respectively. TheNR(N+L−1)-dimensional receiver matched filter sequencesq
k,qk,1andqk,2are given in (8), (31), and (32)
which is required to generateRk−1for the next channel.
This process of cancelling the detected symbols continues fromk=K∗tok=1. The next section will introduce the system value and the de-spreading filter coefficient calcu-lations for both the SIC and the non-SIC-based systems.
4 System value and MMSE de-spreading filter coefficient formulations
In this section, the system values and the correspond-ing MMSE de-spreadcorrespond-ing filter coefficients are expressed in terms of the received signal vectorr(ρ).
4.1 System values for a non-SIC-based receiver
The received signal vectorr(ρ)over the symbol periodρ is given in terms of the transmitted signal vectorz(ρ)as
r(ρ) = [rT1(ρ),. . .,rnTr(ρ),. . .,rTNR(ρ)]T (4)
= Hz(ρ)+H1z(ρ−1)+H2z(ρ+1)+n(ρ)
and the received signal matrix is given by R=
r(1),. . .,r(N(x)). TheNR(N+L−1)-dimensional vec-tor n(ρ) contains the concatenated noise samples at the output of the receiver chip matched filters. The NR(N+L−1)×NTN matrixHrepresents the overall MIMO channel convolution matrix formed as follows:
H=
⎡ ⎢ ⎣
H(1,1) . . . H(1,NT) ..
. . .. ... H(NR,1) · · · H(NR,NT)
⎤ ⎥
⎦. (5)
The channel convolution matrix between the pair of antennasH(nr,nt)is determined by their channel impulse
responseh(nr,nt) = h(nr,nt)
0 ,. . .,h (nr,nt) L−1
T
of dimension L×1. It is assumed that the signals from eachntth transmit antenna to eachnrth receive antenna undergo the same channel condition for the packet duration withL resolv-able paths, and the channel conditions obtained from the feedback of pilot signals. The corresponding channel con-volution matrix between the pair of antennas is formed as
H(nr,nt)=
⎡ ⎢ ⎢ ⎢ ⎢ ⎣
h(nr,nt) 0 · · · 0
0 h(nr,nt) · · · ... ..
. · · · . .. 0
0 0 · · · h(nr,nt)
⎤ ⎥ ⎥ ⎥ ⎥ ⎦.
The spatiotemporal MIMO channel matrix for the previ-ous symbol block and the next symbol block are given as
H1=
INr⊗ J
TN
H (6)
H2= INr⊗J
NH (7)
whereJis a vector shifting matrix. The notationJN+L−1
is the shift matrix of dimension(N+L−1)×(N+L−
1)defined asJN+L−1=
0T(N+L−1)−1 0 I(N+L−1)−1 0(N+L−1)−1
. When
multiplied with a matrix,(JTN+L−1)Nshifts the columns of the matrix up byNchips and fills the empty contents with zeros, whileJN
N+L−1shifts the columns of the matrix down
byNchips and fills the empty contents with zeros. TheNR(N+L−1)×K∗-dimensional receiver matched filter signature sequence matrixQis calculated as follows:
Q=HS=[q
1,. . .,qK∗] . (8)
The system value for the spread spectrum system based on a receiver without the SIC scheme is given by
λk=Ek qHkC−1qk (9)
where C = Er(ρ)rH(ρ) is an N
R(N+L−1) × NR(N+L−1)-dimensional covariance matrix of the received signal vectorr(ρ). In (9), the covariance matrix C is calculated using (30) in terms of Q and the noise covariance matrixEn(ρ)nH(ρ)as shown in Appendix 1. The normalized MMSE de-spreading coefficientswkfor k = 1,. . .,K∗ when the MSE per channel is minimized can be formed in terms ofC, as shown below:
wk= C
−1q k qH
kC−1qk
. (10)
These coefficients are then stored in a matrix W=w1,. . .,wk,. . .,wK∗of dimensionNR(N+L−1)× K∗.
4.2 System values and MMSE de-spreading filter coefficients for a SIC-based receiver
Similar to the received signal vector r(ρ)which is con-structed in (4), a SIC-based received signal vector is formed to improve the SINR at the output of each receiver. For the SIC scheme, the system valueλkfork=1,. . .,K∗ is determined using the following equation:
λk=EkqHkC−k1qk (11)
whereq
k is thekth column of (8). The covariance matrix Ck is initialized asC0 = 2σ2INR(N+L−1) and then itera-tively constructed fork = 1,. . .,K∗using the following relationship:
Ck =Dk+EkqkqHk (12)
where
Dk=Ck−1+Ekqk,1qHk,1+Ekqk,2qHk,2. (13)
After all iterationsk=1,. . .,K∗have been completed the covariance matrix given in (30) is set to beC=CK∗.
one matrix inversionC−k1, which requires high computa-tional complexity. By applying the matrix inversion lemma (A+UBV)−1 = A−1−A−1UB−1+VA−1UVA−1on Dk in (13) andCk in (12), an iterative covariance matrix inversion method is formed by constructing the inverse matricesC−k1 andD−k1using (33) and (34), respectively, as a function ofC−k−11as shown in Appendix 2 so that the total number of matrix inversions required to obtainλk fork=1,. . .,K∗reduces to 1.
The inverse matricesC−k1 and the corresponding sys-tem values,λk, are calculated iteratively so that the system valueλkgiven in (11) is reorganized using (34) to simplify the SINRγk at the output of thekth SIC receiver to the following form
γk= λk 1−λk =
EkqHkD−k1qk (14)
using the steps in (35) to (38) given in Appendix 2. There-fore, γk can be calculated when D−k1 is obtained using (33).
The MMSE linear equalizer de-spreading filter coeffi-cientswk for thekth SIC receiver in (10) is expressed in terms ofCkas
wk = C
−1 k qk qH
kC
−1 k qk
(15)
fork=1,. . .,K∗.
5 Sum capacity optimization using system values The main focus of this article is to find the optimum num-berK∗of spreading sequences, which maximizes the total rate, whereK∗is a subset of the total numberKof spread-ing sequences used for transmission. The total ratebT =
K∗
k=1bpk is maximized by minimizing the total MSEεT
= K∗
k=1εk, where bpk is the number of bits allocated to each spreading sequence symbol for k = 1,. . .,K∗. The total MSE minimization criterion has been studied in [24,27,28] and can be expressed in terms of the Lagrangian dual objective function:
L(εk,Ek,λ)= K∗
k=1
εk+λ
⎛
⎝K
∗
k=1 Ek−ET
⎞
⎠ (16)
where λis the Lagrangian multiplier. The minimization of the total MSE using the above equation provides solu-tions forEkand the Lagrangian multiplierλ, subject to the energy constraintKk=∗1Ek ≤ET. Sincebpkis expressed as a function ofεkandEk,bT =
K∗
k=1bpkwill be determined only after energy allocation, which could be computa-tionally expensive, when an iterative energy calculation is required. Therefore, this article uses the system value
optimization originally presented in [9], where the system valueλkof thekth channel is calculated using (9) and (11) for the non-SIC and the SIC-based receivers, respectively. Differing from [9], in this article a method is proposed to calculate the discrete rate for each spreading sequence using the mean system valueλmeanprior to allocating the
energy for each sequence.
The mean system valueλmeanis calculated by allocating
energies equally such thatEk = EKT∗ and then obtaining the
system valueλk from (9) for the non-SIC receiver or (11) for the SIC receiver, using the following equation
λmean= λT K∗ =
K∗
k=1λk
K∗ . (17)
The total system capacities for the MMSE receivers for both the SIC and the non-SIC-based receivers are then given as
CT = K∗
k=1
log2
1+ λk (1−λk)
(18)
whereis the gap value. To relate the system values to dis-crete bit rate optimization, one can use the disdis-crete bit rate and its SINR relationshipbpk =log2 1+
γk
. Thus, the target SINR can be expressed as a function of the discrete ratebpk as follows:
γ∗
k
bpk
= 2bpk −1, (19)
and the corresponding target system valueλ∗kexpressed as a function ofbpkcan be obtained using
λ∗k
bpk
= 2
bpk −1
1+ 2bpk−1
. (20)
The next section will provide a detailed description of the system value based throughput optimization methods for both the non-SIC and the SIC-based spread spectrum MIMO systems.
bit loading algorithm will use the mean system value λmeanto determine the optimum numberK∗of spreading
sequences and to select the sequences prior to allocat-ing the energy for each sequence. The second discrete bit loading method will use the minimum system valueλmin
to select the optimum number of sequences.
The system values will be ordered in an ascending order for all combinations of Kopt = K,. . ., 1 for both
dis-crete bit loading methods prior to selecting the optimum number of signature sequences. The temporary number Kopt of optimum spreading sequences is used as an
ini-tial value for each loop in an iterative sequence number optimization process.
For the discrete bit loading methods with λmean and
λmin, margin adaptive (MA) loading (equal rate)
algo-rithms will be considered initially so that all spreading sequences have the same ratebp = bpk fork= 1,. . .,K∗ by using the target system values identified in (19) in terms of the available discrete rates. The total transmis-sion rate isRT = K∗bp. Then, the two-group (TG) rate adaptive optimization will be described for both cases to use the wasted (residual) energy caused by quantization loss, by loading a certain number of channels,m, with the next discrete ratebp+1to further increase the total rate to RT,TG=(K∗−m)bp+mbp+1.
6.1 Iterative WF-based continuous bit loading
The iterative WF was originally developed to remove sub-channels, which contain negative energies, and to maxi-mize the total rate. This section describes the iterative WF optimization, which finds the optimum sub-channelsKWF∗ using the system values for continuous unequal bit load-ing. This iterative WF algorithm can also be applied to the HSDPA system with and without SIC by using the system value λk formulation given in (9) and (11), respectively. The algorithm first allocates energies to the channels before the rates and the optimum number of channels are determined. The iterative WF starts withKopt = K,
whereKopt is the temporary optimum number of codes.
In each Koptth iteration, the WF calculates the channel
SINR per energy unit vector [g]k and assigns energiesEk fork=1,. . .,Kopt. The signature sequences are reordered
starting with those signature sequences which have the lowest channel SINR. The first sub-channel is removed if it was assigned with a negative energy. When there are no more sub-channels with negative energies, energies are allocated iteratively until they converge. This continues unless a channel with negative energy is detected during the process. With the later case, the corresponding sub-channel will be removed and energies are recalculated as before. The algorithm will return the optimum number of coded channelsK∗, their respective allocated energies and signature sequences, covariance matrix CorCk and the MMSE receiver coefficient.
The iterative WF algorithm initializesKopt=Kand the
procedure is summarized as follows:
1. Initialize the loop counter asI=1. The number of energiesEkisKoptand vectorsqk,qk,1,qk,2, and korderare of lengthKopt.
2. Perform energy allocation:
(a) Calculate the channel SINR per energy unit
vector
g
k= λk Ek(1−λk)
by findingλk
from (9) for non-SIC or (11) when using the SIC receiver.
(b) Determine the WF constant
KWF= 1 K∗
⎛ ⎜
⎝ET+Kk=∗1 1
g
k
⎞ ⎟
⎠and
energy allocationsEk=KWF−
g
k
for
k=1,. . .,Kopt.
3. Perform signature sequence reordering procedure:
(a) Find the termck, the indices of thek th
smallest element ofg. Store it in the vector
kWF.
(b) Reorder vectors[Q]k=[Q]ck,
[Q1]k=[Q1]ck,and[Q2]k=[Q2]ckas well
as energiesEk=Eak for k=1,. . .,Kopt.
4. Carry out the channel removal process: IfE1<0, remove this channel by setting Kopt=Kopt−1. SetEk=Ek+1,qk =qk+1, q
k,1=q(k+1),1,qk,2=q(k+1),2and
kWFk =
kWFk+1fork=1,. . .,K∗. FormQe=[Q,Q1,Q2].
Repeat the process from step 1.
Otherwise,K∗=Kopt, set counterI=I+1and
repeat the process from step 2 untilI=Imaxis
reached.
6.2 System value-based signature sequence ordering for discrete loading
This section will describe the use of system values for ordering the signature sequences to maximize the system capacity by determining and selecting the optimum num-ber of signature sequences for receivers with and without the SIC scheme. The signature sequence ordering process starts with by setting Kopt = K and continues by
itera-tively adjustingKopt=Kopt−1 untilKopt =1 is reached.
By allocating energies equally to all selected spreading sequencesk = 1,. . .,Kopt for that iteration, the system
values are obtained from (9) or (11) for the non-SIC and SIC cases, respectively. These system values are stored in aKopt length vector λ =[λ1,. . .,λKopt]. The mean
sys-tem values λmean and the minimum system value λmin
for eachKoptiteration are stored in theK-length vectors
[λmean]Kopt and [λmin]Kopt respectively where λmean and
λminare initialized as 0K.
The system values given inλare sorted in an ascend-ing order for the current Kopt iteration and are stored
in theKoptth column of theK ×K matrixλstore, i.e., in
[λstore]1:Kopt,Kopt. The indices of the ordered system
val-ues are stored in aKoptlength vectorkorder, where indices
range from 1 toKopt.
The next step is to find theKopt-length vectorkselect =
[a1,. . .,ak,. . .,aKopt] which contains the indices of the
selected subset of the signature sequences used in the cur-rentKopt iteration. These are also ordered according to
the ascending order of the system values usingkorder. Next kselect will be stored in theKoptth column of theK ×K
upper triangular matrix Kseq such that [Kseq]1:Kopt,Kopt.
The vectorkselect is initialized askselect =[ 1,. . .,K] and Kseqis initialized as0K×K.
DefiningQorig,Qorig1, andQorig2as the original
unmod-ified receiver signature sequence matrices ofQ,Q1, and Q2 with its order is equivalent to S, reordering
proce-dure is carried out by setting [Q]k=[Qorig]ak, [Q1]k= [Qorig1]ak and [Q2]k=[Qorig2]ak. The signature sequence removal will be completed by removing the first element ofkselectso that the vector length is reduced toKopt−1,
and by removing the first columns ofQ, Q1, andQ2so
that the received signature sequence matrix dimension becomesNR(N+L−1)×(Kopt−1). This reduced matrix
will be used to calculate the system values, and order and remove the spreading sequences with the smallest system value for the nextKoptiteration by settingKopt=Kopt−1
and repeating the process untilKopt=1.
The procedure can be summarized as below.
1. Find all system values corresponding to eachKopt
fromKopt=KtoKopt=1by using the following
steps.
(a) Allocate energy equally for each signature sequence such thatEk= KEoptT , for
k=1,. . .,Kopt. Form the amplitude matrix A.
(b) Findλkfork=1,. . .,Koptusing (9) andC
from (30) for non-SIC, orλkfrom (11) and Ckfrom (12) for SIC.
Storeλ=[λ1,. . .,λKopt].
(c) Store the minimum system value
λmin
Kopt =min(λ)and
the mean system value
λmean
Kopt=
Kopt
k λk Kopt .
2. Reorder the signature sequences and remove the
signature sequence with the minimumλkfor each
Koptiteration:
(a) Find the indices of thek th smallest elements fork=1,. . .,Koptofλ, store it inkorder.
(b) Store the system values in[λstore]1:Kopt,Koptin ascending order.
(c) Find the vectorkselect=[a1,. . .,ak. . .,aKopt] which contains the indices of the selected subset of the signature sequences and with ordering according tokorder. Store the reordered sequence indexak in
Kseqk,Kopt. (d) Useakto reorder[Q]k=[Qorig]ak,
[Q1]k=[Qorig1]ak, and[Q2]k=[Qorig2]ak
fork=1,. . .,Kopt.
(e) IfKopt>1, setKopt=Kopt−1. Set Ek =Ek+1,qk =qk+1,qk,1=q(k+1),1, qk,2=q(k+1),2fork=1,. . .,K. Form
Qe=[Q,Q1,Q2]and repeat steps 1 and 2.
Otherwise, the optimum signature sequence identification for the discrete loading schemes will be performed, as described in the next two sections.
6.3 Mean system value-based discrete bit loading algorithm
To achieve the same SINR distribution at the output of each de-spreading unit so that a higher bp is selected for equal rate loading, transmission energies need to be adjusted to achieve a target (fixed) SINR at each receiver. The discrete transmission rate will be identified using the mean of the system valueλmean. This method will operate
with an energy constraintKk=∗1Ek ≤ ET to identify the optimum number K∗ of signature sequences and select the transmission signature sequences to maximize the total transmission rateRT,mean.
With the relationship of the target system valueλ∗and the bit rates bp in (19), a set of target system values stored in theP-length vectorλ∗corresponding to all bit ratesbpwill be generated. In the earlier Section 6.2, the ordered signature sequences for different number of sig-nature sequences are given in Kseq for all combinations
ofKopt = K,. . ., 1. For these values the rate to be
trans-mittedbpk will be identified by comparing
λmean
Kopt to
the target system values in λ∗for all Kopt combinations.
ordered signature sequence matrixS(mean). The algorithm is described below:
1. For the set of bit rates{bp}Pp=1, find the corresponding target system value
[λ∗]p= (2
3. Store the total rate
Rtemp,mean Kopt =
Kopt×[bmean]Koptfor
Kopt=1,. . .,K.
4. Select the optimum signature sequences satisfying
Kmean∗ =arg
5. Construct the signature sequence matrix
S(mean)=s(mean)
The TG optimization can be used to further maximize the total rate by loadingmchannels withbp+1so that the
total rate becomesRT,TGmean=(Kmean∗ −mmean)bp,mean+ mbp+1,mean. For the mean system value based
optimiza-tion method, the number of channelsmmeanwhich loads
the next discrete ratebp+1,meanwill be obtained by finding
the maximummmeanthat satisfies the following inequality
6.3.1 Energy allocation for non-SIC
This section describes the energy allocation schemes for the mean system value-based discrete bit loading alloca-tion for both the non-SIC receiver and the SIC receiver with equal rate or TG allocation. When allocating equal rate, the bit rates of each channel are equal, i.e.,bpk = bp fork=1,. . .,K∗; while bit rates are allocated asbpk =bp for k = 1,. . .,(Kmean∗ − mmean) and bpk = bp+1 for k=mmean,. . .,Kmean∗ when using the TG allocation.
With K∗, bpk and λ∗(bpk) obtained in Section 6.3 the transmission energies for the non-SIC scheme can be iteratively calculated as shown below:
Ek,i = lated by invertingCi−1given in (30), which is a function of Ek,(i−1)fork = 1,. . .,Kmean∗ withEk,0 = KEmean∗T initialized
for all channels. The iteration continues until the ener-gies converge to fixed values or the maximum number of iterations,Imaxis reached.
6.3.2 Energy allocation for SIC
As the iterative calculation of energyEk,idepends onC−i−11
which requires energies Ek,(i−1) for k = 1,. . .,K∗ for each iterationi, the SIC-based energy allocation method was developed to simplify the calculation of energy so that Ek,i depends only onEk,(i−1) and the stored covari-ance matrix inverseC−k−11which is a function ofEk−1,Imax.
The inverse covariance matrixC−k1will be calculated once per spreading sequence after having obtained the energy Ek,Imax.
The energies for the SIC-based receiver can be itera-tively calculated from E1 toEKmean∗ without any need to
invert a matrix for each energy iteration by rearranging (14) as follows:
By using (33), the energy calculation given in (23) can be simplified to covariance matrix, used for the calculation ofE1, by
ini-tializing asC−01= 1
2σ2INR(N+L−1). The termsζ1,(i−1)and ζ2,(i−1) are calculated using (37) as a function ofEk,(i−1); while γk∗ is the target SINR calculated as a function of bpk using (20). The iterations of Ek,i continue until the energy converges to a fixed value orImaxis reached. Then,
C−1
k is calculated in terms ofEk,Imax using (34). This
pro-cess is repeated for all selected transmission channels for k = 1,. . .,Kmean∗ . Once the energies are allocated, the transmitter provides the receiver with the allocated ener-gies. The next section will describe the minimum system value-based discrete bit loading schemes.
6.4 Minimum system value-based discrete bit loading algorithm
minimum system value-based discrete bit loading, the transmission energies are allocated equally Ek = EKT∗ and there is no iterative energy adjustment. Differing from the mean system value-based discrete bit loading, the minimum system value λmin will be used to
deter-mine the transmission rate for each spreading sequence. With λmin for all Kopt combinations and the ordering
of the signature sequences given in Kseq as described
in Section Sec5.2, the bit rate bp will be selected in a similar way to the mean system value based loading, except λmin is used to compare with the target system
value. The algorithm will return the optimum number of codes Kmean∗ , the total rate RT,mean =
K∗
k Kmean∗ bp and the ordered signature sequence matrix S(min). The minimum system value-based loading is summarized below:
1. For the set of bit rates{bp}Pp=1, find the corresponding target system value
[λ∗]p= (2 bp−1)
1−(2bp−1) forp=1,. . .,P.
2. Findbp,EE=[bmin]Koptthat satisfies
[λ∗]p≤λmin
Kopt <[λ ∗]
p+1.
3. Store the total rateRtemp,min
Kopt=
Kopt×[bmin]Kopt
forKopt=1,. . .,K.
4. Select the optimum number of signature sequences
by usingKmin∗ =arg
max
1≤Kopt<K
Rtemp,min
Kopt
.
The total rate becomesRT,EE=max(Rtemp,EE).
5. Construct the signature sequence matrix
S(min)=s(min) 1 ,. . .,s
(min) Kmean∗
by setting
[S(min)]k=[S]akwhereak =
Kseqk,K∗ minfor k=1,. . .,Kmin∗ .
Again, a TG allocation can be performed to further increase the total rate. For the equal energy allocation, the channels that have system valuesλk >[λ∗]p+1 where p
corresponds to the index ofbp,meanwill be loaded with the
next discrete rate bp+1,mean. The total rate for the
min-imum system value TG allocation will be RT,TGmin =
(Kmin∗ −mmin)bp,min+mminbp+1,min.
The next section will provide the results obtained from the simulations and the discussions about the perfor-mance of the different loading algorithms.
7 Results
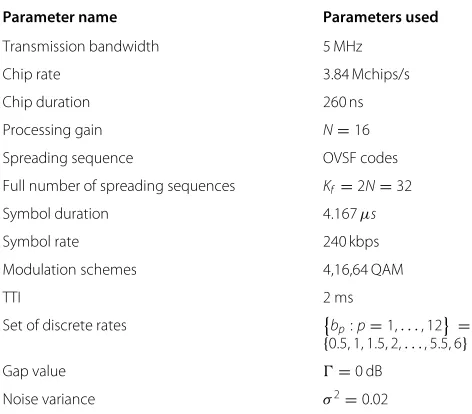
Two separate experimental setup systems were developed using the Matlab and the National Instruments (NI) Lab-VIEW platforms with the parameters as listed in Table 1. The proposed system value optimization methods both with and without the SIC implementation were tested using the Matlab and LabVIEW simulation packages with
Table 1 System parameters used for experimental set up
Parameter name Parameters used
Transmission bandwidth 5 MHz
Chip rate 3.84 Mchips/s
Chip duration 260 ns
Processing gain N=16
Spreading sequence OVSF codes
Full number of spreading sequences Kf=2N=32
Symbol duration 4.167μs
Symbol rate 240 kbps
Modulation schemes 4,16,64 QAM
TTI 2 ms
Set of discrete rates bp:p=1,. . ., 12=
{0.5, 1, 1.5, 2,. . ., 5.5, 6}
Gap value =0 dB
Noise variance σ2=0.02
the parameters: a spreading factor of N = 16, the full number of spreading sequences Kf = 2N, an additive white noise variance of σ2 = 0.02, and a gap value of
=0 dB. A set of discrete rates{bp}Pp=1, which range from 0.5 to 6 bits per symbol with intervals of 0.5, was consid-ered for transmission over a 2×2 MIMO HSDPA system. The OVSF codes, which are precoded according to 3GPP Release 7 given in [6], were used as spreading sequences.
The objective of using the two experimental platforms is to cross check the system performance obtained from the Matlab simulation environment and the LabVIEW envi-ronment. A real-time channel emulator was implemented by modifying the National Instruments FPGA channel emulation software. This emulator is fed with the vectors containing the channel impulse response samples which are externally generated from power delay profiles (PDP) as specified by the standardization organizations such as ITU and 3GPP. Two industry standard profiles, known as the pedestrians A and B PDP, shown in Tables 2 and 3, were adopted in this article as specified [29] by the ITU organization.
The pedestrians A and B PDP correspond to the chan-nel impulse responses taken at non-regular intervals with a resolution of 10 ns. The PDP given in the ITU spec-ification as shown in Tables 2 and 3 can be written as
Table 2 Pedestrian A PDP as specified by ITU
Relative delay (ns) Average power (dB) Average power linear
0 0 1
110 −9.7 0.1072
190 −19.2 0.012
Table 3 Pedestrian B PDP as specified by ITU
Relative delay (ns) Average power (dB) Average power linear
0 0 1
200 −0.9 0.8128
800 −4.9 0.3236
1200 −8.0 0.1585
2300 −7.8 0.166
3700 −23.9 0.005
P(t)= i
Piδ (t−τi) (25)
wherePiis the linear power (not the logarithmic scale) at delayτi. This PDP is sampled with a sampling rate of T1c where Tc = 260 ns is the chip period. The new PDP is given as
PTc(n)= L−1
l=0
PTc,l δ (n−l) (26)
wherePTc,lis the power component at thelth chip period andLis the length of the sampled PDP.PTc,lis given as the sum of all power inP(t)in the time intervalt=lT− Tc
2
andt=lT+ Tc
2 such as
PTc,l =
i
Pi for τi Tc +
0.5
!
=l. (27)
The pedestrians A and B channels shown in Tables 2 and 3 are re-sampled at the chip period intervals as shown in Table 4. After sampling, power is normalized so that the PDP has a unity power gain. This produces the nor-malized square root PDP given in a vector form as h = [h0,. . .,hl,. . .,hL−1]Twhere
hl =
"
PTc,l
L−1
j=0 PTc,j
forl=0,. . .,L−1. (28)
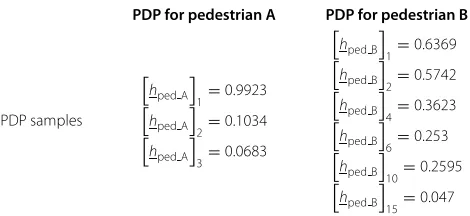
Two PDP sampled at chip period intervals for the pedestrians A and B channels were produced as: hped A =[ 0.9923, 0.1034, 0.0683]T and hped B = [ 0.6369, 0.5742, 0, 0.3623, 0, 0.253, 0, 0, 0, 0.2595, 0, 0, 0, 0, 0.047]T at regular chip period of Tc = 260 ns, which corresponds to the HSDPA system operating at 3.84 Mchips/s. The pedestrian A channel has a short delay spread of 3 chip periods and the pedestrian B PDP corre-sponds to a delay spread of 15 chip periods. The channel impulse response samples taken at the regular chip period intervals ofTc = 260 ns were used in the Matlab and the LabVIEW test environments. The pedestrians A and B PDP were specifically chosen to have channel impulses, which result in short and long ISI in the detection pro-cesses. In Table 4, the pedestrians A and B PDP taken at chip period intervals are listed to generate individual
impulse responses by applying complex Gaussian random variables to each coefficient of the square root of the PDP. Each entry in columns 2 and 3 of Table 4 corresponds to the non-zero square-root PDP coefficient for the pedes-trian channel impulse response vectorshped Aandhped B.
The entries
hped A
l+1 and
hped B
l+1 in Table 4
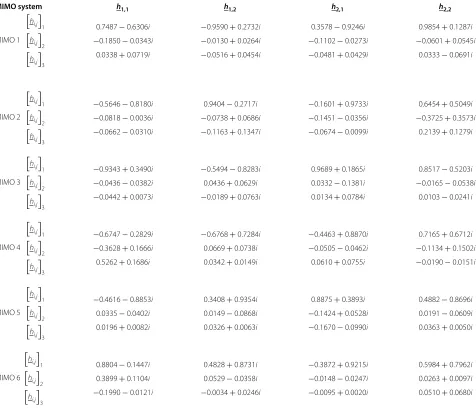
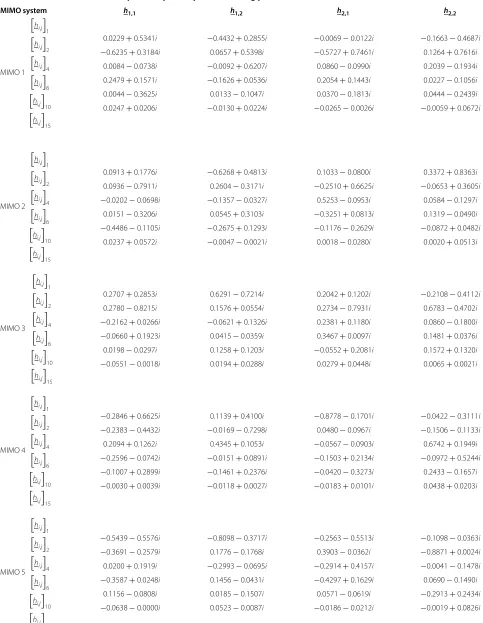
iden-tify the square-root PDP coefficients for the non-zero elements of vectors hped A andhped B with index l+1. The PDP given in Table 4 were used to generate six sets of distinct channel impulse responses. The chan-nel impulse response coefficients hi,j with Rayleigh dis-tribution, corresponding to the transmissions from the MIMO transmitter i to the MIMO receiver j, are gen-erated using two vectorsa = [a0,. . .,al,. . .aL−1]T and b=[b0,. . .,bl,. . .bL−1]Tand also the relationship
hi,j=diagh a+ib (29)
and then the response is normalized usinghi,j = hi,j
hi,j .
Where each coefficiental andbl forl = 0,. . .,L−1 is drawn from a normal distribution with zero mean and unity variance. Tables 5, and 6 list six sets of MIMO impulse responses generated from the pedestrians A and B PDP, respectively, to produce results for the experimen-tal systems. The entrieshi,j
l+1in Tables 5 and 6 identify
the PDP amplitudes for the non-zero elements of vec-torshi,j with indexl+1. These responses were used in the Matlab and LabVIEW environments to obtain a set of mean total throughput versus signal to noise ratio curves for the pedestrians A and B channels. It was observed that both the Matlab and LabVIEW experimental setup environments produced almost identical results.
Results were produced for the throughput UBs and dif-ferent optimization strategies for discrete rates in terms of system throughput in bits per symbol against the total SNR per symbol period per receiver antenna for 2× 2 MIMO. The total received SNR is expressed in dB by using
Table 4 Pedestrians A and B square root PDP sampled at
chip period intervals ofTc=260ns
PDP for pedestrian A PDP for pedestrian B
PDP samples
hped A
1=0.9923
hped A
2=0.1034
hped A
3=0.0683
hped B
1=0.6369
hped B
2=0.5742
hped B
4=0.3623
hped B
6=0.253
hped B
10=0.2595
hped B
Table 5 Six MIMO channel impulse responses for pedestrian A for PDP
total number of receiver antennas.
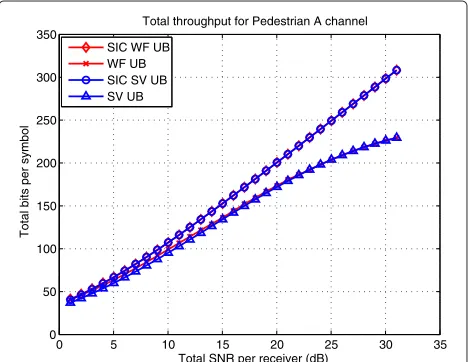
For the UB throughput examination, the system value and the iterative WF UBs were simulated using the meth-ods described in Sections 5 and 6.1, respectively. The corresponding curves for the water filling and the system value UBs both with and without the SIC schemes were labeled using the labels SIC WF UB, SIC SV UB, WF UB, and SV UB. Figure 3 shows the results for the WF UBs and system value UBs for both the non-SIC and the SIC schemes for the pedestrian A channel. The proposed sys-tem value UB achieves the same syssys-tem capacity as the iterative WF for the systems with and without SIC. How-ever, the system value UB is a good alternative to the WF UB due to its simplicity and its shorter processing time for calculating the system capacity. In the same figure, it
is shown that the SIC UB achieves a much higher sum capacity especially at a high input SNR, where the total available energy is greater, and the energy per channel is higher. Thus, a higher interference is introduced to other parallel channels above a given total SNR and the sys-tem capacity saturates at an asymptotic value. To improve the sum capacity the SIC-based receiver cancels the inter-ference corresponding to the detected symbols, starting from those which have the highest system value. As the SIC UB achieves a much higher sum capacity than the non-SIC system, it will be used as the ultimate UB, when comparing the performance and improvements obtained through different optimization strategies for the rest of this section.
Table 6 Three MIMO channel impulse responses produced using pedestrian B PDP(Continued)
MIMO 6
hi,j 1
hi,j
2
hi,j
4
hi,j
6
hi,j
10
hi,j 15
−0.2840−0.2491i −0.4385−0.5626i −0.4491−0.2567i
0.0135+0.2173i −0.1683−0.0388i −0.0242+0.0558i
−0.7960−0.0408i
0.2196−0.2892i −0.0165+0.2390i
0.2314−0.1565i −0.1509−0.2634i
0.0241+0.0684i
0.6534+0.4181i
0.2096−0.0745i −0.0821+0.3265i
0.0229−0.2907i
0.0654−0.3807i −0.0099−0.0324i
−0.1519+0.0626i
0.3893−0.7242i
0.3158+0.2367i
0.1111−0.0626i −0.2742−0.2223i
0.0150−0.0101i
Section 6. The corresponding curves in various figures have been labeled using SIC TG ES, SIC TG EE, TG ES, and TG EE for the systems with and without SIC. The term ES refers to the equal SNR loading case and the term EE refers to the equal energy loading case. These labels were appended with either FULL or OPT for the configurations corresponding to the systems with the full and optimum number of spreading sequences. The sig-nature sequence ordering for a given set of total receiver SNRs was implemented using the algorithm described in Section 6.2. The optimum number of spreading sequences and also the data rates to be transmitted for the mean and minimum system value-based algorithms were calcu-lated using the methods described in Sections 6.3 and 6.4, respectively.
The mean system value-based rate allocation requires iterative energy calculations, which were produced using the methods described for the non-SIC and the SIC-based systems, respectively, in Sections 6.3.1 and 6.3.2. Iterative energy allocation methods were used to achieve equal SINR levels at the output of the de-spreading units. For the non-SIC receiver with the equal SNR (ES)-based
0 5 10 15 20 25 30 35
0 50 100 150 200 250 300 350
Total SNR per receiver (dB)
Total bits per symbol
Total throughput for Pedestrian A channel
SIC WF UB WF UB SIC SV UB SV UB
Figure 3The system value UBs for the Pedestrian A channels.The figure shows the results for the system value UB and WF UBs for both non SIC and SIC schemes when operating the Pedestrian A channel.
transmission energy allocation, the iterative power allo-cation stops, either when the sum difference between the current energy and the previous energy in the energy iter-ation loop is less than 1% of the total energy, i.e.,E =
K
k=1|Ek,i −Ek,i−1| ≤ 0.001ET or when the maximum number of iterationImaxis reached. The energy for each
coded channelEk for the SIC ES allocation iterates until Ek = |Ek,i−Ek,i−1| ≤0.001EKT.
The processes described above were repeated for var-ious total signal to noise ratios at the output of the de-spreading units for channels with pedestrians A and B channel PDP.
In Figure 4, the results are shown for the two-group equal SINR allocation using an optimum sub-channel selection and SIC optimization strategies, when trans-mitting spread signals over pedestrian A channel. The improved system for the equal SINR allocation with SIC achieves system throughputs corresponding to the curves SIC TG ES OPT, SIC TG ES FULL, and these achieved throughputs are very close to the SIC UB. It is not
0 5 10 15 20 25 30 35
0 50 100 150 200 250 300 350
Total SNR per receiver (dB)
Total bits per symbol
Total throughput for Pedestrian A channel
SIC SV UB SIC TG ES OPT SIC TG ES FULL TG ES OPT TG ES FULL
necessary for the SIC-based receiver to determine the optimum number of spreading sequences, when allocat-ing equal SINR as the SIC scheme reduces these inter-ferences. The SIC TG ES OPT scheme provides a 3-dB improvement over the transmission system with the TG ES FULL strategy. The TG ES OPT scheme, on the other hand, provides a 1.5-dB enhancement over the TG ES FULL scheme, when the total SNR is 35 dB.
Figure 5 shows the pedestrian A results for a system with the optimum number of ordered spreading sequences, the SIC receiver and the discrete bit loading method based on minimum system value. It is shown that the SIC TG EE OPT scheme has a 4.5-dB improvement over the TG EE FULL-based system before the system throughput sat-urates at the total SNR value of 35 dB. The use of an optimum number of ordered signature sequences at the total SNR of 35 dB results in the TG EE OPT scheme hav-ing a 2.5-dB improvement over the TG EE FULL scheme. The performance of the receiver with the SIC TG EE FULL scheme is enhanced by 3 dB over the TG EE FULL scheme using the full number of spreading sequences. It is observed that the system with the TG equal energy (EE) allocation, SIC and the optimum number of spreading sequences approaches the non-SIC system value UB. It is further noted that at the total SNR value of 35-dB a 3-dB difference is observed compared with the SIC UB before the system throughput diverges.
Figure 6 shows the simulation results corresponding to data transmitted over the pedestrian B channel. The sys-tem throughput saturates for the TG ES FULL scheme at a lower total SNR (at 30 dB) compared to the pedestrian A channel. At the total discrete data rate of 100 bps, the SIC
0 5 10 15 20 25 30 35
0 50 100 150 200 250 300 350
Total SNR per receiver (dB)
Total bits per symbol
Total throughput for Pedestrian A channel
SIC SV UB SV UB SIC TG EE OPT SIC TG EE FULL TG EE OPT TG EE FULL
Figure 5The minimum system value based discrete bit loading system throughput versus total SNR for the Pedestrian A channels.The optimization strategies using optimum sub-channels selection and SIC for the TG with minimum system value loading are shown.
0 5 10 15 20 25 30 35
0 50 100 150 200 250 300
Total SNR per receiver (dB)
Total bits per symbol
Total throughput for Pedestrian B channel
SIC SV UB SIC TG ES OPT TG ES OPT TG ES FULL SIC TG EE OPT TG EE OPT TG EE FULL
Figure 6Total throughput versus total received SNR results for the pedestrian B channels when using SIC based receivers and optimum signature selection scheme.Results showing greater improvements when using SIC based receivers and optimum sub-channels selection and when operating over the pedestrian B channel.
TG ES OPT provides 7 and 4 dB improvements, respec-tively, over the systems with TG ES FULL and TG ES OPT schemes. At the total discrete rate of 120 bps, more than 10-dB improvement is observed when using the SIC TG EE OPT scheme with the optimum number of spread-ing sequences over the TG EE FULL scheme. An 8-dB improvement is achieved by using the optimum number of ordered spreading sequences. Around the total SNR value of 30 dB the SIC TG EE OPT receiver with the optimum number of channels produces a 3-dB improve-ment over the TG EE OPT scheme without the SIC receiver. For the pedestrian B channel, the SIC TG EE OPT scheme for the TG discrete bit loading method produces a throughput, which exceeds the throughput of the TG method TG ES OPT with the optimum number of spread-ing sequences. The collaborative use of the SIC scheme with the optimum number of signature sequence selection scheme achieves a system throughput close to the system value UB.
Table 7 Pedestrian A experimental results
Scheme SNR for SNR for Rate at Rate at
50 bps 150 bps 20 dB SNR 35 dB SNR
WF UB 17 30 71.36 185
SIC WF UB 16.6 28.5 75.5 213
SV UB 16.8 30 68.3 184
SIC SV UB 16.5 28.5 75.3 213
TG ES OPT 17 29.5 70.5 177
TG ES FULL 17.5 31 66 169
TG EE OPT 18 31.6 61.8 150.6
TG EE FULL 19.5 35 51.9 166.2
SIC TG ES OPT 16.6 28.8 74 N/A
SIC TG ES FULL 17.2 28.8 73 N/A
SIC TG EE OPT 17.5 30.5 65.15 174.5
SIC TG EE FULL 18.5 32 57.4 165.8
to each other. The TG EE FULL scheme achieves 29.7% of the SIC TG ES OPT performance and 37.4% of the SIC TG EE OPT performance for pedestrian B channel. On the other hand, the corresponding figures for the TG EE FULL scheme is 82% of the SIC TG ES performance and 85.8% of the SIC TG EE OPT performance for pedestrian A channel (Table 9).
The reason the TG EE FULL scheme achieves 29.7 and 82% of the SIC TG ES performances for pedestrians A and B channels, respectively, is that the PDP lengths or delay spreads for the pedestrians A and B channels are 3 and 15 chip periods, respectively. The HSDPA system, which uses the equal energy discrete bit loading method without the optimum number of spreading sequences suffers from a reduction in the total throughput com-pared with an HSDPA MIMO system with the optimum
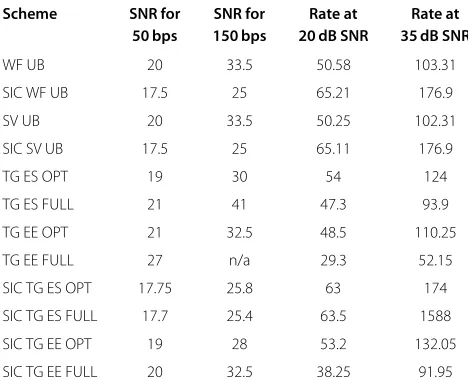
Table 8 Pedestrian B experimental results
Scheme SNR for SNR for Rate at Rate at 50 bps 150 bps 20 dB SNR 35 dB SNR
WF UB 20 33.5 50.58 103.31
SIC WF UB 17.5 25 65.21 176.9
SV UB 20 33.5 50.25 102.31
SIC SV UB 17.5 25 65.11 176.9
TG ES OPT 19 30 54 124
TG ES FULL 21 41 47.3 93.9
TG EE OPT 21 32.5 48.5 110.25
TG EE FULL 27 n/a 29.3 52.15
SIC TG ES OPT 17.75 25.8 63 174
SIC TG ES FULL 17.7 25.4 63.5 1588
SIC TG EE OPT 19 28 53.2 132.05
SIC TG EE FULL 20 32.5 38.25 91.95
Table 9 Comparing of HSDPA system performance over pedestrians A and B channels at 35-dB SNR
Scheme Rate at 35 dB
For pedestrian A For pedestrian B
SIC WF UB 213 177
SIC SV UB 213 177
SIC TG ES OPT 182 174
SIC TG EE OPT 174.5 132
SIC TG EE FULL 165.8 92
TG EE FULL 166.2 59.15
number of ordered spreading sequences, when encoun-tering multipath channels with PDP lengths approaching the processing gain, N, of the system. The proposed method of finding the optimum number of ordered signa-ture sequences improves the performance of equal energy loading systems.
8 Conclusion
This article has developed and proposed algorithms, which maximize the system throughput, while reducing the computational cost. Complexity reduced system value UBs are proposed, which achieve the same sum capacity as iterative WF. In terms of complexity reduction, the use of system values proposed in this article finds the rates and provides optimum sub-channels selection before power allocation is performed. This eliminates the requirement to undertake iterative searches for the optimum bit rates combined with computationally intensive iterative power allocation for the equal SNR (ES) allocation. The optimum number of signature sequences can produce the maxi-mum system throughput close the system value capacity UB. The proposed SIC increases the system throughput, but also simplifies the covariance matrix inversion process required for both the EE and the ES allocations. The com-putational reduction is especially significant for the ES allocation, where iterative energy allocation is required.