Prior for Structural Materials
D. Neudecker1,a, St. Gundacker2, H. Leeb1,b, Th. Srdinko1, and V. Wildpaner1 1 Atominstitut, Technische Universit¨at Wien, Vienna, Austria
2
CERN, Geneva, Switzerland
Abstract. The construction of a library containing prior cross sections and related covariance matrices for nine frequently measured reaction channels of 276 structural materials from 1 to 150 MeV is presented. This library provides a starting point for future evaluations and reduces them to the analysis of experimental data. The prior cross sections were calculated using the nuclear reaction programs of TALYS1.0 and TALYS1.2 with the implemented global and local neutron and proton optical potential parameter sets. The prior covariance matrices contain contributions stemming from parameter uncertainties and model deficiencies. The associated procedures are discussed and an example evaluation with these prior cross sections and covariance matrices is shown for one specific isotope. These developments are of great importance with regard to the reliability of evaluations strongly based on model calculations. This is particularly true for the extension of the energy range as requested by the development of novel nuclear technologies.
1 Introduction
Current efforts in nuclear data evaluation are triggered by the development of novel nuclear technologies and safety requirements. There are two major demands, i.e. (1) the supply of reliable uncertainty estimates in the form of co-variance matrices and (2) the extension of the energy range of the data files up to 150-200 MeV. Because of the scarcity of experimental data beyond 20 MeV in most reaction chan-nels such extended evaluated data sets rely heavily on nu-clear models. Consequently, the determination of associ-ated covariance matrices must account not only for the ex-perimental uncertainties, but also for the limitations of the models employed.
A reliable uncertainty estimate of nuclear calculations must account at least for the limited knowledge of model parameters as well as for the deficiencies of the model. The former depends strongly on the admissible bounds of model parameters, which should be chosen reasonably, best on the basis of physics and mathematics constraints. Apart from this choice the calculation of corresponding covari-ance matrices is straightforward, albeit tedious. The esti-mate of model deficiencies is much more difficult and there exist only few procedures [1–3] for their determination.
A nuclear data evaluation aims at the best knowledge of cross sections combining the experimental information with the predictions of nuclear models in the Bayesian para-digm. The cross sections and associated covariance matri-ces generated by nuclear models represent the prior knowl-edge for the evaluation procedure.
In this contribution, we present a library with prior sets for 276 isotopes relevant for structural materials. The prior cross sections were calculated with programs of TALYS1.0 and TALYS1.2 [4] using implemented local or global op-tical potential model parameter sets [5]. The prior covari-ance matrices contain contributions from parameter
uncer-a e-mail:[email protected] b e-mail:[email protected]
tainties and model defects. Section 2 briefly summarizes the procedures. In order to show the feasibility of this li-brary, an example evaluation with55Mn prior data is com-pared to an evaluation with a prior specifically made for this isotope, see Section 3. A summary and outlook is pro-vided in Section 4.
2 Generation of Prior Knowledge
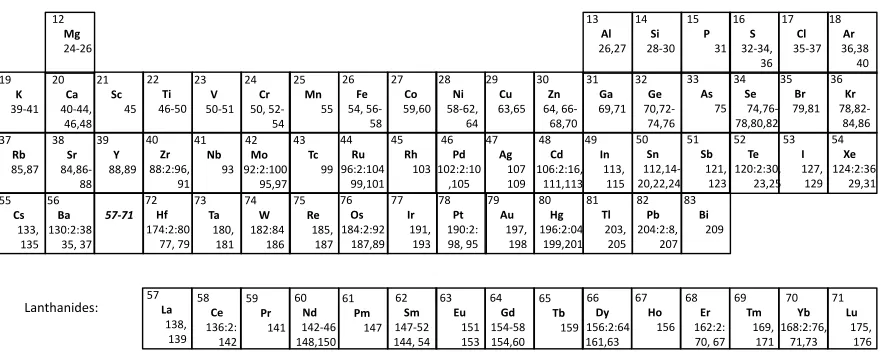
Prior cross sections and covariance matrices were calcu-lated for nine frequently measured channels of 276 iso-topes of structural materials. The library was constructed for angle-integrated cross sections of incoming neutrons. The nine channels are given in Table 1 and the isotopes – provided over a great part of the periodic table – are shown in Fig. 1. Isotopes from24Mg to209Bi were considered in
the library. These isotopes are within the validity range of the global and local optical potential by [5]. In addition, the employed models implemented in TALYS are not adequate for the other mass-values. Furthermore, only those isotopes were calculated for which at least three experimental data sets are available in EXFOR [6] for five channels of Ta-ble 1.
The prior cross sections and covariance matrices are valid for evaluations in an energy range from 1 to 150 MeV. Also an energy bin from 1.0e-05 eV to 1 MeV is supplied in order to conform to the ENDF-6 standard. However, the methods [1] employed to calculate this library have been developed for evaluations above the resonance region.
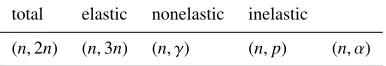
Table 1.List of channels available in the library.
total elastic nonelastic inelastic
(n,2n) (n,3n) (n, γ) (n,p) (n, α) DOI: 10.1051/
C
Owned by the authors, published by EDP Sciences, 2012 epjconf 20122/ 700010
Lanthanides: 12 Mg 24-26 13 Al 26,27 14 Si 28-30 15 P 31 16 S 32-34, 36 17 Cl 35-37 18 Ar 36,38 40 36 Kr 78,82-84,86 54 Xe 124:2:36 29,31 71 Lu 175, 176 35 Br 79,81 53 I 127, 129 70 Yb 168:2:76, 71,73 34 Se 74,76-78,80,82 52 Te 120:2:30, 23,25 69 Tm 169, 171 33 As 75 51 Sb 121, 123 83 Bi 209 68 Er 162:2: 70, 67 32 Ge 70,72-74,76 50 Sn 112,14-20,22,24 82 Pb 204:2:8, 207 67 Ho 156 31 Ga 69,71 49 In 113, 115 81 Tl 203, 205 66 Dy 156:2:64 161,63 65 Tb 159 80 Hg 196:2:04 199,201 48 Cd 106:2:16, 111,113 30 Zn 64, 66-68,70 29 Cu 63,65 28 Ni 58-62, 64 27 Co 59,60 26 Fe 54, 56-58 25 Mn 55 24 Cr 50, 52-54 23 V 50-51 22 Ti 46-50 21 Sc 45 20 Ca 40-44, 46,48 19 K 39-41 47 Ag 107 109 46 Pd 102:2:10 ,105 45 Rh 103 44 Ru 96:2:104 99,101 43 Tc 99 42 Mo 92:2:100 95,97 41 Nb 93 40 Zr 88:2:96, 91 39 Y 88,89 38 Sr 84,86-88 37 Rb 85,87 79 Au 197, 198 78 Pt 190:2: 98, 95 77 Ir 191, 193 76 Os 184:2:92 187,89 75 Re 185, 187 74 W 182:84 186 73 Ta 180, 181 72 Hf 174:2:80 77, 79 57-71 56 Ba 130:2:38 35, 37 55 Cs 133, 135 64 Gd 154-58 154,60 63 Eu 151 153 62 Sm 147-52 144, 54 61 Pm 147 60 Nd 142-46 148,150 59 Pr 141 58 Ce 136:2: 142 57 La 138, 139
Fig. 1.The isotopes available in the library are displayed. ’162:2:70’ is equivalent to ’162,164,166,168,170’.
The prior covariance matrices contain contributions of parameter uncertainties as well as model defects. Covari-ances are supplied for all pairs of energy bins of the same channel as well as between different channels. Covariances between different isotopes are not supplied in the current version.
The prior cross sections and covariance matrices are given in ENDF-6 format in order to comply with the stan-dard format of nuclear data evaluation. The cross sections are given in MF=3 files and the covariance matrices in MF=33 files. A general description of the generation pro-cedure and details for the specific isotope are given in MF=1 files.
2.1 Theoretical Cross Sectionsσth
The quality of the evaluated data will be high in general, if the prior gives a fair description of the experiments. There-fore, we used the well-established and tested local and glo-bal parameter sets for the neutron and proton optical model potential by Koning and Delaroche [5]. The local neutron optical potential parameters were obtained by a method based onχ2optimization and simulated annealing and
us-ing neutron elastic scatterus-ing cross sections, total cross sec-tion and proton elastic scattering data [5]. From the local parameters of single isotopes, a global parameterization for the neutron and proton optical model parameters was con-structed. Only for the isotopes27Al,40Ca,56Fe,58Ni,89Y, 90
Zr,93Nb,197Au,208Pb and209Bi, experimental total cross sections were considered in the optimization procedure. In order to avoid double counting of experimental data dur-ing a future evaluation with a local prior of one of these isotopes, only experimental total cross section data should be used which arenot listed in Table 2 of [5]. If global prior cross sections and covariance matrices are used in a future evaluation, no special care needs to be taken regard-ing possible double countregard-ing of experimental data.
If a local parameterization of the optical potential was not available, the global one was used. For the level den-sity and the charged particle potential parameters the de-fault values of TALYS [4] were taken. For each isotope, the prior cross sections and associated uncertainties were
calculated using TALYS1.0 and TALYS1.2 for local and global parameter sets, resulting in total in four priors for each isotope.
2.2 Parameter Uncertainty Covariance MatricesA0PU
The covariance matricesAPU
0 account for the limited
knowl-edge of the initial model parametersa0 described in Sec-tion 2.1. They are estimated by
APU0 (Ej,Ek)=
1
I I
X
i=1
σj(ai)−σth,j σk(ai)−σth,k
(1)
following the methods in [7]. The theoretical cross sec-tionsσth =σ(a0) are calculated according to Section 2.1.
The cross sectionsσjandσkare calculated by TALYS [4]
using parameter vectors ai. These are randomly selected following a uniform distribution within defined parame-ter boundariesa<anda>. The parameters are assumed to be independent from each other. For each isotope 3000 parameter vectors are selected each for global and local TALYS1.2 priors and 1500 parameter vectors are selected for global and local TALYS1.0 priors. Each parameter vec-tor corresponds to a call of TALYS, resulting in a total of about 300 000CPU hours on the Vienna Scientific Cluster to computeAPU0 for all isotopes in Fig. 1.
However, the main problem were not the time-intensive calculations, but to establish reasonable parameter bound-aries for each parameter of all isotopes. In [8], an exam-ple showed that unphysically small parameter boundaries can result in deficient output even if sufficient experimen-tal data are included. Otherwise if the parameter bound-aries are chosen much too large, the evaluated uncertainties might also be too large and therefore of little use. Hence, special care was taken to establish the parameter aries on a physical basis if possible, and to limit the bound-aries to a reasonable size. In the following, it is shown by means of two parameters, i.e.RV andd2, how the
Parameter Boundaries forRV The parameterRV is the radius of the real volume-central contribution VV to the phenomenological neutron optical potential. This param-eter appears in the radial Woods-Saxon form ofVV,
f(r,RV,aV)= 1+exp (r−R
V aV
)!−1 ,
with the diffuseness parameter aV. The optical potential
VV consists of a product of f(r,RV,aV) and an energy-dependent part which is of no further interest for this con-sideration.
In order to estimate physical parameter boundaries, we calculate a mean square radiushr2
opiofVV by
hrop2 i= R
r2V
V d3r
R
VV d3r =
R∞
0 r
4f(r,R
V,aV) dr
R∞
0 r
2f(r,R
V,aV) dr
. (2)
This radius of the interaction should be larger than, or at least equal to, the mean square charge radius of the nu-cleushrn2i. The margin of hr2opi is related to the range of
the strong interaction, i.e.rf =1.4 fm. Thus, we obtain the
following condition to establish boundaries forRV
q hr2
ni ≤
q hr2
opi ≤
q hr2
ni+rf. (3)
For hr2ni the nuclear mean square charge radii of [9]
were used. In order to obtain upper and lower boundaries forRV, Eq. (2) was solved for different values ofRV em-ploying the associated initial parameter value foraV.
50 100 150 200
0.9 1 1.1 1.2 1.3 1.4
Mass number
r V
=R
V
/A
1/3
Fig. 2.Global values for the parameterrVand associated param-eter boundaries obtained by Eqs. (2) and (3).
In Fig. 2, global values ofrV = RV/A1/3
and the as-sociated parameter boundaries are displayed over the mass number A. Upper parameter boundaries ofrV exceeding
1.4 fm were considered to be unreasonably large and there-fore set to 1.4 fm.
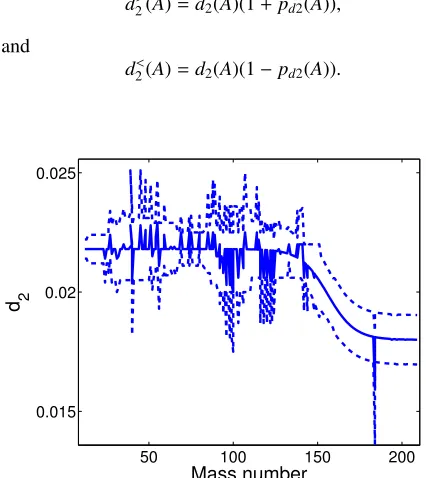
Parameter Boundaries ford2 The parameterd2occurs
in the energy-dependent part of the imaginary surface-cen-tral contributionWD(E) to the neutron optical potential of
[4],
WD(E)=d1
(E−Ef)2
(E−Ef)2+d23
exp{−d2(E−Ef)},
with the Fermi energy Ef. For this parameter, no
phys-ical argument was found to obtain reasonable parameter boundaries.
Fortunately, for some isotopes d2-values are available
for local and global parameter sets. These give a first indi-cation of a physically reasonable parameter space for this specific isotope. Furthermore, following [5] we assumed that neighboring isotopes may show similar properties and thus parameters valid for one isotope might be reasonable for a neighboring nucleus as well.
In order to obtain parameter boundaries for a local pa-rameter valued2(A) of a specific isotope with mass number A, we compared it with the local parameters ford2of
iso-topes withinC =[A−10,A+10] and determined
pd2(A)=
1
d2(A)
max (max(C)−d2(A),d2(A)−min(C)).
The upper and lower boundaries ofd2(A) are obtained by
d2>(A)=d2(A)(1+pd2(A)),
and
d2<(A)=d2(A)(1−pd2(A)).
50 100 150 200
0.015 0.02 0.025
Mass number d 2
Fig. 3.Local values for the parameterd2and associated parame-ter boundaries.
The obtained parameter boundaries ford2are shown in
Fig. 3. The unusual small value ofd2for184W was ignored
during the analysis and treated separately. AboveA=162,
pd2(A=162) was assumed for allpd2. The valuespd2
ob-tained for the locald2were also used for the globald2. All
the locald2are also within the error bars of the global ones.
2.3 Model Defect Covariance MatricesAMD 0
The model defect covariance matricesAMD
0 should provide
a measure for model deficiencies. In order to estimateAMD
0 ,
we used the ’scaling procedure’ first proposed in [1] and re-fined in [2]. This phenomenological algorithm relies on the comparison of experimental cross sectionsσewith model
cross sectionsσth and implicitly assumes that the model
employed. However, experimental data of the isotope to be calculated are not considered to avoid double counting. To put it in a nutshell, we define an energy-dependent scaling factorhDc
n(Em)ifor each isotopenand reaction channelc
hDcn(Em)i= X j∈Ebin(Em)
w(c,Em,n) j
σ(ec,n)(Ej)
σ(thc,n)(Ej)
,
and an energy-independent scaling factorDc,
Dc= P1N(c) n=1
N(c)
X
n=1 M
X
m=1
w(mc,n)
p
KnhDcn(Em)i, (4)
which is weighted with the number of experimental data pointsKnfor isotopen.N(c) gives the total number of
iso-topes per reaction channelcfor which experimental data are available. The weightsw(c,Em,n)
j andw
(c,n)
m are defined
such that the largestσth either in energy binmor of the
whole reaction channelcrespectively has the largest weight. The model defect covariance matrix is estimated by
A0MD(Em,Em′)=
σcth(Em)σcth(Em′)
τcc′
(Em,Em′)
×
N(c)
X
n=1
n
∆Dcn(Em), ∆Dcn(Em′)+δcc′gmm′∆D˜cc ′
n (Em,Em′)
o
(5)
with
∆Dcn(Em)=hD c
n(Em)i −D
c
and a term
∆D˜ccn′(Em,Em′)=
p hDc
n(Em)2i − hDcn(Em)i2
× q
hDc′
n(Em′)2i − hDc ′ n(Em′)i2,
where the latter simulates the systematic fluctuations ofσe.
The function
gmm′= 1
2πωexp (
−(Em−Em′)
2
2ω2
)
models the width of these systematic fluctuations. With ω = 1.5 MeV, a small width was chosen. The normal-ization factor τcc′
is given by the root of the number of isotopes for which experimental data were used for the re-action channelcandc′and energy binmandm′.
The ’scaling procedure’ suppliesAMD
0 only for energy
regions where experimental data are available. For other energy regions, the extrapolation algorithm of [2] is em-ployed.
All experimental cross sections from 1 to 150 MeV for the channels given in Table 1 were extracted from the EXFOR database [6]. They were carefully preselected to exclude erroneous data and obvious outliers. In order to reduce the weight of missed erroneous data and isotopes behaving very differently from all other isotopes, all ex-perimental data were employed to calculate AMD
0 for one
specific isotope except the experimental data of the isotope itself. This was done in order to avoid double-counting in later evaluations. However, it makes no difference for the
AMD
0 whether the data of the considered isotope is used or
not. This is not surprising due to the huge amount of ex-perimental data involved.
2.4 The Complete Prior
The prior cross sections σc
0 for a channel care obtained
by rescalingσth of Section 2.1 with the scaling factor of
Eq. (4),
σc0=σcthDc. (6) The prior covariance matricesA0are obtained
accord-ing to [2] by
Acc0′(Em,Em′)=DcAPU,cc ′
0,mm′D c′
+A0MD,mm,cc′′. (7)
Before combiningAPU
0 andA
MD
0 , the covariance matrices
are regularized by the algorithms described in [10] in order to restore positive semi-definiteness. Positive semi-definite-ness of prior covariance matrices is violated due to nu-merical instabilities in the parameter uncertainties and due to fluctuating experimental data used for estimating model deficiencies. IfAPU0 andAMD0 are positive semi-definite, the prior covariance matrixA0is also positive semi-definite.
3 Example Evaluation with
55Mn Prior
In order to show the feasibility of the prior structural mate-rial library, we performed a test evaluation with local and global TALYS1.0 prior data sets for55Mn. The
experimen-tal data were inserted ’quasi blind’ into the prior knowl-edge and no special measures were taken to improve the evaluated data.
This isotope was already evaluated with essentially the same theoretical procedures. In the previous evaluation [10] great care was taken to define a best-fitting initial parame-ter set specifically for this isotope, and the parameparame-ter bound-aries for APU
0 were carefully established and revisited to
give a consistent evaluation output.
As TALYS1.0 [4] was used for [10], we employ in this example evaluation also only the prior data for TALYS1.0. In the evaluation of [10], also the (n,4n), (n,t) and (n,pα) reaction channels were evaluated using available experi-mental data of EXFOR [6]. These three reaction channels are not considered in the library and hence a new evalua-tion was undertaken starting from the prior of [10]. In this evaluation, the same experimental data were included as in the TALYS1.0 priors by means of the Full Bayesian Eval-uation Technique, namely: Total, elastic, inelastic, (n,2n), (n,p) and (n, α) cross sections. The thus evaluated cross sections starting from the prior of [10], which are stud-ied in this proceeding, do not differ visibly from the corre-sponding evaluated data of [10].
The cross sections of the global TALYS1.0 prior data set correspond well to the experimental cross sections up to 25 MeV, above they show systematic deviations, see Fig. 4. The corresponding prior uncertainties provide error bands which include all experimental data, although these uncer-tainties were established on global considerations and not specifically for this isotope. The different parameter space of the global TALYS1.0 prior and the prior of [10] can be clearly seen in the larger prior uncertainties of the global TALYS1.0 prior.
1 2 3 4 5 x 10⁷ 0
0.2 0.4 0.6 0.8 1
Energy (eV)
Cross Section (b)
11421.005 22292.006 22703.011 41240.010 Best prior Global prior
Fig. 4.Global TALYS1.0 prior cross sections (full red line) and uncertainties (red dashed lines) for the 55Mn (n,2n) reaction
channel in comparison to prior data of [10] (blue lines) and ex-perimental data used in the evaluations.
1 2 3 4 5
x 107 0
0.2 0.4 0.6 0.8 1
Energy (eV)
Cross Section (b)
11421.005 22292.006 22703.011 41240.010 Best eval Global eval
Fig. 5.Evaluated cross sections (full lines) and error bars (dashed lines) of55Mn (n,2n). The red data were obtained with the global
TALYS1.0 prior and the blue data were obtained with the prior of [10].
prior of [10]. This reflects the difference in the parameter space which was restricted specifically for55Mn in [10],
while the current prior was generated from a global con-sideration. In the energy range with accurately known ex-perimental data the relative errors of the two evaluations are of the same size. Above 50 MeV, the evaluated relative errors of the global TALYS1.0 prior are 10% higher than those evaluated with the prior of [10]. However in this en-ergy range the cross sections are already quite small and no major impact on derived quantities is expected. The co-variance matrix evaluated with the global TALYS1.0 prior is similar to that using the prior of [10], see Figs. 7 and 8. The evaluated covariance matrix of the global TALYS1.0 prior differs visibly from the corresponding prior covari-ance matrix in the energy range of the experiments and shows similar properties above (see Fig. 6).
The evaluated (n,2n) cross sections corresponding to the local TALYS1.0 data set also agree well with those calculated with the prior of [10] and the included exper-imental data, see Fig. 9. The evaluated cross sections of the local and the global data set show slightly different be-havior between 17 and 27 MeV. This is caused by the dif-ferent initial parameterization of the cross sections. This differences amounts to maximally 13.42% (mean devia-tion of 3.24% in this energy region) and both evaluated
correlation (n,2n) with (n,2n)
0 20 40 60 80 100 120 140
Energy (MeV)
-1 -0.5 0 0.5 1
0 20 40 60 80 100 120 140 0 0.5
rel. err.
Energy (MeV)
Fig. 6.Global TALYS1.0 prior correlation matrix and relative er-rors (box below) for55Mn (n,2n;n,2n).
correlation (n,2n) with (n,2n)
0 20 40 60 80 100 120 140
Energy (MeV)
-1 -0.5 0 0.5 1
0 20 40 60 80 100 120 140 0 0.5
rel. err.
Energy (MeV)
Fig. 7.Evaluated55Mn (n,2n) correlation matrix and relative
er-rors (box below) for the global TALYS1.0 prior.
correlation (n,2n) with (n,2n)
0 20 40 60 80 100 120 140
Energy (MeV)
-1 -0.5 0 0.5 1
0 20 40 60 80 100 120 140 0 0.5
rel. err.
Energy (MeV)
Fig. 8.Evaluated55Mn (n,2n) correlation matrix and relative
er-rors (box below) for the prior of [10].
cross sections lie within the errorbars of the experimental data included in the evaluation. Especially, the agreement for the evaluated (n,2n) cross sections beyond 25 MeV with the experiment should be remarked because they have been all obtained from priors deviating systematically from the experiment at these energies. This ’healing of data’ via evaluation is only possible if a properAMD
0 is included in
the prior covariance matrix [11]. The evaluated covariance matrix of the local TALYS1.0 prior is very similar to the global TALYS1.0 one.
1 2 3 4 5 x 10⁷ 0
0.2 0.4 0.6 0.8 1
Energy (eV)
Cross Section (b)
11421.005 22292.006 22703.011 41240.010 Best eval Local eval
Fig. 9.Evaluated cross sections (full lines) and errorbars (dashed lines) of55Mn (n,2n). The red data were obtained with the local
TALYS1.0 prior and the blue data were obtained with the prior of [10].
place while at 20 MeV the experimental information ends. These kinks occur both in the global TALYS1.0 prior and in the evaluation starting from the prior of [10], although the kink at 12 MeV is less pronounced with the prior of [10]. Both evaluations describe the experimental data well within the uncertainties. The kinks are caused by the weak prior correlations of the associated energy range and re-flect at 12 MeV the slightly diverging experimental data, Fig. 11. In order to obtain a smooth curve as expected from model data, smoothing algorithms can be applied.
1 2 3 4
x 107
0 0.005 0.01 0.015 0.02 0.025 0.03 0.035
Energy (eV)
Cross Section (b)
22414.016 22292.007 41298.010 Best eval Global eval
Fig. 10. Evaluated cross sections (full lines) and errorbars (dashed lines) of55Mn (n, α). The red data were obtained with
the global TALYS1.0 prior and the blue data were obtained with the prior of [10].
The evaluation starting from a prior specifically made for55Mn [10] and the ’blind evaluation’ using global and local TALYS1.0 priors produced similar cross sections as well as covariance matrices when the same experimental data are entered into the evaluation process. In general, the evaluated errors of the evaluation with the global and lo-cal priors were larger than those evaluated with the prior of [10], which can be easily explained by the global con-struction of the former. This is a first indication that the prior structural material library might be feasible for fu-ture evaluations.
correlation (n,a) with (n,a)
0 20 40 60 80 100 120 140
Energy (MeV)
-1 -0.5 0 0.5 1
0 20 40 60 80 100 120 140 0 0.5
rel. err.
Energy (MeV)
Fig. 11.Global TALYS1.0 prior correlation matrix and relative errors (box below) for55Mn (n, α).
4 Summary and Outlook
A systematic generation of prior cross sections and covari-ance matrices for 276 isotopes relevant for structural mate-rials has been performed. This prior knowledge can be em-ployed as a fair starting point for future evaluations and re-duces them effectively to the analysis of experimental data. The priors contain nine frequently measured channels and cover the energy range from 1 to 150 MeV. The priors are supplied in ENDF-6 format, providing MF=3 and MF=33 files. Additionally a MF=1 file is supplied with general information regarding the specific isotope. The local and global optical potential parameters of [5] and the default parameters implemented in TALYS1.0 and TALYS1.2 [4] were employed to calculate the prior cross sections. The prior covariance matrices contain contributions from pa-rameter uncertainties and model deficiencies. In order to estimate the former, parameter boundaries for all impor-tant parameters were carefully determined for each isotope in global studies. As examples we described the determi-nation of boundaries for two parameters, one on the basis of physics arguments and one by empirical considerations. For the estimation of the model deficiencies, the scaling procedure of [1, 2] was employed and a wealth of experi-mental data throughout the periodic table was selected.
In order to show the feasibility of the library, a first ’blind’ evaluation with a55Mn local and global TALYS1.0 prior of this library was performed. It corresponds well to an evaluation undertaken with the prior of [10] which was specifically established for this isotope. For all evaluations, the same experimental data were included and the same statistical method was employed. This indicates that the generated priors might provide a reasonable starting point for evaluations. However, further tests are still required.
At the moment, all necessary data are calculated and the assembly of the library is in progress. Investigations are undertaken to include further ENDF-6 files necessary for evaluators, e.g. MF=2 and MF=4 files. By end of June 2012, the testing and correcting phase will be finished and afterwards, the library will be available on the webpage www.geneus.eu.
results presented have been achieved in part using the Vienna Sci-entific Cluster (VSC).
References
1. H. Leeb, D. Neudecker, Th. Srdinko, Nucl. Data Sheets
109, (2008) 2762
2. H. Leeb, St. Gundacker, D. Neudecker, Th. Srdinko, V. Wildpaner,Proceedings of Final Scientific EFNUDAT Workshop (Cern, Geneva 2010) 55
3. A. Trkov, R. Capote, E.Sh. Soukhovitskii, L.C. Leal, I. Kodeli, D.W. Muir, Nucl. Data Sheets 112 No. 12, (2011) 3098
4. A.J. Koning, S. Hilaire, M.C. Duijvestijn,Proceedings of the International Conference on Nuclear Data for Sci-ence and Technology( EDP Sciences, Nice 2008) 211 5. A.J. Koning, J.P. Delaroche, Nucl. Phys. A713, (2003)
231
6. IAEA Nuclear Data Section,EXFOR Formats Descrip-tion for Users(IAEA-NDS-206, Vienna 2008)
7. H. Leeb, St. Gundacker, D. Neudecker, Th. Srdinko, V. Wildpaner, J. Korean Phys. Soc.59No. 2, (2011) 959 8. D. Neudecker, St. Gundacker, Th. Srdinko, V. Wild-paner, H. Leeb, Proceedings of Final Scientific EFNUDAT Workshop (Cern, Geneva 2010) 49
9. I. Angeli, Table of nuclear root mean square charge radii(INDC(HUN)-033, Hungary 1999)
10. V. Wildpaner, D. Neudecker, Th. Srdinko, H. Leeb, (these proceedings)