A STUDY ON RELATIONSHIP BETWEEN SAFETY
AND QUALITY PERFORMANCE IN FOUNDATION
J. Immanuel Johnson
1, Dr. S. Arulselvan
2 1PG Scholar, Coimbatore Institute of Technology, (India)
2Associate Professor, Coimbatore Institute of Technology, (India)
ABSTRACT
A model for relating the safety and quality performance in foundation is proposed in this paper. The project aims
to study about the relationship between safety and quality performance in foundation by discussing few case
studies and field data. The scope of the project is to 1. Identify the reasons for lack of quality in foundation 2.
Justify the reasons by case studies 3. Obtain field data from different projects 4. Analyze the data and propose a
model to show the relationship between safety and quality in foundation. The study concluded that safety in
foundation can be improved by good quality foundation practice which is explained in the paper.
Keywords- Foundation Safety And Quality- Model- Reasons For Lack Of Quality- Code Provision-
Field Study.
I.
INTRODUCTION
Construction is one of the largest industries in the world subjected to many risks. Unfortunately many fatal
accidents in the construction industry are caused due to failure in foundation. During the last few years, with major
infrastructure development there is no proper study of safety and quality in the construction projects particularly in
foundations. Neither owner nor worker or contractor care about safety on job sites. It was noticed that accident
rates have increased in the past few years due to lack of safety and quality procedures particularly in foundation.
Many organizations in developed countries have realized that the key to achieve project success is by providing
good safety & quality. But still most of the construction projects in India are not practicing it.
II.
CASE
STUDIES
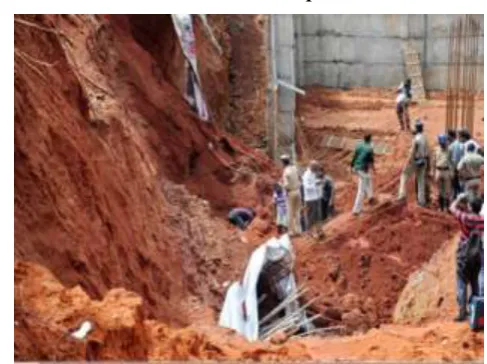
2.1 Visakhapatnam accident- The Hindu dated 18
thSep’2014
A 40 foot retaining wall collapsed due to no shoring or timbering for the excavation and did not remove the
excavated soil from site instead stored near the excavation which added the soil pressure increase and caused
failure.
2.2 Delhi accident- The Hindu dated 29
thJune’2014
A four storey existing building collapsed due to the excavation for new foundation in the adjacent land which
weakened the foundation of the existing building leading to the failure.
Figure 2. Ten Killed In Collapse
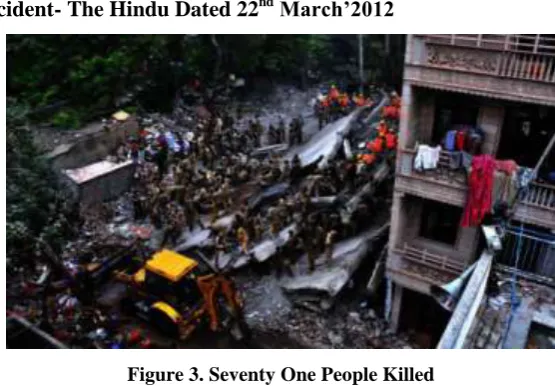
2.3 Lalitapark Accident- The Hindu Dated 22
ndMarch’2012
Figure 3. Seventy One People Killed
A 15 year old three storey building, over which two new floors were constructed. The foundation had been
weakened by the water damage from recent flooding. Hence the foundation could not bear the load of two new
floors causing failure.
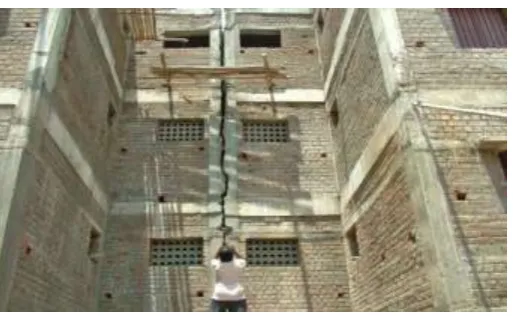
2.4 Ammankulam Settlement- The Hindu Dated 20
thApr’2010
The building is constructed in clay soil. Initial soil test result proved that it is unfit for construction. Still the project
was carried out and a differential settlement up to 50cm was observed in one building and 25cm direct settlement in
Figure 4. Crack in Expansion Joint Due To Settlement
III.
CODE
PROVISIONS
IS 3764-1992 mentions that all trenches in soil more than 1.5 m deep shall be securely shored and timbered. All
trenches in friable or unstable rock exceeding 2 m in depth shall be securely shored and timbered. No excavation or
earthwork below the level of any foundation of building or structure shall be commenced or continued unless
adequate steps are taken to prevent danger to any person employed, from collapse of the structure or fall of any part
thereof. Foundations, adjacent to and below which excavation is to be made, shall be supported by shoring, bracing
or underpinning as long as the trench remains open.
As per IS 2950-1981 for satisfactory design and construction of foundation the possible effects of the new structure
on the existing structures in the neighborhood is necessary.
IS 1080-1985 suggests for pad and strip foundation if the allowable bearing capacity is available only at a greater
depth, the foundation can be rested at a higher level for economic considerations and the difference in level
between the base of foundation and the depth at which the allowable bearing capacity occurs can be filled up with
either:(a) concrete of allowable compressive strength not less that the allowable bearing pressure, or (b) in
compressible fill material.
According to IS 1904-1986 increase in moisture extent results in substantial loss of bearing capacity in case of
certain types of soils which may lead to differential settlements. On sites liable to be water logged in wet weather,
it is desirable to determine the contour of the water-table surface in order to indicate the directions of the natural
drainage and to obtain the basis of the design of intercepting drains to prevent the influx of ground water into the
site. It is necessary in clay soils, either to place the foundation bearing at such a depth where the effects of seasonal
changes are not important or to make the foundation capable of eliminating the undesirable effects due to relative
movement by providing flexible type of construction or rigid foundations. Some clayey soils are susceptible to
shrinkage and cracking in dry and hot weather, and swelling in wet weather. Shrinkage of clay soils may be
increased by the drying effect produced by nearby trees and shrubs. Swelling may occur, if they are cut down. No
trees which grow to a large size shall be planted with in 8 m of foundations of buildings
As per IS3764-1992 workers shall be instructed to use safety devices and appliances provided to them whenever it
is necessary to do so. Workers who are not aware of the hazards peculiar to the work shall not be permitted to
proceed with the work without being properly instructed. They should preferably be under the close watch of a
properly qualified person whose instructions shall be obeyed by these workers. In case any worker feels that he
Safety helmets shall be worn by all persons entering trench where hazards from falling stones, timber or other
materials exist. Appropriate safety footwear (rubber boots, protective covers, etc.) shall be worn by workers.
IV.
STUDY
AT
SITE
The code provision for safe construction practice for foundation is not followed by many construction sites visited
which lead to rework (poor quality) and accidents. The relationship between the rework and the accidents is studied
from the field data which represents the quality and safety performance of foundation in the site. Data were
collected from 20 construction projects. The construction work was in progress in all these projects and most of
which were at foundation level. Hence the data will be more reliable to study. The project managers from these
projects were asked to share their opinions regarding the performance of the case project and the information about
the same. The following demographic data were obtained from each project: location, scope (in INR),
worker-hours accumulated, type of project, and whether the labor force is open or union shop labor. In addition the
author requested data about project performance, like the number of first-aid injuries, number of OSHA recordable
injuries, number of defects, cost of rework, and number of worker-hours spent on rework. All data were ultimately
obtained from project managers on active projects and the unit of analysis was the project. Although 20 projects
provided data for the study, some could not provide safety and quality data for all measures. After eliminating
projects that did not report either safety or quality data, there were 13 remaining data points.
4.1 Safety Performance
When collecting and analyzing safety performance data, the author adopted the Occupational Safety and Health
Administration’s definitions of recordable and first-aid injuries to ensure consistent metrics. The OSHA recordable
injuries are defined as any injury that results in death, days away from work, restricted work or transfer to another
job, medical treatment beyond first aid, or loss of consciousness. First aid injuries, on the other hand, are those
injuries that require one-time treatment and subsequent observation of minor injuries such as cleaning wounds on
the skin surface; applying bandages; flushing an eye; or drinking fluids to relieve heat stress.
The following are the two safety measures:
• INJ1—OSHA recordable injury rate (OSHA recordable injuries per 200,000 worker-hours); and • INJ2—First-aid injury rate (First-aid injuries per 200,000 worker-hours).
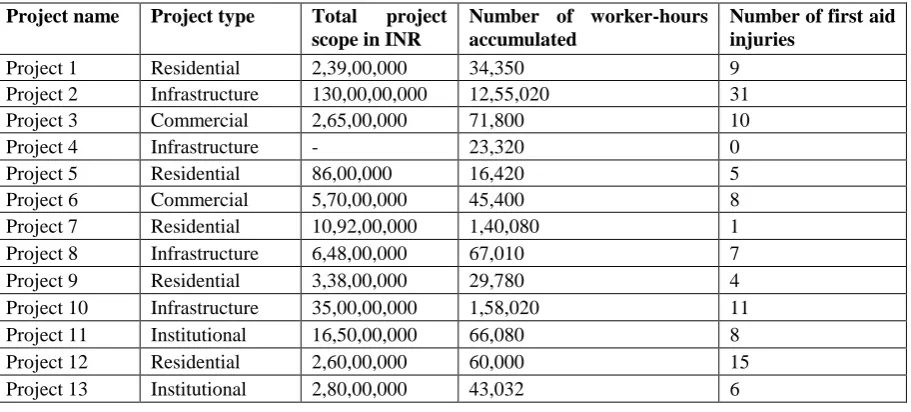
Table 1. Summary of Project Demographies
Project name Project type Total project scope in INR
Number of worker-hours accumulated
Number of first aid injuries
Project 1 Residential 2,39,00,000 34,350 9
Project 2 Infrastructure 130,00,00,000 12,55,020 31
Project 3 Commercial 2,65,00,000 71,800 10
Project 4 Infrastructure - 23,320 0
Project 5 Residential 86,00,000 16,420 5
Project 6 Commercial 5,70,00,000 45,400 8
Project 7 Residential 10,92,00,000 1,40,080 1
Project 8 Infrastructure 6,48,00,000 67,010 7
Project 9 Residential 3,38,00,000 29,780 4
Project 10 Infrastructure 35,00,00,000 1,58,020 11
Project 11 Institutional 16,50,00,000 66,080 8
Project 12 Residential 2,60,00,000 60,000 15
4.2 Quality Performance
Information about the total cost of rework, and the total hours related to rework was requested. The author was able
to obtain complete rework data from 13 projects. The project managers reported data on the total cost of rework,
which ranged from 28,000rs to 15,45,000rs. Finally, for 13 projects, the number of worker hours related to rework
was obtained, ranging from 8 to 4,800 h. All of these values were converted to rates using the project scope and
total number of worker hours accumulated as the denominators.
The following four quality measures were developed:
• Q1—Cost of rework per Rs,1crore project scope completed; • Q2—Cost of rework per 200,000 worker hours;
• Q3—Number of worker hours spent on rework per Rs,1crore project scope completed; and • Q4—Number of worker hours related to rework per 200,000worker hours.
Table 2. Summary of Quality and Safety Performance
Project name
Number of OSHA recordable injuries
Total direct and indirect cost of rework in INR
Number of worker-hours related to rework
Project 1 1 1,35,000 220
Project 2 5 15,45,000 4,800
Project 3 2 2,42,500 350
Project 4 0 - -
Project 5 0 50,000 -
Project 6 0 1,98,000 320
Project 7 0 - -
Project 8 1 1,54,500 384
Project 9 3 72,500 40
Project 10 4 2,38,000 740
Project 11 2 3,26,000 620
Project 12 1 28,000 8
Project 13 3 - -
Table 3. Safety and Quality Metrics Data (Rate)
INJ 1 INJ 2 Q1 Q2 Q3 Q4
6 52 56485 786026 92 1281
1 5 11885 246211 37 765
6 28 91509 675487 132 975
0 0 0 0 0 0
0 61 58140 609013 0 0
0 35 34737 872247 56 1410
0 1 0 0 0 0
3 21 23843 461125 59 1146
20 27 21450 486904 12 269
5 14 6800 301228 21 937
6 24 50154 986683 95 1877
3 50 10769 93333 3 27
The data obtained from site were converted into metrics data for easy comparison and analysis of the same which
is shown in table.3. The following procedure is used to convert the data into rates.
Injury rate = number of injuries x 200,000 / total working hours
Q1 = total cost of rework x 1,00,00,000 / total scope of work (in rupees)
Q2 = total cost of rework x 200,000 / total working hours (in rupees)
Q3 = total working hours related to rework x 1,00,00,000 / total scope of work (in hours)
Q4 = total working hours related to rework x 200,000 / total working hours (in hours)
4.3 Hypothesis Development
Although a number of safety and quality measures are examined, these variables only measure two concepts. Both
INJ1 and INJ2 examine safety from the perspective of worker injuries of varying severity. On the other hand the
quality measure was deemed relevant to rework and it is evaluated by Q1, Q2, Q3 and Q4. With this the
fundamental hypothesis was developed:
• H0: There is a relationship between rework and safety.
This hypothesis has been restated as null and alternative hypothesis in Table 4 along with their independent and
dependent variables.
Table 4. Summary of Hypothesis Development
Hypothesis Null hypothesis Alternative hypothesis Dependent variables Independent variables
H0
There is no relation
between rework and
safety
There is a relation
between rework and
safety
Q1, Q2, Q3, Q4 INJ1, INJ2
V.
RESULTS
As previously indicated, the primary objective was to test the hypothesis that there is no relationship between
quality performance and safety performance. The empirical data was tested for correlations between the two safety
performance metrics and four quality performance metrics.
Simple linear regressions were performed among the combinations of safety and quality metrics using quality
metrics as predictors for the safety performance metrics. The coefficient of determination (r2), which provides the
strength of the linear correlation, was calculated. This measures the proportion of variance in one metric that is
explained by the variation in the other metric, given a linear relationship. It was considered that coefficient of
determination values greater than 0.50 were significant because the mathematical model explains over half of the
variability in the response variable. At last, the associated p-values in the correlation analysis were calculated.
Table 5 shows the results of the analysis performed.
Keeping with scientific convention, the null hypothesis for each comparison was that there was no relationship
between the predictor and response variables. Mathematically, no relationship would mean that the Pearson-r is
equal to zero. The author selected an alpha of 0.05, to give a standard 95% confidence interval, and performed a
two tailed test. The analysis results with any p-values less than 0.05 would result in rejection of the null hypothesis
Table 5. Summary of Emprical Data Analysis
Comparison Coefficient of Determination (r2)
p-Value (α=0.05)
INJ 1 versus Q1 .216 .673
INJ 1 versus Q2 .576 .023
INJ 1 versus Q3 .213 .171
INJ 1 versus Q4 .544 .009
INJ 2 versus Q1 .227 .195
INJ 2 versus Q2 .240 .411
INJ 2 versus Q3 .543 .019
INJ 2 versus Q4 .507 .030
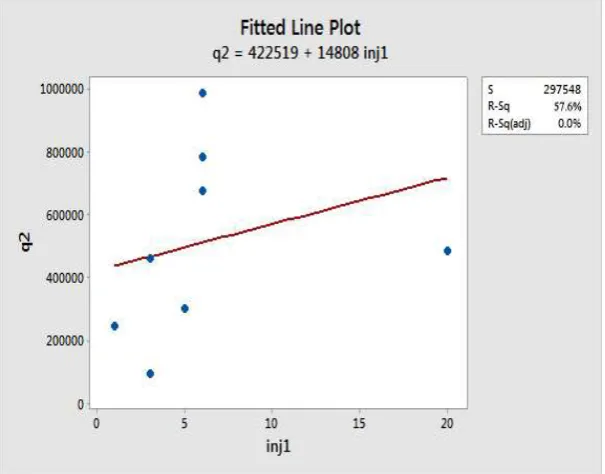
5.1 Relationship 1: INJ1 versus Q2
A positive linear relationship was found, with an r2 value of 0.576, between the recordable injury rate per 200,000
worker hours (INJ1) and the cost of rework per 200,000 worker hours (Q2). This can be observed in Fig. 5. This
means a very strong positive relationship exists. As the number of rework hours increases, the recordable injury
rate linearly increases. Further, the associated p-value is 0.023, so the null hypothesis was rejected. The sample size
used to make this inference was small and hence the data should be considered suggestive rather than conclusive.
Figure 5. The recordable injury rate per 200,000 worker hours (INJ1) versus the cost of rework per 200,000 worker hours (Q2)
5.2 Relationship 2: INJ1 versus Q4
Next the relationship between the recordable injury rate per 200,000 worker-hours (INJ1) and the number of
worker hours related to rework per 200,000 worker hours (Q4) was studied. The resulting r2 value is 0.544
indicating a relationship, as shown in Fig. 6. Because the p-value is 0.009, the null hypothesis was rejected. Even,
this is the same conclusion reached in the previous relationship. In addition, because of the sample size limitation,
Figure 6. Between the recordable injury rate per 200,000 worker-hours (INJ1) versus the number of worker hours related to rework per 200,000 worker hours (Q4)
5.3 Relationship 3: INJ2 versus Q1
In the correlation shown in Fig. 3, a positive relationship was found between the first-aid rate per 200,000
worker-hours (INJ2) and the cost of rework per Rs,1crore project scope completed (Q1). The r2 value of 0.543
represents a strong relationship between these two metrics, meaning as the number of defects on a project
increases, the number of first-aid injuries also increases, as depicted in Fig. 7. The associated p-value 0.019 led to
a rejection of the null hypothesis.
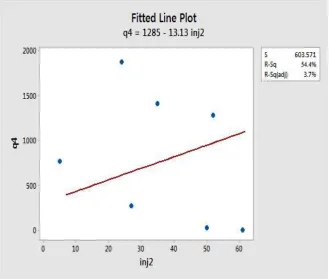
5.4 Relationship 4: INJ2 versus Q4
The final realized relationship shown in Fig. 4 is similar to the previous in that a positive correlation exists between
first-aid rate per 200,000 worker-hours (INJ2) and the number of worker hours related to rework per 200,000
worker hours (Q4). Again, this infers that, as the number of defects increases on a project, the first-aid rate
increases as well. The r2 value of 0.507 indicates that a strong relationship exists, and the p-value .030 led to
rejection of the null hypothesis.
Figure 8. The first-aid rate per 200,000 worker-hours (INJ2) versus the number of worker hours related to rework per 200,000 worker hours (Q4).
On the basis of the empirical data analysis, it is evident that there is a relationship between construction safety
performance and construction quality in foundation. The analysis returned four statistically significant
relationships with p-values less than 0.05 that warranted the relationship between safety and quality in foundation.
The following inference is made from the empirical data analysis.
Inference: The injury rate is positively correlated to rework, i.e. the construction quality performance improves
with good safety practices in foundation.
VI.
DISCUSSION
Safety and quality in the foundation construction are not separated from each other. The similarity and integration
between will make the management process more effective. Fig. 9 represents how the relationship between safety
and quality management of foundation can be integrated at construction field. The basic model shown in the Fig. 9
Figure 9. Proposed Safety and Quality Model
The similarity between the safety and quality management in foundation construction could be summarized in flow
of management levels into four levels as follows in Table 6.
Table 6. Similarities between Safety and Quality Management Process in Foundation
Safety Management Quality Management
Level one Policy and Objectives Policy and strategy
Level two Organization People management
Resources
Level three Practices and Procedures
Implementation and Compliance
Assessment
Processes
Level four Management review Field test
6.1 Level One
The important similarity of safety and quality in foundation is the fact that the implementation of both should begin
by drawing up of a policy statement. At safety management it is policy and objectives, they call it policy and
strategy at quality management. Integration of safety and quality management in foundation systems should be
improved in the construction industry in order to develop a strategic approach at tackling problems. The model
should start by setting up a policy and objectives that integrates both safety and quality in one pattern. Such policy
will draw all necessary steps required for the good management implementation process.
6.2 Level Two
The organization of safety constitutes the top management, safety engineers, workers and other parties related to
safety in a project. The organization should be formed with knowledgeable personnel who exhibit characteristics
components of quality management. The resources for project should be checked for safety in additional to quality.
Similarly in people management the personnel must be allotted work in such a way that he does with maximum
quality and safety. Training for both safety and quality in foundation construction must be given.
6.3 Level Three
Implementation and compliance of safety procedures and practices are inherent characteristics of good safety
management. Compliance with local safety regulations and documenting incompliance penalties in contract forms.
Verification and assessment processes are important for ensuring safety in foundation. Through assessment of
accident reports, causes and consequences of safety violations are investigated and the method for removing
hazards can be uncovered through investigation by safety engineer who is located at workplace. All these should be
made standardized before the work commences by the safety department and these should be checked and
processed continuously during the execution of project to achieve good quality and maximum safety.
6.4 Level Four
Management review of safety reports and accident reports of foundation accidents is necessary for the correction
actions of safety procedures. The standardized assessment process and implementation procedure for execution of
foundation works must be reviewed by the top management. Soil tests choosing the type of foundation must be as
per the safety regulation which helps to achieve good quality. During and after execution continuous field tests are
necessary to ensure the correct execution of work.
VII.
RECOMMENDATION
The recommendation addresses the remedial action to solve the problem. Government should strengthen its
legislation through the legislative council acts and clauses that would impose fines and penalties on institutions and
companies which violate safety regulations. Develop more practical and effective safety policies which mainly
address clear safety regulations and clauses. Effective construction techniques for foundation and excavation
should ensure providing a safe place to work, a work environment conducive to safe work practices.
REFERENCES
[1] Al Abo Omar, E. and Mangin, J. C., 2002, A new cost control model and indicators to measure productivity on
building sites, Construction Innovation, Vol. 2, pp. 83 – 101.
[2] Arditi, D., and Gunaydin, M., 1997, Total quality management in the construction process, International
Journal of Project Management Vol. 15, No. 4, pp. 235-243.
[3] Baines, A., 1997, Productivity Improvement, Work Study Journal, Vol. 46, No. 2, pp.49–51.
[4] Bureau of Indian Standards, IS 3764-1992, IS 1904-1986, IS 1080-1985, IS 2950-1981.
[5] Enshassi, A., 2003, Factors Affecting Safety on Projects Construction, CIB Working Commission W99,
Brazil.
[6] Hammarlund, Y., and Josephson, P.-E., 1991, Sources of quality failuresin building, Proc., European Symp.
on Management, Quality and Economics in Housing and other Building Sectors, Wiley, Lisbon, Portugal,
[7] Love, P. E. D., and Li, H., 2000, Quantifying the causes and costs of rework in construction, Constr. Manage.
Econ., pp.479–490.
[8] Mohamed, S., 2002, Safety climate in construction site environments, J. Constr. Eng. Manage., 128(5),
pp.375–384.
[9] Pheng, L. S., and Shiua, S. C., 2000, The maintenance of construction safety: riding on ISO 9000 quality
management systems, Journal of Quality Management and Engineering., vol.6, No. 2, pp. 28–44.
[10]Sun, M., and Meng, X., 2009, Taxonomy for change causes and effects in construction projects,