IJEDR1602031
International Journal of Engineering Development and Research (www.ijedr.org)182
Experimental Analysis of Heated Horizontal
Rectangular Fin Array (HRFA) Under Forced
Dominating Mode of Mixed Convection (FCDMM)
Shardul kulkarni , Prof.H.N.Deshpande, Prof.S.Y.Bhosale 1Research scholar, 2 Asst professor 3 Head of department & Asst professor
Department of mechanical engineering PES‟s MCOE Shivaji nagar, Pune -411005
________________________________________________________________________________________________________
Abstract - Present study represents experimental analysis of heated horizontal rectangular fin array (HRFA) under forced dominating mode of mixed convection (FCDMM). In experimental study heat transfer characteristics are investigated for fin with L/H=5; the effect of various parameters such as fin spacing, heater input and flow velocity on average heat transfer coefficient (ha),base heat transfer coefficient (hb) studied. The dimensionless number analysis such as Nusselt number, Reynolds number (Re), Grashoff number (Gr), Richardson number (Ri) is also presented. Different heat transfer characteristics such as ha, hb are determined and compared with experimental and numerical results of plain horizontal rectangular fin arrays (HRFA). In comparison it is observed that for modified fin geometry average heat transfer coefficients (ha) increased by 17%.
Index Terms-heat transfer, fin array ,mixed convection.
________________________________________________________________________________________________________
INTRODUCTION
Fin arrays on horizontal and vertical surfaces are used in variety of engineering applications to dissipate heat to the surroundings. Needs for buoyancy driven ventilation appear in a variety of engineering applications. However, with the fins the fluid flow rate is reduced. Hence, if not properly designed it is possible that no improvement is achieved in terms of overall heat transfer. Therefore, only if the fins are properly designed, they are very attractive for the applications since they offer an economical, trouble-free solution to the problem. A designer must minimize the thermal resistance between the source of heat dissipation and the thermal sink which is essential in controlling maximum operating temperatures and consequently the long term reliability and performance of electronic components. The relationship is given in an increase in either the heat transfer coefficient or the surface area for heat transfer results in a reduction in the film resistance. The heat dissipation from fins under natural convection condition depends on the geometry and orientation of finned surface. Different types of fins ware used to increase the heat transfer rate. Fins are used on plane surfaces or cylindrical surfaces. Fins may be of having different cross sections. Depending on cross section we may have rectangular, parabolic or triangular fins. The heat can be removed effectively if the fluid flow and the resulting flow pattern are capable of removing the heat efficiently. Situations where both pressure forces and buoyant forces interact. How much each form of convection contributes to the heat transfer is largely determined by the flow, temperature, geometry, and orientation. The ratio Gr/Re2 known as Richardson number (Ri), which gives a qualitative indication of the
influence of buoyancy on forced convection. Mixed convection is fundamentally significant heat transfer mechanism that is present in many industrial and technological applications. In cases where Ri is close to 0.1 or less than 0.1 a condition occurs where a forced convection dominates in mixed convection which is a case of Forced Convection Dominating Mode Of Mixed Convection. (FCDMM). In such conditions effects of pure forced convections are yet to obtain.
LITERATURE REVIEW
Sane et al [1] investigated the problem of horizontal fin array for the single chimney flow pattern; and down and up flow pattern. They solved the governing equations neglecting the velocity component normal to the fin flats in the case of single chimney. Acharya et al [3] presented some experimental results on the mixed convection heat transfer with longitudinal fins in a horizontal parallel plate channel. The effect on Nu number was most pronounced for smaller fin heights. Therefore, extended surfaces were
used to enhance mixed convection heat transfer.
Incropera et al. [4] mixed convection flow and heat transfer in the entry region of a horizontal rectangular duct was investigated to resolve some of the conflicting trends concerning laminar mixed convection in a horizontal rectangular duct. Shete [8] carried out experimental and numerical study on combined convection heat transfer from vertical rectangular fin arrays. Results are generated in the form of variation in ha, hb, Nua and Nub.
H. N. Deshpande, et al [9] carried out experimental study for perforated horizontal rectangular fin arrays for Ri number less than 0.1.It is found that increasing trend of h
a with increase in fin spacing is sharp up to spacing that about 6 and 8 mm after which hais
gradually decreases for all velocities and all heater input.
Taji.S.G. et al. [11] experimentally and numerically investigated the horizontal rectangular fin array by varying fin spacing and keeping length, height same for different heater inputs and different flow velocities in assisting mode of mixed convection as possibility of performance enhancement.
EXPERIMENTATION
IJEDR1602031
International Journal of Engineering Development and Research (www.ijedr.org)183
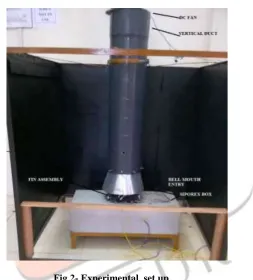
The length and height of fin flats used is kept constant(L=200,H=40). The insulating siporex block was used to reduce the leakage of heat from bottom and sides of the fin array. However the side and bottom heat losses were measured and accounted for conduction losses.Fig 1- schematic diagrams of fin array assembled
Fig 2- Experimental set up
IJEDR1602031
International Journal of Engineering Development and Research (www.ijedr.org)184
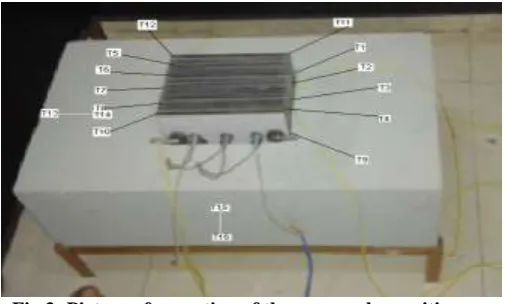
Fig 3.-Picture of mounting of thermocouples positionsTable 1 Details of parameters for experimentation
Set no Fin Spacing [S] (mm) No. of fins [N] No. of channels Air Velocity [V] (m/s) Heater Input [q] (W)
1 2 25 24 0.85
0.95 1.05 1.15 1.25
25 50 75
2 4 17 16
3 6 13 12
4 8 11 10
5 10 9 8
6 12 8 7
RESULTS & DISCUSSIONS
A. Effect of Fin Spacing On ha
Heat transfer coefficient or film coefficient, in thermodynamics and in mechanics is the proportionality constant between the heat flux and the thermodynamic driving force for the flow of heat (i.e., the temperature difference, ΔT). ha is average heat transfer
coefficient which can be calculated by ha =
𝑄𝑐𝑜𝑛𝑣
𝐴𝑒x ∆T
where Q conv = rate of heat loss due to convection . W
Ae = Total exposed area m2
ΔT= difference in temperature between the solid surface and surrounding fluid area, K.
a) Variation of ha with fin spacing 'S' for 25w input 5
7 9 11 13 15 17 19 21 23
2 4 6 8 10 12
ha
(w
/m
2k)
s (mm)
IJEDR1602031
International Journal of Engineering Development and Research (www.ijedr.org)185
b) Variation of ha with fin spacing 'S' for 50 inputFig. 4 -Variation of ha with fin spacing 'S'
Figure 4 Shows the effect of fin spacing on ha with 25W heater input. As the fin spacing increases the ha increases. For 25W
heater input the highest value of ha is around 20 W/m2 K at the spacing of 8 mm. The increasing trend is steep up to spacing about
8 mm. after which there is a gradual decrease. Similarly for 50W heater input ha increases with fin spacing S and attains
maximum value 20.8 w/m2 for spacing 6 mm
B. Effect of Fin Spacing On hb
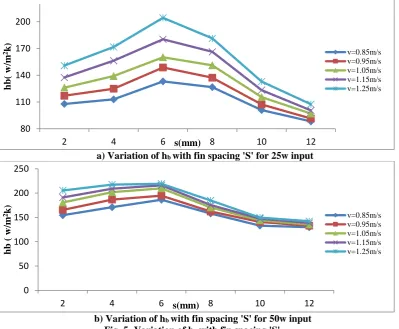
Figure 5 shows the effect of fin spacing on hb.. for different heater input. hb. is base heat transfer coefficient which can be
calculated
hb=
𝑄𝑐𝑜𝑛𝑣
𝐴𝑏 x ∆T where Q conv = rate of heat loss due to convection . W
Ab = base area m2
ΔT= difference in temperature between the solid surface and surrounding fluid area, K
Figure 5 Shows the effect of fin spacing on hb with 25W heater input. As the fin spacing increases the hb increases. For 25W
heater input the highest value of hb is around 200 W/m2 K at the spacing of 6 mm. The increasing trend is steep up to spacing
about 6 mm. after which there is a sharp decrease. Similarly for 50W heater input hb increases with fin spacing S and attains
maximum value 220 w/m2 for spacing 6 mm.
a) Variation of hb with fin spacing 'S' for 25w input
b) Variation of hb with fin spacing 'S' for 50w input Fig. 5 -Variation of hb with fin spacing 'S' C. Effect of Fin Spacing On Nua
5 7 9 11 13 15 17 19 21 23
2 4 6 8 10 12
ha
(w
/m
2k)
s(mm
v=0.85m/s v=0.95m/s v=1.05m/s v=1.15m/s v=1.25m/s
80 110 140 170 200
2 4 6 8 10 12
hb
(
w
/m
2k)
s(mm)
v=0.85m/s v=0.95m/s v=1.05m/s v=1.15m/s v=1.25m/s
0 50 100 150 200 250
2 4 6 8 10 12
hb
(
w
/m
2k)
s(mm)
IJEDR1602031
International Journal of Engineering Development and Research (www.ijedr.org)186
Nusselt number (Nu) is a dimensionless parameter indicative of the ratio of heat transfer by convection to conduction across a fluid layer. It is a coefficient indicating the rate at which geometry transfer heat. Average Nusselt number (Nua) is the mean ofLocal Nusselt numbers over the entire heat transfer surface. Therefore, its value depends on the geometry or surface of heat transfer. The type of the flow regime or region is not a constraint for the use of average Nusselt number as heat transfer coefficient. It can be used to estimate the heat transfer at the entrance region as well as in a fully developed region. Fully developed Nusselt number is only for the fully developed region. It is an average Nusselt number estimated when the flow is fully developed. The Nusselt number is a constant throughout the region, but its value depends on the surface thermal condition
Average nusselt no can be calculated by Nua =
ℎ𝑎 x H
𝑘
where ha = average heat transfer coefficient W/m2
H = characteristic length m
k = Thermal conductivity at mean film temperature W/m K
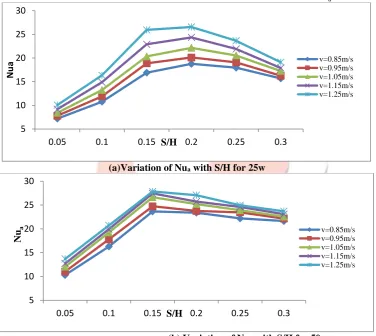
It is observed from Fig 6 shows that with increase in the S/H ratio, Nu
a increases up to maximum value at S/H (S= 6 mm and
H = 40 mm) = 0.15 for heater inputs 25W and 50W then Nu
a decreases with increase in S/H up to 0.3. The increasing trend of Nua
is sharp up to S/H that about 0.15 and 0.2 for all velocities and heater inputs after which Nu
a is gradually decreased. It is also
cleared from the graph that for same S/H with increase in flow velocity from 0.95 to 1.25 m/s the Nu
a also increases.
(a)Variation of Nua with S/H for 25w
(b) Variation of Nua with S/H for 50w Fig 6-Variation of Nua with S/H
D. Effect of Fin Spacing On Nub
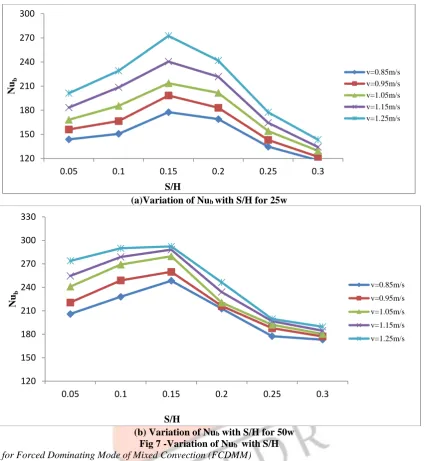
Figure 7 shows variation of base Nusselt number with fin spacing. It is clear that as the value of Nub increases as fin spacing
increases. It reaches to its maximum value and again decreases. The reason for decrement in Nub may be due to the chocking of
fluid flow at smaller spacing. Optimum fin spacing is decided by the highest value of base Nusselt number. It is observed that the optimum fin spacing for the two arrays is in a band of 6 to 8 mm. The Nu
b (Fig) increases up to maximum value of S/H = 0.15 and
then with S/H up to 0.30 Nu
b decreases drastically. The increasing trend of Nub is sharp up to S/H that about 0.15 and 0.2 after
which Nu
b is gradually decreases for all velocities and heater inputs. It is also cleared from the graph that for same S/H as flow
velocity increases from 0.95 to 1.25 m/s Nu
b also increases.
5 10 15 20 25 30
0.05 0.1 0.15 0.2 0.25 0.3
N
u
a
S/H
v=0.85m/s v=0.95m/s v=1.05m/s v=1.15m/s v=1.25m/s
5 10 15 20 25 30
0.05 0.1 0.15 0.2 0.25 0.3
Nu
a
S/H
IJEDR1602031
International Journal of Engineering Development and Research (www.ijedr.org)187
(a)Variation of Nub with S/H for 25w(b) Variation of Nub with S/H for 50w Fig 7 -Variation of Nub with S/H EValidation for Forced Dominating Mode of Mixed Convection (FCDMM)
For a given fluid, it is observed that the parameter Gr/Re2 represents the importance of natural convection relative to forced convection. This is not surprising since the convection heat transfer coefficient is a strong function of the Reynolds number Re in forced convection and the Grashof number Gr in natural convection. A plot of the non dimensionalised heat transfer coefficient for combined natural and forced convection on a vertical plate is given in Fig. 8 for different fin spacing corresponding plots are obtained for 50 W heater input.[10]
Fig 8- Validation with vertical plate under mixed convection.
CONCLUSION
The important findings of the experimentation are as follows: 120
150 180 210 240 270 300
0.05 0.1 0.15 0.2 0.25 0.3
Nu
b
S/H
v=0.85m/s v=0.95m/s v=1.05m/s v=1.15m/s v=1.25m/s
120 150 180 210 240 270 300 330
0.05 0.1 0.15 0.2 0.25 0.3
Nu
b
S/H
v=0.85m/s
v=0.95m/s
v=1.05m/s
v=1.15m/s
v=1.25m/s
0.0 0.1 0.2 0.3 0.4 0.5 0.6 0.7 0.8
0.005 0.010 0.015 0.020 0.025 0.030 0.035
Nu
a
/R
e
0.5
s=2 s=4 s=6 s=8 s=10 s=12
vertical plate
IJEDR1602031
International Journal of Engineering Development and Research (www.ijedr.org)188
1. Forced dominating mode of mixed convection can be validated by governing parameters like Gr/Re2,Nu/Re0.52. For 50W heater input ha increases with fin spacing S and attains maximum value 20.8 w/m2 for spacing 6 mm .for
heater input 75 W ha increases with fin spacing attains maximum value 22.97 w/m2for S=8mm.The increasing trend of
h
a is sharp up to spacing that about 6 and 8 mm after which ha is gradually decreases for all velocities and all heater
input. It can be summarized that for forced dominating mode of mixed convection optimum spacing is reduced to 6-8 mm as compared to natural convection.
3. As the fin spacing increases the hb increases. For 25W heater input the highest value of hb is around 200 W/m2 K at the
spacing of 6 mm. The increasing trend is steep up to spacing about 6 mm. after which there is a sharp decrease for all heater inputs.
4. With increase in the S/H ratio, Nu
a increases up to maximum value at S/H (S= 6 mm and H = 40 mm) = 0.15 for heater
inputs 25W and 50W then Nu
a decreases with increase in S/H up to 0.3. The increasing trend of Nua is sharp up to S/H
that about 0.15 and 0.2 for all velocities and heater inputs after which Nu
a is gradually decreased.
5. The average heat transfer coefficient has increased significantly at cost of very small energy input to the DC fan under forced dominating mode of mixed convection.
ACKNOWLEDGMENT
The author would like acknowledge to Dept of Mechanical engineering of PES’s “Modern college of engineering. Pune REFERENCES
[1] Starner K. E. and Mcmanus H. N.: ‘An experimental investigation of free convection heat transfer from rectangular fin arrays’, Journal of Heat Transfer, Trans ASME, series C,85, 273(1963).
[2] Sane N.K. and Sukhatme S.P., Natural convection heat transfer from horizontal rectangular fin arrays, in: Proc. Of 5th International Heat Transfer Conference, Tokyo, Japan, Vol. 3, NC3.7, pp. 114–118, 1974.
[3] S. Acharya, S.V. Patankar, Laminar mixed convection in a shrouded fin array ASME J. Heat Transfer 103 (1981) 559– 565.
[4] F.P. Incropera, Convection heat transfer in electronic equipment cooling, J. Heat Transfer 110 (1998) 1097–1111. [5] Patil J. D., Tikekar A. N. and Sane N. K.: ‘Three dimensional analysis of horizontal rectangular fin arrays under natural
convection’, 8th ISME Conference on Mechanical Engineering, IIT, Delhi. (March 1993).
[6] Jayanti Shete, Narayan K. SaneExperimental Investigation of Mixed Convection Heat Transfer from Heated Vertical Rectangular Fin Array international heat transfer conference
[7] S .D. Suryawanshi and N.K. Sane, “Natural convection heat transfer from horizontal rectangular inverted notch fin arrays”, ASME J. of Heat Transfer 131, 2009, pp. 1-6
[8] H. N. Deshpande,S. G. Taji Experimental Study of Heat Transfer from Horizontal Rectangular Fins with Perforations under Natural Convection International Journal of Engineering Research & Technology (IJERT) ISSN: 2278-0181 Vol. 3 Issue 2, February – 2014
[9] H. N. Deshpande, S.G. Taji Experimental Study of Heat Transfer from Perforated Horizontal Rectangular Fins for Richordson Number Less than 0.1 (IJEMR)ISSN (ONLINE): 2250-0758
[10] S.G. Taji, G.V. Paishwad, N.K. Sane Enhanced performance of horizontal rectangular fin array heat sink using assisting mode of mixed convection. International Journal of Heat and Mass Transfer 72 (2014) 250–259
[11] S.G.Taji, “Experimental and Numerical Study of Heated Horizontal Rectangular Fin Arrays under Mixed Convection”, Ph.D Thesis, University of Pune, India , 2014
[12] Holman J.P., Heat Transfer, Tata McGraw Hill, New Delhi, 2002.