Crystallization and Embrittlement Behavior of a Zr
55Al
10Ni
5Cu
30Metallic Glass Having Different Si and O Contents
Ichiro Seki, Dmitri V. Louzguine-Luzgin and Akihisa Inoue
Institute for Materials Research, Tohoku University, Sendai 980-8577, Japan
Metallic glasses as non-equilibrium materials crystallize at a critical temperature, accompanying their embrittlement. The size of glassy alloys is dependent on their glass-forming ability. The development of an appropriate joining technique is important for the extension of industrial applications. In the present study, we examine crystallization behavior of Zr55Al10Ni5Cu30 glassy alloy upon annealing. In the
beginning of the crystallization process, a clustering, a crystal nucleation and the crystal growth processes take place sequentially.
The phase transition behavior was examined by differential scanning calorimetry (DSC). The kinetics of the crystallization process can be analyzed by the changes in the volume fraction of the crystalline phase which scales with the exothermic heat release and density measurement. The crystallization process in the Zr55Al10Ni5Cu30alloy is found to be diffusion-controlled. The values of the Avrami exponent are between 2.3
and 2.8. Therefore, the velocity of nucleation and crystallization processes should scale with the diffusion velocity of the constituent elements in the metallic glass. The diffusion rate can be estimated using the diffusion coefficients of the constituent elements, as a function of time and temperature. The slope of the calculated iso-precipitation line of CuZr2phase on the fixed TTT diagram is well fitted with the lines representing
ductile and brittle behavior of the sample. The results indicate that the most harmful crystalline phase, which causes embrittlement is CuZr2. The
influence of Si contamination on the crystallization behavior is also studied in the present work. [doi:10.2320/matertrans.48.821]
(Received December 5, 2006; Accepted February 2, 2007; Published March 25, 2007)
Keywords: metallic glass, annealing, nucleation, clustering, crystallization, Avrami-number, diffusion control, embrittlement, transmission electron microscopy diffraction,-Zr, CuZr2
1. Introduction
Some metallic glassy alloys have high thermal stability, and good mechanical properties [u.s.c 2GPa (u.s.c: ultimate compressive strength)].1,2) However, when the glassy alloy is heated above the crystallization temperature, it crystallizes within a short period of time. The crystalliza-tion of the glassy alloy causes its embrittlement, and good mechanical properties of the glassy alloy are lost. Ordinary glassy alloys are known to be not suitable material for hot working, and joining by means of welding. The development of an appropriate joining technique for such non-equilibrium materials is important for the extension of their industrial applications.
The crystallization kinetics of Zr-Ni-Cu-Al metallic glassy alloys have been studied.3–5)Some of the parameters, like an activation energy for nucleation and growth can be found in the literature.6)A numerical analysis method using Avrami exponent, which was applied to the study of the crystalliza-tion behavior of the Zr-Al-Ni-Cu glassy alloy7–10)is known as one of the most widely used kinetic analysis methods. However, the detailed investigation of separate nucleation and growth processes has not been performed. Another well known method of analysis of the crystallization behavior is Kissinger’s analysis, which takes into account shift of the DSC peak temperature as a function of the heating rate. The crystallization behavior of Zr-Al-Ni-Cu glassy alloys has been also studied in a number of previous works by Kissinger analysis.11–13)
At the same time, insufficient attention has been paid to the effect of Si contamination in relation with the crystal growth velocity and the embrittlement phenomenon. In various alloys the crystallization process is diffusion control-led.4,5,9,12,13)Therefore, the detailed analysis of the diffusion process can be applied to the precipitation behavior.7)
The Zr55Al10Ni5Cu30 glassy alloy has a high GFA (glass
forming ability), and can be cast as an ingot with a diameter of 30 mm.14)The mechanical properties of this glassy alloy in relation with the crystallization process15,16) were also reported. However, the relationship among the structural changes, the crystallization and volume fraction change and embrittlement is not clear. In the present study, the crystallization behavior of the Zr55Al10Ni5Cu30 glassy alloy
containing a small amount of Si is examined at different temperatures and a simple calculation is performed using the diffusivity. The 1st exothermic DSC peak, which appears after the grass transition phenomenon in the Zr55Al10Ni5Cu30
glassy alloy, includes two shoulders at the constant heating. It was reposted that the influence of the contamination of Si within 6% for the Zr-Al-Ni-Cu glassy alloy does not modify its crystallization behavior.13) In the present study, the 1st-DSC peak of the glassy alloy separates with the additions of Si and oxygen, which raise the frequency factor for nucleation.
2. Experimental Procedure
2.1 Sample preparation
The Zr55Al10Ni5Cu30 alloy ingot was prepared by arc
melting a mixture of Zr, Al, Ni and Cu metals in argon atmosphere. The Zr55Al10Ni5Cu30 glassy ribbon and sheet
samples were prepared by conventional single roller melt spinning apparatus and twin roller apparatus in an argon atmosphere. The glassy alloy ribbon sample having 3 mm in width and 0.03 mm in thickness was produced by a single roller apparatus. On the other hand, the glassy alloy sample of 12 mm in width and 0.20 mm in thickness was prepared by a twin roller apparatus and used for thermal-analysis and the mechanical properties test using the bending test.17) The glassy alloy ribbon sample containing a small amount of Si
exhibits the separation of the DSC peaks compared with the sample of no containing Si during heating at a constant heating rate. On the other hand, the glassy alloy sheet sample used for the mechanical test does not contain Si as shown in Table 1. The analysis of the chemical composition of the samples was performed by absorptiometry for Si and He-gas fusion combustion-infrared absoptiometry for oxygen analy-sis.
2.2 Annealing of the samples
2 ways of the heat treatment were performed in the present study. The isothermal annealing above the glass transition temperature (Tg) and below the crystallization temperature (Tx) was performed by differential isothermal calorimetry (DIC). The glass transition temperature and the exothermic peak temperatures were measured by DSC at the constant-heating rate of 0.67 K/s.
On the other hand, the low-temperature annealing was preformed below the glass transition temperature in an evacuated quartz capsule.17)The precipitated phases in the annealed samples were investigated by X-ray diffractometry (XRD) and transmission electron microscopy (TEM).
3. Results
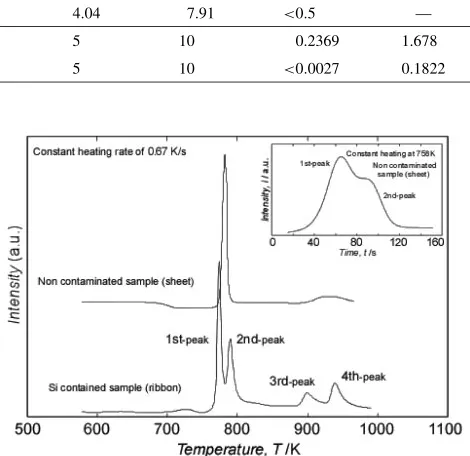
3.1 Crystallization of the Zr55Al10Ni5Cu30 glassy alloy Figure 1 shows DSC profiles of two samples of the Zr55Al10Ni5Cu30glassy alloy one containing Si and the other
[image:2.595.53.549.106.189.2]Si-free, heated at 0.67 K/s. A weak glass transition and four exothermic heat peaks can be observed in the DSC profile of the Si-containing sample. On the other hand, the DSC profile of the same glassy alloy shows less number of the exothermic peaks in the sheet sample references.14,15,17,18)The exother-mic peaks shift depending on the preparation conditions such as the presence of the contaminated elements and so on. The 1st and 2nd exothermic peaks are combined with each other. The separation of the 1st and 2nd peaks is also observed the Si-free sheet sample during the isothermal annealing at 758 K as shown in Fig. 1.
Figure 2 shows the XRD profiles of the Zr55Al10Ni5Cu30
glassy ribbon sample annealed at the constant temperature corresponding to certain exothermic peaks. The 1st exother-mic peak is responsible for the formation of a crystalline phase with the cubic (Al5Ni3Zr2/cF120) type structure. The
2nd to 4th exothermic peaks correspond to precipitation of -Zr/hP2, cubic (NiZr2/cF96) and CuZr2/tI6 phases,
respec-tively. Table 1 shows the measured concentration of the alloying elements like Zr, Cu, Ni, Al and contaminating
elements like Si and oxygen in the prepared Zr55Al10Ni5Cu30
glassy alloy samples. The cubic phase having cF120 Al5
-Ni3Zr2 type structure was found to be Zr-rich, and a trace
amount of the contaminating element Si was observed in this phase.
3.2 Avrami kinetic analysis
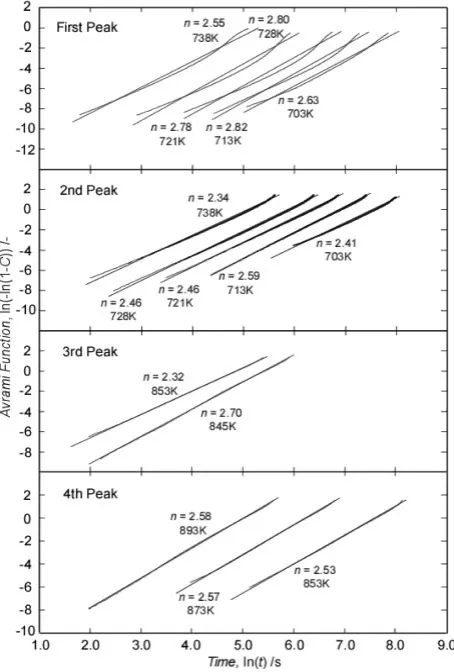
Figure 3 show the Avrami plot, which isln½lnð1CÞ versus lnðtÞfor the 1st to 4th exothermic peaks responsible for the precipitation of cubic (Al5Ni3Zr2), -Zr, cubic
[image:2.595.309.544.147.375.2](NiZr2) and CuZr2, respectively. The Avrami exponent n Table 1 The measured concentration of elements in the prepared Zr55Al10Ni5Cu30glassy alloy samples. The elements of Zr, Cu, Ni, Al
and Si in the precipitated phases are analyzed by EDX, and the elements of Si and Oxygen in the sample are analyzed by other conventional method, respectively.
Zr (at%) Cu (at%) Ni (at%) Al (at%) Si (at%) O (at%)
Cubic (cF120) 60.01 24.79 4.65 10.55 <0:5 —
Ribbon sample CuZr2 63.66 20.21 10.71 5.41 <0:5 —
a-Zr (amorphus) 60.41 27.64 4.04 7.91 <0:5 —
55 30 5 10 0.2369 1.678
Sheet sample (200 um) 55 30 5 10 <0:0027 0.1822
Fig. 1 DSC profile of the Zr55Al10Ni5Cu30 glassy alloy of the ribbon
sample and the sheet sample heated constant heating rate of 0.67 K/s, and constant temperature annealed sheet sample at 758 K.
Fig. 2 XRD profiles of the Zr55Al10Ni5Cu30glassy alloy ribbon annealed
[image:2.595.311.541.439.602.2]values ranging from 2.3 to 2.6 are obtained for the -Zr precipitation by the least-squares fitting. Similarly, the Avrami exponentn values of 2.5 to 2.6 are obtained for the CuZr2 phase, and 2.5 to 2.8 are obtained for cubic Zr-rich
Al5Ni3Zr2-type phase and 2.3 to 2.7 for cubic NiZr2 phase,
respectively. The Avrami exponent n values of about 2.5 indicate the diffusion control process provided that 3-dimen-tional growth takes place.19)The four DSC exothermic peaks of Si-bearing sample are observed near the positions of the exothermic peaks of the Si-free sample. Therefore, the effect of Si contamination is a separation of the DSC peaks.
4. Discussions
4.1 Relationship between the diameter of the cluster and the diffusivity
The Avrami exponent values obtained in the present work indicate that the growth mechanism of the precipitates corresponds to the diffusion process of the constituent atoms Zr, Cu, Al and Ni in the glassy alloy. In addition, the diffusion process likely takes place by volume diffusion without boundary diffusion. The velocity of the growth process can be expressed by the inflow of atoms to the nucleus. A schematic concentration distribution of the alloying elements such as Zr, for example, near the Zr-rich nuclei in the glassy alloy is shown in Fig. 4. The inflow of atom can be estimated using the relation between the
concentrations and diffusivity of the constituent elements and the diffusion distance. The relation change depends on the annealing temperature. The relation among the concen-trations of the elements, the diffusion distance and annealing time can be described using diffusivity as follows:
C=C0¼1erffx=ð4DtÞ0:5g ð1Þ
where, C and C0 are the concentrations of the constituent elements, x is the size of the diffusion distance, D is the diffusivity andtis annealing time.
The diffusivities of the constituent elements such as Zr, Cu, Al and Ni in the glassy alloy are not known. However, the diffusivity of the atom can be approximately estimated using the self-diffusivity20,21)or the Stokes-Einstein relation;
D¼ ðkTÞ=ð6rÞ ð2Þ
in which,kis Boltzmann constant (k¼1:381023/JK1), Tis annealing temperature,is viscosity andris diameter of the constituent atom. On heating the glassy alloy exhibits the Newtonian-flow at the weak stress in the supercooled liquid region.22–24) In addition, because the constituent atoms diffuse independently at the initial state from fully glassy state to precipitation of crystallites before the crystals growth, the diffusivities can be estimated by the above-mentioned Stokes-Einstein relation (2).
The viscosity of the Zr55Al10Ni5Cu30 glassy alloy
meas-ured with a constant heating rate of 0.17 to 6.67 K/s was reported by Eckertet al.,25)and Yamasakiet al..26)Figure 5 shows the diffusivities of Zr, which are calculated from the viscosity. The diffusivity of the glassy alloy shows the inflection point at the glass transition temperature, and the slope of the diffusivity of the glassy alloy above the glass transition temperature is larger than that below the glass transition temperature. The diffusivities above the glass transition temperature become smaller gradually with a decrease in heating rate. Therefore, the diffusivity values calculated using viscosity data reported by Yamasakiet al.26) were extrapolated to the minimum heating rate (0.016 K/s). On the other hand, in order to calculate the diffusivities below the glass transition temperature we used the data reported by Eckertet al.25)for the slope and Yamasaki-reported data26) at the glass transition temperature for the intercept, respec-tively.
Fig. 3 Avrami function fitting for four different DSC-peaks as the precipitations.
[image:3.595.55.282.73.409.2] [image:3.595.310.543.80.214.2]4.2 Relationship between the diameter of the crystal and the embrittlement
Figure 6 shows the temperature dependence of the number of clustering atoms of Zr, in the relationship with the embrittlement.17)The growth velocities of all of the precip-itates, as confirmed by the eqs. (1) and (2), are found to obey the diffusivity of Zr. The diameter of the precipitates of-Zr is calculated to be 0.46, 0.99, 2.13 and 4.59 nm for the crystals containing 3, 30, 300 and 3000 atoms of Zr, respectively. Similarly, the diameter of the CuZr2 is also
calculated to be 0.75, 1.63, 3.50 and 7.54 nm for the crystal containing 3, 30, 300 and 3000 atoms of Zr in the cluster of CuZr2. The slope of the ductile-brittle transition line below
the glass transition temperature almost corresponds to the precipitation of-Zr with the diameter of 4.5 nm. For CuZr2
such a diameter is 2.5 nm. It is suggested that precipitation of CuZr2may have more significant influence on the
embrittle-ment than-Zr, and the phenomena are also influenced by the
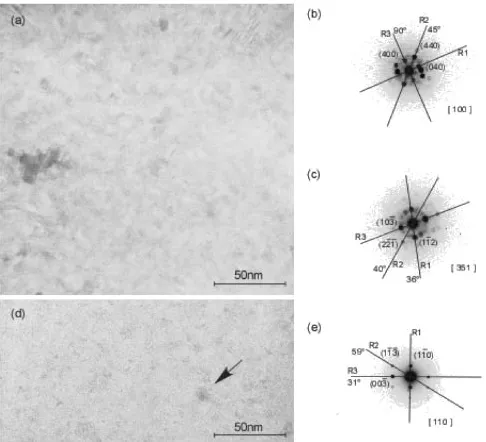
difference in the volume fractions of the precipitated phases. Figure 7 shows the bright field images along with the nano-beam diffraction (NBD) patterns obtained by TEM for the Zr55Al10Ni5Cu30 glassy alloy ribbon annealed (a, b) for
5300 s at 713 K and (c) for 36 ks at 663 K, as shown Fig. 6. The diffraction patterns in Fig. 7 were identified to belong to (a) cubic (Zr-based cF120 phase, which is somewhat differ-ent from commonly observed cF96 one), (b) CuZr2/tI6 and
(c) -Zr/hP2 phases, respectively. The results are also confirmed using an energy dispersive X-ray spectrometer (EDX) as shown in Table 1. -Zr phase found by TEM observations in the sample annealed for 36 ks at 663 K was not detected by XRD. The precipitated crystals are in the ribbon sample are slightly contaminated with 0.24 at% Si and 1.68 at% O and the precipitation temperatures of the crystals change as shown in Fig. 1. The contamination results in the change of the precipitation rates of the crystals due to changing slightly diffusivities of the elements in the glassy alloy.
5. Conclusions
The embrittlement behavior of the Zr55Al10Ni5Cu30
me-tallic glass alloy upon annealing was studied by phase analysis and numerical diffusive analysis.
(1) Above the glass transition temperature the samples showed four exothermic DSC peaks corresponding to different crystallization steps. The precipitated phases were identified to be cubic (Zr-rich Al5Ni3Zr2/cF120
phase), -Zr/hP2, cubic (NiZr2/cF96 phase) and
CuZr2/tI6 as verified by XRD and TEM. Although,
the precipitated phases contain only a small amount of contaminating elements like Si and O, the precipitation rates change.
Fig. 6 Relationship of between the embrittlement and the magnitude of number of clustering atom of Zr.
Fig. 7 Bright field images along with typical NBD diffraction patterns of the Zr55Al10Ni5Cu30glassy alloy ribbon annealed (a) 5300 s at 713 K and
(d) 36 ks at 663 K. (b) Cubic(Zr-rich Al5Ni3Zr2/cF120) and (c) CuZr2/tI6
show in (a) and (e)-Zr/hP2 show in (d), respectively. Cubic(Zr-rich Al5Ni3Zr2/cF120) and CuZr2/tI6 particles have nearly the same
mor-phology. Fig. 5 Temperature dependent of diffusivity of Zr in the Zr55Cu30Ni5Al10
[image:4.595.53.283.71.264.2] [image:4.595.306.549.72.293.2] [image:4.595.54.284.327.524.2](2) The samples annealed below the glass transition tem-perature for a long enough period contained three crystalline phases: cubic (Zr-rich Al5Ni3Zr2/cF120),
-Zr/hP2 and CuZr2/tI6.
(3) All of the exothermic reactions are diffusion controlled, which is expressed by the Avrami exponent values varied from 2.3 to 2.8.
(4) Si and oxygen contamination significantly influence the crystallization behavior of the studied alloy.
(5) The velocity of the accumulation of the atoms upon clustering, nucleation and growth kinetics can be estimated using their diffusion coefficients. The sizes of the -Zr and CuZr2 crystalline particles on the
ductile/brittle line are 4.5 nm and 2.5 nm, respectively.
REFERENCES
1) A. Inoue: Acta Mater.48(2000) 279–306. 2) A. Inoue: Mater. Trans., JIM36(1995) 866–875.
3) D. V. Louzguine, A. Takeuchi and A. Inoue: J. Mater. Sci.35(2000) 5537–5543.
4) D. V. Louzguine and A. Inoue: Mater. Res. Bull.34(1999) 1991–2001. 5) D. V. Louzguine-Luzgin, W. Zhang and A. Inoue: J. Alloy. Compd.
402(2005) 78–83.
6) N. Nishiyama and A. Inoue: Acta Mater.47(1999) 1487–1495. 7) R. Janlewing and U. Koster: Mater. Sci. and Eng.A304–306(2001)
833–838.
8) J. Saida, M. Matsushita, C. Li and A. Inoue: Mater. Sci. and Eng. A304–306(2001) 338–342.
9) L. Liu, K. C. Chan and T. Zhang: J. Alloy. Compd.396(2005) 114–
121.
10) Carsten Michaelsen and Michael Dahms: Thermochimica Acta 288 (1996) 6–27.
11) H.-R. Wang, Y.-L. Gao, Y.-F. Ye, G.-H. Min, Y. Chen and X.-Y. Teng: J. Alloy. Compd.353(2003) 200–206.
12) Z. J. Yan, S. R. He, J. R. Li and Y. H. Zhou: J. Alloy. Compd.368 (2004) 175–179.
13) J. S. C. Jang, Y. W. Chen, L. J. Chang, H. Z. Cheng, C. C. Huang and C. Y. Tsau: Mater. Chemistry and Physics89(2005) 122–129. 14) A. Inoue and T. Zhang: Mater. Trans., JIM37(1996) 185–187. 15) M. Heilmaier: J. Mater. Processing Technology117(2001) 374–380. 16) S. Zhu, X. Wang, F. Qin, K. Abe, H. Kimura and A. Inoue: Mater.
Trans.47(2006) 2308–2311.
17) I. Seki, K. Wakoh, A. Kawashima, H. Kimura and A. Inoue: Mater. Trans.47(2006) 1926–1929.
18) I. Seki and A. Inoue: Crystallization Kinetics of Zr55Al10Ni5Cu30
Metallic Glass and Welding Condition: Japan-Korea Workshop on Metallic Glasses, Jan. 20-21 (2006) Yonsei University.
19) J. W. Christian:the theory of transformations in metals and alloys, second edition, (1975), pp 542.
20) The Chemical Society of Japan,Kagakubinnran Fundamental, 5th ed., (2004), ppII-63.
21) The Iron and Steel Institute of Japan,Tekkoubinran Fundamental, 3rd ed., (1981), pp 349.
22) H. Kato, A. Inoue and H.-S. Chen: Acta Mater.54(2006) 891–898. 23) D. J. Safarik, C. M. Cady and R. B. Schwarz: Acta Mater.53(2005)
2193–2202.
24) Y. Kawamura, T. Nakamura, H. Kato, H. Mano and A. Inoue: Mater. Sci. and Eng.A304–306(2001) 674–678.
25) J. Eckert, A. Kubler, A. Reger-Lconhard, A. Gebert and M. Heimaier: Mater. Trans., JIM41(2000) 1415–1422.