1073 | P a g e
TB Detection in Chest Radiograph Using Deep Learning
Architecture
Anuj Rohilla
1, Rahul Hooda
2, Ajay Mittal
11
Department of CSE, UIET, Panjab University, Chandigarh, India
2Department of CSE, PEC University of Technology, Chandigarh, India
ABSTRACT
Tuberculosis (TB) is a malignant infectious disease and is a major health threat in most of the regions in the
world. Most of the diagnostic methods were developed in the last century which are still in use and are time
consuming and generally unreliable. Chest radiography is used as the most common method for screening of
large population. The successfulness of this method depends on the experience and the interpretation skill of the
radiologists. Computer-aided diagnostic (CAD) system can be used to overcome this issue and can accelerate
the process of active case finding. There is a considerable growth in recent years, in the field of deep learning,
which allows the classification of extremely heterogeneous images. Convolutional neural networks (CNN), a
deep learning technique has gained popularity due to its ability to learn mid and high level image
representations. In this work various CNN models are used which classifies the chest radiographs into TB
positive and TB negative classes. The performance of the system is measured on two publicly available datasets:
Shenzhen chest X-ray set and Montgomery County chest X-ray set (MC). The proposed computer-aided
diagnostic system for TB screening, achieves accuracy more than 80%, which is comparable to the performance
of radiologists.
Keywords – Chest X-rays, Deep learning, Medical imaging, Tuberculosis
I. INTRODUCTION
With an estimation of 10.4 million new Tuberculosis (TB) cases and with the mortality rate of 1.8 million worldwide, TB remained one of the top 10 cause of death worldwide in 2015 [1]. TB is an infectious disease which is caused by a bacterium named bacillus mycobacterium tuberculosis. It is a communicable disease which spreads through coughing and sneezing and it basically affects the lungs (pulmonary TB) of the infected person (except extrapulmonary TB, which affects any other part of the body like kidney, spine, brain or lymph nodes). In actual fact a small proportion of the estimated people affected with mycobacterium tuberculosis develop TB disease in their lifetime, but if the person is already affected with HIV, probability to develop TB disease is very high which make the problem worse.
1074 | P a g e
misclassifications when measurements are close to the threshold point that separates negative and positive results
[3]. Latest rapid molecular tests are fast and accurate, however their availability and cost is a big concern. Chest radiography (CXR) is also used for screening purpose that is WHO recommended method for early detection of TB. The CXR which shows some abnormality is further examined with other tests. In the case of HIV-co-infection, CXR diagnostic method improves TB detection [4]–[7]. This method can be used for screening a large population and can identify active TB cases within a reasonable amount of time and in a very cost effective manner. In areas having limited resources the confirmatory diagnostic tests like sputum smear are not available, CXR is used in those areas as one of the diagnostic tool for TB detection [8], [9]. The major barrier to use this method is the limited availability of trained radiologists in low or middle-income countries, and the accuracy of this method depends on the experience and the interpretation skill of the reader [10]. Computer-aided diagnostic (CAD) systems can be used to accelerate the process of active case finding in areas that lack skilled radiologist by assisting them [11].
Most of the CAD systems which are developed for the diagnosis of tuberculosis use the segmentation of the lungs and texture or geometric feature extraction for the detection of the tuberculosis in a chest radiograph [12]– [15]. In these systems a feature extractor is manually made which gathers relevant information from the input and then the output of the extractor is given to a classifier which classifies feature vectors into classes. Now day’s deep learning techniques are widely used for the classification purpose, due to its success in ImageNet Large Scale Visual Recognition Competition [16]. Convolutional neural network (CNN) [17] which is a deep learning technique, has been proven to be a very powerful tool for a wide range of computer vision tasks. The manual feature extractor is made automatic using CNN, where the features are automatically learned by the network from the input using the convolution layers.
1.1 Introduction to Deep Learning
Deep learning is a subpart of a broader family of machine learning algorithm that uses a number of layers for feature extraction and transformation. Information is passed through every layer and the output of one layer acts as an input to the other layer, the first layer is called as an input layer, while the last layer is called as an output layer. This technique is inspired by the structure and the function of the brain. In 1943, Walter Pitts and Warren McCulloch created the first computer model which was based on the neural networks of the human brain. They used a combination of algorithms and mathematics they called threshold logic to mimic the thought process [18]. Then in 1960, Henry J. Kelley developed the basics of a continuous Backpropagation Model [19], however backpropagation was not useful until 1985 due to inefficiency and clumsiness in the algorithm. Since that time, Deep Learning has evolved steadily.
1075 | P a g e
CNNs forms the heart of the most complex and fancy computer vision application, such as gesture recognition [20], self-driving cars, auto-tagging [21], etc.
In early 1950s, Professors David Hubel and Torsten Wiesel, during their study of structure and function of the visual cortex on a cat [22], heard some sound as they moved a bright line across its retina and noticed some interesting things like the neurons gets activated only when the bright line was at a particular place on the retina of the cat and sometimes the neurons gets activated only when the bright line was moving in a particular direction and also the activity of these neurons gets changed depending on the orientation of the line. This classic experiment by Hubel and Wiesel laid the foundation of how neurons extract information from the light casted on retina to construct an image. Then in 1980s Kunihiko Fukushima after getting inspired from the work of Hubel and Wiesel, proposed neocognitron which is a hierarchical neural network and which served as the inspiration for convolutional neural networks [23].
Convolutional neural networks are made up of neurons with learnable weights and biases, it basically comprised of one or more convolution layer, pooling or subsampling layer, followed by one or more dense or fully connected layers, all these layers are stacked to form a CNN. The rest of the paper is organized as follows. Section 2 gives the glimpse of the related work that has been done in this field. Section 3 gives the detail of the dataset which is used for the system. Section 4 explains the proposed method. Section 5 presents and discusses the experimental results and finally Section 6 concludes the work done.
II. RELATED WORK
The development of computer aided diagnosis and screening systems has got new momentum due to the emergence of digital chest radiography and the possibility of digital image processing. In recent years, several revolutionary papers have been published on computer-aided diagnosis (CAD) in CXRs, despite that more research is needed in this field to meet the practical performance requirements.
Le [24] proposed a method for the diagnosis using the lung segmentation based on Watershed algorithm. A small scanning window is used on the segmented lung area to find the average and maximum intensity value of the pixels. Classification of the window center is done by comparing each pixel of the window to a selected threshold value between average and maximum intensity value. Leibstein and Nel [25] proposed a method which uses image processing techniques like Laplacian of Gaussian (LoG) and local binary pattern (LBP), to manually detect TB nodules by highlighting them. Their paper also focuses on the pre-processing part of segmenting the lungs and suppressing ribs using dual-energy. The method proposed for TB diagnosis by Ratnasari [26], [27] use statistical feature for texture analysis. In this method feature vector is created by computing five statistical features, particularly mean, standard deviation, skewness, kurtosis and entropy. Then feature dimensionality is performed for reduction up to one- and two-dimension using the PCA method and final classification is performed using the minimum distance classifier. Comparisons of results generated by selecting one-dimensional and two-dimensional PCA output are also presented in this paper.
1076 | P a g e
multiplier for each region. Train and testing of this method are done on 388 images of TB dataset and 200 images of interstitial disease (ID) dataset and it gives AUC of 0.82 and 0.98 on these two datasets respectively. Jaeger [29] proposed a method for TB detection, which uses three different, masks particularly lung model mask, Log Gabor mask and intensity mask, for better lung segmentation. Descriptors such as intensity histograms, Hessian shape features, HOG and LBP of distinctive shape and texture are used to find normal and abnormal pattern. Histogram is used to illustrate the distribution of each descriptor along the lung field, total 32 histogram bins are used and the value of each bin for each descriptor is considered as a feature. Then final classification is performed using linear support vector machine.
Melendez [30], in 2014 proposed a method which uses a weakly labelled approach to detect TB. In this approach, system is not given the exact location of the manifestation to learn, however image label is given that whether CXR is normal or abnormal. This method is based on multiple-instance learning (MIL) approach using weakly labelled images. In this method the most time consuming and tedious task of manually outlining of abnormality is not required, as during training only image labels are required. Moments of intensity distribution and spatial features such as distance to center of gravity of both lungs and the lung wall are the features used in this method. Classifier used here is miSVM (maximum integer Support Vector Machine). Training and testing uses 461 and 456 images respectively and the model achieves the AUC of 0.8529 which is comparable to conventional approaches using the exact location of the abnormality. This method is further improved by modifying miSVM classifier by including probability estimates instead of decision values by the authors in [31]. The proposed method gives the AUC performance of 0.91 which is comparable to other supervised methods available for detecting TB textural abnormalities.
A method to detect suspected TB radiographs without segmenting the lung region is proposed by Chauhan [32]. In the proposed method, features are computed from the complete images rather than the segmented images since it will provide better spatial and contextual information. Performance of various features such as Gist, HOG, Gabor and PHOG are calculated using SVM classifier and it was observed that the performance of PHOG and Gist features are best among them.
DATASET
Datasets used here are publicly available postero-anterior (PA) chest radiographs, made by the U.S. National Library of Medicine [33]. The radiographs were taken from the Department of Health and Human Services, Maryland, USA, Montgomery County and Shenzhen No. 3 Peoples Hospital in China. Datasets contain both normal and abnormal chest radiographs with manifestations of TB and also include the associated radiologist readings.
1.2 Montgomery County chest X-ray set (MC)
1077 | P a g e
1.3 Shenzhen chest X-ray set
The Shenzhen dataset was collected in collaboration with Shenzhen No.3 People’s Hospital, Guangdong Medical College, Shenzhen, China. It consists contains 662 frontal chest X-rays, out of which 326 are normal cases and 336 are cases with manifestations of TB, including pediatric X-rays (AP). These X-rays are from outpatient clinics within a 1-month period, mostly in September 2012, using a Philips DR Digital Diagnost system. The X-rays are provided in PNG format. Their size is approximately 3Kx3K pixels.
METHOD
All CNN models are run on a machine with Linux operating system (Ubuntu 16.04), the models are created using python programming language and with tensorflow deep learning framework. The machine contained an Intel i5 3570k 3.4-gHz processor (Intel, Santa Clara, Calif), 4 TB of hard disk space, 32 GB of RAM, and a CUDA-enabled Nvidia Titan 312 GB graphics processing unit (Nvidia).
1.4 Preprocessing
The radiograph images in the dataset are of different size and most of the images are having one color channel, i.e. grayscale and some are having three color channels i.e. RGB. Firstly, all the images are converted to grayscale images and are resized into 227x227 matrix and 224x224 matrix with Portable Network Graphics (PNG) format. To increase the number of images in the dataset the method of image augmentation was used, following operations were performed on every image, rotation of image to 90o, 180o and 270o, mirror image and histogram equalization.
1.5 Network
The deep convolutional neural networks which are used in this study are AlexNet [34] and VGGNet [35] with some modifications, so that to fit the models on our dataset. The images were divided into two parts, training and test set in the ratio of 70:30. The performance of the model was determined using the test set, i.e. 30% of our dataset.
1.5.I AlexNet
AlexNet is a CNN model proposed by Alex Krizhevsky, Ilya Sutskever and Geoffrey E. Hinton and the net was the winner of ImageNet Large Scale Visual Recognition Challenge in the year of 2012.
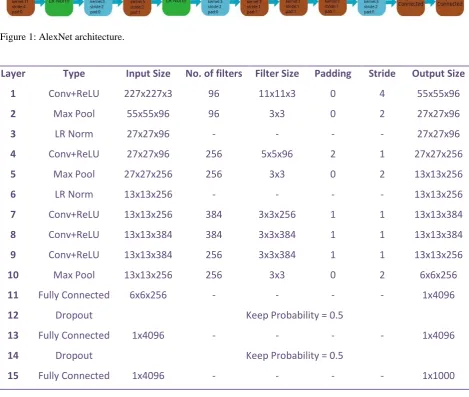
The network contains 5 convolution layers, 3 max pooling layers, 2 local contrast normalization layers and 2 fully connected layers. The model takes the image of size 227x227x3 as input, upon which the processing is done. Two NVIDIA GTX 580 3GB GPUs were used to train the model as at that time the GPUs were not so powerful to train the model, therefore second, fourth and fifth convolution layer was divided into two parts and trained on two different GPUs.
1078 | P a g e
Figure 1: AlexNet architecture.
Layer
Type
Input Size
No. of filters Filter Size
Padding
Stride
Output Size
1
Conv+ReLU
227x227x3
96
11x11x3
0
4
55x55x96
2
Max Pool
55x55x96
96
3x3
0
2
27x27x96
3
LR Norm
27x27x96
-
-
-
-
27x27x96
4
Conv+ReLU
27x27x96
256
5x5x96
2
1
27x27x256
5
Max Pool
27x27x256
256
3x3
0
2
13x13x256
6
LR Norm
13x13x256
-
-
-
-
13x13x256
7
Conv+ReLU
13x13x256
384
3x3x256
1
1
13x13x384
8
Conv+ReLU
13x13x384
384
3x3x384
1
1
13x13x384
9
Conv+ReLU
13x13x384
256
3x3x384
1
1
13x13x256
10
Max Pool
13x13x256
256
3x3
0
2
6x6x256
11
Fully Connected
6x6x256
-
-
-
-
1x4096
12
Dropout
Keep Probability = 0.5
13
Fully Connected
1x4096
-
-
-
-
1x4096
14
Dropout
Keep Probability = 0.5
15
Fully Connected
1x4096
-
-
-
-
1x1000
Table 1: Description of layers in AlexNet
1.5.II VGGNet
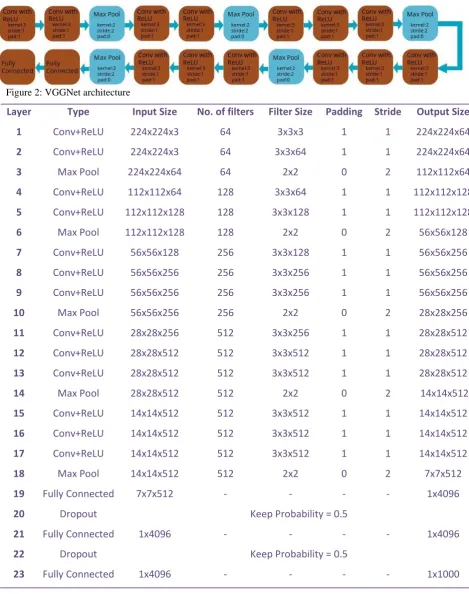
VGGNet is a CNN model which was proposed by Karen Simonyan and Andrew Zisserman, the net secured second position in ImageNet Large Scale Visual Recognition Challenge in the year of 2014. Total 6 models were proposed by Karen Simonyan and Andrew Zisserman out of which the model with the 16 weight layers has given the best result. The 16 weight layers model contains 13 convolution layers, 5 max pooling layers and 2 fully connected layers. The architecture of the VGGNet is given by Fig. 2 and the description of all layers is given in Table 2.
1079 | P a g e
Figure 2: VGGNet architecture
Layer
Type
Input Size
No. of filters
Filter Size Padding Stride
Output Size
1
Conv+ReLU
224x224x3
64
3x3x3
1
1
224x224x64
2
Conv+ReLU
224x224x3
64
3x3x64
1
1
224x224x64
3
Max Pool
224x224x64
64
2x2
0
2
112x112x64
4
Conv+ReLU
112x112x64
128
3x3x64
1
1
112x112x128
5
Conv+ReLU
112x112x128
128
3x3x128
1
1
112x112x128
6
Max Pool
112x112x128
128
2x2
0
2
56x56x128
7
Conv+ReLU
56x56x128
256
3x3x128
1
1
56x56x256
8
Conv+ReLU
56x56x256
256
3x3x256
1
1
56x56x256
9
Conv+ReLU
56x56x256
256
3x3x256
1
1
56x56x256
10
Max Pool
56x56x256
256
2x2
0
2
28x28x256
11
Conv+ReLU
28x28x256
512
3x3x256
1
1
28x28x512
12
Conv+ReLU
28x28x512
512
3x3x512
1
1
28x28x512
13
Conv+ReLU
28x28x512
512
3x3x512
1
1
28x28x512
14
Max Pool
28x28x512
512
2x2
0
2
14x14x512
15
Conv+ReLU
14x14x512
512
3x3x512
1
1
14x14x512
16
Conv+ReLU
14x14x512
512
3x3x512
1
1
14x14x512
17
Conv+ReLU
14x14x512
512
3x3x512
1
1
14x14x512
18
Max Pool
14x14x512
512
2x2
0
2
7x7x512
19
Fully Connected
7x7x512
-
-
-
-
1x4096
20
Dropout
Keep Probability = 0.5
21
Fully Connected
1x4096
-
-
-
-
1x4096
22
Dropout
Keep Probability = 0.5
23
Fully Connected
1x4096
-
-
-
-
1x1000
1080 | P a g e
II. RESULTS AND DISCUSSION
Experiment 1 : Using the original AlexNet model on Shenzen chest x-ray and Montgomery County (MC) chest x-ray dataset without using image augmentation.
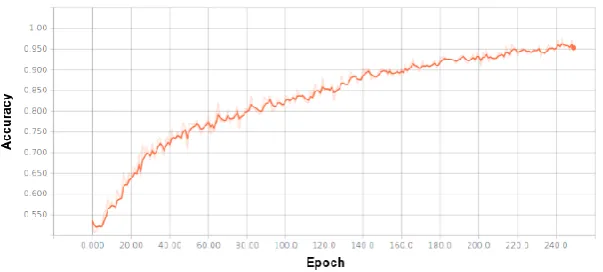
Images in the dataset which are converted into 227x227 are used for the training of the model, learning rate of the model is set to 0.001, batch of size 560 images is used, the model is trained for 150 epochs and softmax classifier is used for the classification of the images into two classes that is, TB positive or TB negative.
Accuracy of the model during training is given by Fig. 3 and the final accuracy of the model is represented by Table 3.
Figure 3: Accuracy of original AlexNet model on original dataset.
Table 3: Final accuracy of original AlexNet on dataset.
Experiment 2: Using the modified AlexNet and VGGNet model on original Shenzhen chest X-ray and Montgomery County (MC) chest X-ray dataset without using image augmentation.
In this experiment the images converted into proper size according to the networks i.e 227x227 and 224x224 for AlexNet and for VGGNet respectively were used. For the VGGNet model the learning rate was set to 0.001, batch size of 560 images was used, the model was trained for 200 epochs and the classification was done using softmax classifier.
1081 | P a g e
For the AlexNet model the learning rate was set to 0.001, batch size of 560 images was used, the model was trained for 250 epochs and the classification was done using softmax classifier.
Accuracy of the modified AlexNet model during the training is represented by Fig. 4 and final accuracies of both the models is given by Table 4.
Table 4: Final accuracy of modified models on original dataset
The accuracy of the modified VGGNet model is more than the modified AlexNet model because more number of layers are present in the modified VGGNet as compare to modified AlexNet and due to this more features are learned by the modified VGGNet.
The accuracy of original AlexNet and the modified AlexNet is same; this shows that dropping of the local response normalization layers does not have any significant effect on the accuracy of the model.
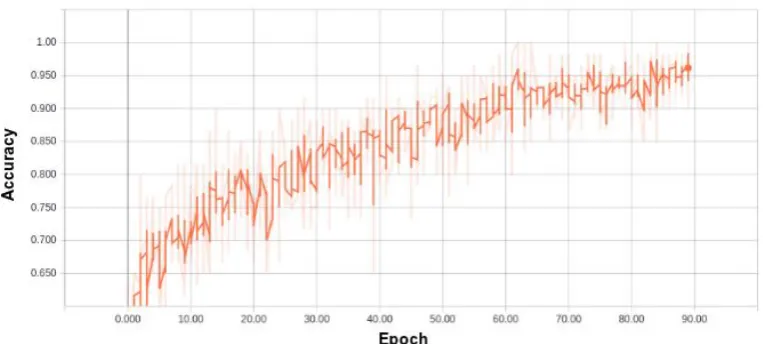
Figure 5: Accuracy of modified AlexNet model on augmented dataset.
Experiment 3: Using the modified AlexNet model on augmented Shenzhen chest X-ray and Montgomery County (MC) chest X-ray dataset.
In this experiment the modified AlexNet was used on the augmented dataset, in which the radiograph images were resized to 227x227. Learning rate used was 0.001, batch size of 60 images was used, the model was trained for 90 epochs and the classifier used was softmax classifier.
Accuracy of the modified AlexNet on augmented dataset during training is represented in Fig. 5 and final accuracy is given by Table 5.
Table 5: Final accuracy of modified AlexNet on augmented dataset
Accuracy of the model decreases with the introduction of image augmentation on the dataset, because new extra features of augmented images are learned by the model which were not necessary to be learned, and this confuses the model during prediction.
1082 | P a g e
into more than fifteen thousand non-medical categories was used. The result obtained with the fine-tuned AlexNet model was not good, this is due to the absence of radiographs in ImageNet.
III. CONCLUSION
In this work we have used Convolutional Neural Network (CNN), a deep learning architecture for creating a Computer aided diagnostic (CAD) system. As compared to the other methods, the major benefit of using deep learning is the automatic feature extraction process. With a deep network, VGGNet gives an acceptable result with the dataset used. The usage of augmentation methods to increase the dataset is not a good idea in the case of medical images, as the model learns some spurious patterns which cause the decrease in the accuracy of the model. The method of transfer learning, in which a model pre trained on some dataset is used on some other dataset is useful if the dataset on which the model is going to be used is already know to the model, as in this case the ImageNet do not have any class of radiographs therefore the we obtained unacceptable result. The accuracy of the model can be further improved by increasing the chest radiograph dataset, with more number of images more features will be learned by the model.
IV. ACKNOWLEDGEMENT
The authors would like to thank Nvidia Corporation for providing free-of-cost GPU for performing our experiments. We would also like to acknowledge the infra-structural support provided by Design Innovation Center (DIC), UIET, Panjab University, Chandigarh for the execution of this work.
REFERENCES
[1]W. H. Organization et al., “Global tuberculosis report 2016,” 2016.
[2] P. Quinćo, S. B̈ uhrer-Śekula, W. Brand̃ao, R. Monte, S. L. Souza, V. Saraceni, M. Palaci, R. Dietze, and M. Cordeiro-Santos, “Increased sensitivity in diagnosis of tuberculosis in hiv-positive patients through the small-membrane-filter method of microscopy,” Journal of clinical microbiology, vol. 51, no. 9, pp. 2921– 2925, 2013.
[3]J. Pouchot, A. Grasland, C. Collet, J. Coste, J. M. Esdaile, and P. Vinceneux, “Reliability of tuberculin skin test measurement,” Annals of internal medicine, vol. 126, no. 3, pp. 210–214, 1997.
[4] A. Harries, N. Hargreaves, J. Kwanjana, F. Salaniponi et al., “Clinical diagnosis of smear-negative pulmonary tuberculosis: an audit of diagnostic practice in hospitals in malawi,” The international journal of tuberculosis and lung disease, vol. 5, no. 12, pp. 1143–1147, 2001.
[5] J. Day, S. Charalambous, K. Fielding, R. Hayes, G. Churchyard, and A. Grant, “Screening for tuberculosis prior to isoniazid preventive therapy among hiv-infected gold miners in south africa,”The international journal of tuberculosis and lung disease, vol. 10, no. 5, pp. 523–529, 2006.
1083 | P a g e
[7] M. J. Reid and N. S. Shah, “Approaches to tuberculosis screening and diagnosis in people with hiv in resource-limited settings,” The Lancet infectious diseases, vol. 9, no. 3, pp. 173–184, 2009.
[8] S. Shah, M. Demissie, L. Lambert, J. Ahmed, S. Leulseged, T. Kebede, Z. Melaku, Y. Mengistu, E. Lemma, C. D. Wells et al., “Intensified tuberculosis case finding among hiv-infected persons from a voluntary counseling and testing center in addis ababa, ethiopia,” JAIDS Journal of Acquired Immune Deficiency Syndromes , vol. 50, no. 5, pp. 537–545, 2009.
[9] M. Bakari, R. D. Arbeit, L. Mtei, J. Lyimo, R. Waddell, M. Matee, B. F.Cole, S. Tvaroha, C. R. Horsburgh, H. Soini et al., “Basis for treatment of tuberculosis among hiv-infected patients in tanzania: the role of chest x-ray and sputum culture,” BMC infectious diseases, vol. 8, no. 1, p. 32, 2008.
[10] K. Toman et al., Tuberculosis case-finding and chemotherapy: questions and answers. World Health Organization, 1211 Geneva 27, Switzerland, 1979.
[11] B. van Ginneken, C. M. Schaefer-Prokop, and M. Prokop, “Computer-aided diagnosis: how to move from the laboratory to the clinic,” Radiology, vol. 261, no. 3, pp. 719–732, 2011.
[12] B. Van Ginneken, S. Katsuragawa, B. M. ter Haar Romeny, K. Doi, and M. A. Viergever, “Automatic detection of abnormalities in chest radiographs using local texture analysis,” IEEE transactions on medical
imaging, vol. 21, no. 2, pp. 139–149, 2002.
[13] T. Xu, I. Cheng, and M. Mandal, “Automated cavity detection of infectious pulmonary tuberculosis in chest radiographs,” in Engineering in Medicine and Biology Society, EMBC, 2011 Annual International Conference of the IEEE. IEEE, 2011, pp. 5178–5181.
[14] S. Jaeger, A. Karargyris, S. Candemir, L. Folio, J. Siegelman, F. Callaghan, Z. Xue, K. Palaniappan, R. K. Singh, S. Antani et al., “Automatic tuberculosis screening using chest radiographs,” IEEE transactions on medical imaging, vol. 33, no. 2, pp. 233–245, 2014.
[15] Y. Arzhaeva, M. Prokop, D. M. Tax, P. A. De Jong, C. M. Schaefer-Prokop, and B. van Ginneken, “Computer-aided detection of interstitial abnormalities in chest radiographs using a reference standard based on computed tomography,” Medical Physics, vol. 34, no. 12, pp. 4798–4809, 2007.
[16] O. Russakovsky, J. Deng, H. Su, J. Krause, S. Satheesh, S. Ma, Z. Huang, A. Karpathy, A. Khosla, M. Bernstein et al., “Imagenet largescale visual recognition challenge,” International Journal of Computer Vision, vol. 115, no. 3, pp. 211–252, 2015.
[17] Y. LeCun, L. Bottou, Y. Bengio, and P. Haffner, “Gradient-based learning applied to document recognition,” Proceedings of the IEEE, vol. 86, no. 11, pp. 2278–2324, 1998.
[18] W. S. McCulloch and W. Pitts, “A logical calculus of the ideas immanent in nervous activity,” The bulletin of mathematical biophysics, vol. 5, no. 4, pp. 115–133, 1943.
[19] H. J. Kelley, “Gradient theory of optimal flight paths,” Ars Journal, vol. 30, no. 10, pp. 947–954, 1960. [20] N. Neverova, C. Wolf, G. W. Taylor, and F. Nebout, “Multi-scale deep learning for gesture detection and
localization,” in Workshop at the European conference on computer vision, Springer, 2014, pp. 474–490. [21] P. Hamel and D. Eck, “Learning features from music audio with deep belief networks.” in ISMIR. Utrecht,
The Netherlands, 2010, pp. 339–344.
1084 | P a g e
[23] K. Fukushima, “Neocognitron: A self-organizing neural network model for a mechanism of pattern recognition unaffected by shift in position,” Biological Cybernetics, vol. 36, no. 4, pp. 193–202, Apr 1980. [24] K. Le, “Automated detection of early lung cancer and tuberculosis based on x-ray image analysis,” in Proc.
WSEAS International Conference on Signal, Speech and Image Processing, 2006, pp. 1–6.
[25] J. M. Leibstein and A. L. Nel, “Detecting tuberculosis in chest radiographs using image processing techniques,” University of Johannesburg, 2006.
[26] R. N. Rohmah, A. Susanto, and I. Soesanti, “Lung tuberculosis identification based on statistical feature of thoracic x-ray,” in QiR (Quality in Research), 2013 International Conference on. IEEE, 2013, pp. 19–26. [27] N. Ratnasari, A. Susanto, I. Soesanti et al., “Thoracic x-ray features extraction using thresholding-based roi
template and pca-based features selection for lung tb classification purposes,” in Instrumentation, Communications, Information Technology, and Biomedical Engineering (ICICI-BME), 2013 3rd
International Conference on. IEEE, 2013, pp.65–69.
[28] B. Van Ginneken, S. Katsuragawa, B. M. ter Haar Romeny, K. Doi, and M. A. Viergever, “Automatic detection of abnormalities in chest radiographs using local texture analysis,” IEEE transactions on medical imaging, vol. 21, no. 2, pp. 139–149, 2002.
[29] S. Jaeger, A. Karargyris, S. Antani, and G. Thoma, “Detecting tuberculosis in radiographs using combined lung masks,” in Engineering in Medicine and Biology Society (EMBC), 2012 Annual International Conference of the IEEE. IEEE, 2012, pp. 4978–4981.
[30] J. Melendez, C. Śanchez, R. Philipsen, P. Maduskar, and B. van Ginneken, “Multiple-instance learning for computer-aided detection of tuberculosis,” in SPIE Medical Imaging. International Society for Optics and Photonics, 2014, pp. 90 351J–90 351J.
[31] J. Melendez, B. van Ginneken, P. Maduskar, R. H. Philipsen, K. Reither, M. Breuninger, I. M. Adetifa, R. Maane, H. Ayles, and C. I. Śanchez, “A novel multiple-instance learning-based approach to computer-aided detection of tuberculosis on chest x-rays,” IEEE transactions on medical imaging, vol. 34, no. 1, pp. 179– 192, 2015.
[32] A. Chauhan, D. Chauhan, and C. Rout, “Role of gist and phog features in computer-aided diagnosis of tuberculosis without segmentation,” PloS one, vol. 9, no. 11, p. e112980, 2014.
[33] S. Jaeger, S. Candemir, S. Antani, Y.-X. J. Ẃang, P.-X. Lu, and G. Thoma, “Two public chest x-ray datasets for computer-aided screening of pulmonary diseases,” Quantitative imaging in medicine and surgery, vol. 4, no. 6, p. 475, 2014.
[34] A. Krizhevsky, I. Sutskever, and G. E. Hinton, “Imagenet classification with deep convolutional neural networks,” in Advances in neural information processing systems, 2012, pp. 1097–1105.
[35] K. Simonyan and A. Zisserman, “Very deep convolutional networks for large-scale image recognition,”
arXiv preprint arXiv:1409.1556, 2014.