STATCOM Modelling for Power Flow
Analysis and Enhancement of Voltage Profile
of the System
Ajeet Kumar
1, Amit Kumar
2, Vidit Prakash Rai
3, Shampu Chandra Mondal
4M.Tech, Department of Electrical Engineering, DRIEMS, Cuttack, India1,2,4 Lecturer, Department of Electrical Engineering, KK Polytechnic, Dhanbad, India 3
ABSTRACT:With the advancement of technology, the demand of electrical energy has also increased. The demand of electricity has become the parameter of development of a nation. An electrical utility company has to use its existing transmission capacity to feed the ever increasing demand of electricity, due to that the transmission lines has to be operated near its thermal stability limits. Operating the lines near or above thermal stability limits makes system vulnerable to faults moreover it also increases the losses in the system. One way to increase the transmission capacity of the system without operating it to its thermal stability limit is to provide reactive power compensation at various locations. Reactive power compensation improves the voltage profile of the system, increase the power transfer in the lines and reduce losses.
STATCOM is one such device that is used for reactive power compensation. It provides reactive power compensation thereby improving the voltage profile of the system.
In this paper reactive power compensation is attempted using STATCOM. To study its effect Load flow study is performed on IEEE (Institute of Electrical & Electronics engineer) 30 bus with and without STATCOM and the results are then compared to show the effect of STATCOM on the system. Newton Raphson method is used for the load flow study of the system. Simulation is done using MATLAB
KEYWORDS: Newton Raphson, FACTS controller, Reactive power compensation.
I. INTRODUCTION
As in the modern era of power system the rapid development of infrastructure and human lifestyle has become very much dependent upon electrical energy, to fulfil their daily needs. This has resulted in the rapid growth of power system. There are few problems that we face with respect to stability, power distribution and individual power outranges. Transmission systems are being pushed to operate closer to their stability limit and also reaching close to their thermal limits to maintain the urban lifestyle with enormous demand of power. The two main constrain is to keep the demand and supply of power equal or matched are, To fulfill the demand of power within the thermal limit and Sometimes when the power demand is greater than the supply then there is a stability problem and this causes blackouts incurring huge losses.
These two constrain affect the quality of power to be delivered. By enhancing the power system control these constraints can be controlled by FACTS devices. With satisfied stability and Reliability criteria to meet the load demand, either existing transmission lines must be utilized more efficiently or new transmission line should be added to the system. Therefore, power electronics based controllers based on FACTS technology are used to optimize the power flow on existing lines [1]. These are known as FACTS Controllers. FACTS controllers can be connected either in shunt or in series. Usually, the shunt ones are used for reactive power compensation at the system buses. Shunt FACTS controllers can be either thyristor based or voltage sourced converter based. Generally, the voltage sourced converters are superior in performance as compared to the thyristor based ones [1-5].
or inductive compensation can be obtained thus controlling active power. TCSC (Thyristor Controlled Series Capacitor) is connected in series with the transmission line to enhance the power transfer capability. To increase the steady state transmittable power and to control the voltage profile shunt compensation is used. STATCOM (Static Compensator) is a shunt compensator and comes under FACTS device category that is being applied to long transmission lines. the static compensator (STATCOM) is an example of voltage sourced converter based shunt FACTS controller. They are used for the control of power system. Applications such as scheduling of power flow, decreasing unsymmetrical components, decreasing the power oscillations and increasing the transient stability. [3-5] present some research works on the power flow modelling of a STATCOM. both the transient stability and the damping of power oscillations can be improved [5-9]. This paper presents a novel power flow model of the STATCOM which can be implemented using existing power flow codes.
II
.
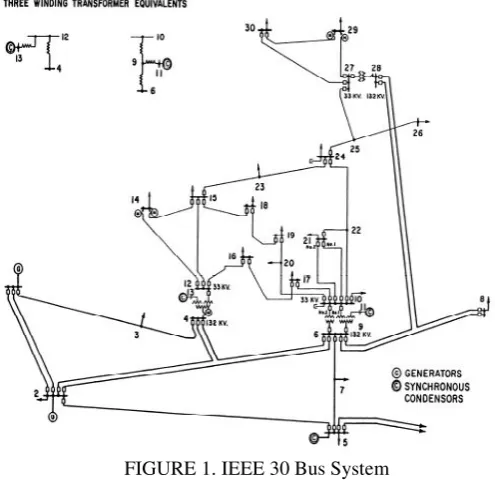
SYSTEM MODEL AND ASSUMPTIONSA single line diagram of IEEE 30 bus is shown in the figure 1. This system consists of five generator buses (bus numbers 2, 6, 8, 11, 13) bus 1 is taken as slack bus. There are 27 load buses in the system viz. 2, 3, 4, 6, 6, 7, 8, 9, 10, 12, 14, 16, 16, 17, 18, 19, 20, 21, 22, 23, 24, 26, 26, 27, 28, 29, 30. This system will be subjected to Newton Raphson load flow study via MATLAB.
STATCOM is placed at bus 4, bus 7, bus 14 and bus 29.
FIGURE 1. IEEE 30 Bus System
III. POWER FLOW ANALYSIS OF STATCOM
A. N-R method
The most widely used method is the newton Raphson method for solving simultaneous nonlinear algebraic equations. Newton’s method is found to be more efficient and practical. The number of iterations required to obtain a solution is independent of the system size, but more functional evaluations are required at every iteration [10]. Since in the power flow problem real power and voltage magnitude are specified for the voltage-controlled buses, the power flow equation is formulated in polar form. This equation can be rewritten in admittance matrix as
𝐼 = ∑ 𝑌 𝑉 =
𝐼 = ∑|𝑉 ||𝑌 |∠𝜃 + 𝛼 =
The complex power at bus i is
+ = 𝑉∗𝐼
Separating the real and imaginary parts
= ∑|𝑉 ||𝑉 ||𝑌 |𝑐 𝑠 𝜃 − 𝛼 + 𝛼 =
= − ∑|𝑉 ||𝑉 ||𝑌 |𝑠 𝜃 − 𝛼 + 𝛼 =
[∆ ] = [∆ ] [∆|𝑉|]∆𝛼
By running the load flow analysis using NR-method we can fine the Power flows in individual lines and loss.
B. Functional model of STATCOM
The STATCOM is represented by a voltage source Vsh∠𝜃𝑠ℎ. 𝐺𝑐eq is the effective conductance due to the switching
losses. The current Ish is the current drawn from bus ‘i’ by the STATCOM
It can be shown that [3] a ‘n’ bus power system network incorporating a STATCOM is equivalent to a ‘(n+1)’ bus system without any STATCOM. Also, the net current injection at the additional (n+1)th bus representing the
STATCOM can be represented by
𝐼+ = ∑ 𝑌+ 𝑉𝐾 +
𝐾=
The shunt voltage source representing the converter output voltage is given by Vsh=kshVDC
Where, VDC is the DC side voltage and Ksh is a constant that accounts for the type of the converter. The switching loss
is given as
𝑊 =𝑉
𝑐 = 𝑐
𝑉𝑠ℎ 𝐾𝑠ℎ= 𝐺
eq𝑉 𝑠ℎ
𝐺eq= 𝐾𝑠ℎ
To incorporate the switching losses, the self admittance of the additional (n+1)th bus needs to be modified as [9]
𝑌+ , + = 𝑌𝑠ℎ+ 𝐺eq
The power flow equation for the STATCOM is given as:
𝐴 = 𝑉+ 𝑉 𝑌+ ,𝑐 𝑠(𝜃 + − 𝜃 − ∅ + ,) + 𝑉+ 𝑌+ , + 𝑐 𝑠∅ + , +
This equation can also be written as:
𝐴 = 𝑉𝑠ℎ𝑉 𝑌+ ,𝑐 𝑠(𝜃𝑠ℎ− 𝜃 − ∅ + ,) + 𝑉𝑠ℎ𝑌+ , + 𝑐 𝑠∅ + , +
If the number of generator buses is ‘m’, the power flow problem for a ‘n’ bus system incorporating ‘p’ STATCOMs can be formulated as
Solve: 𝜃 e , 𝑉e ; Given: e , e ;
𝜃 e = [𝜃 … … … 𝜃 +𝑝]
𝑉 e = [𝑉
+ … … … 𝑉+𝑝]
e = [ … … …
+𝑝] e = [
III. RESULT AND DISCUSSION
The Newton raphson load flow on IEEE 30 bus system implemented on MATLAB return following results For iteration = 8
A. Bus Voltage and Phase Angle without STATCOM
FIGURE 2 bus voltages and phase angle, IEEE 30 Bus without STATCOM
B. Bus Voltage and Phase Angle with STATCOM
Bus voltage and phase angle when STATCOM is incorporated at buses 4, 7, 14, 29. Below is the table shown for the data of bus Voltage and phase angle when STATCOM is introduced to the system. Bus 1 is the reference bus hence the phase angle is taken or assumed to be zero. Phase angle of all the other buses are taken with reference to the slack bus
FIGURE 3 Bus Voltages and phase angle, IEEE 30 Bus with STATCOM
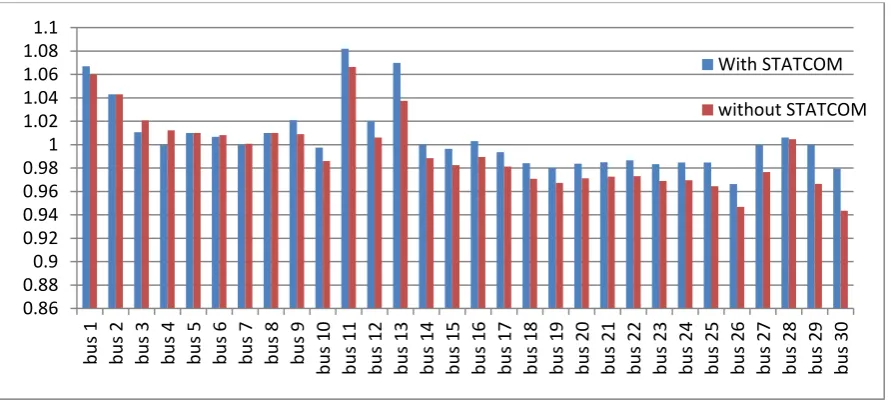
The nodal voltages at the buses where STATCOM are placed that is at 4,7,14 and 29 the bus voltages are maintained at 1 p.u. and at other buses the nodal voltages are either close to 1 or 1. The voltage profile of the network is hence improved with the incorporation of STATCOM in the network. The graph below shows the comparative nodal voltages of various buses
C. Real and Reactive Power Flows
The Newton raphson load flow on this system implemented on MATLAB return following results for real and reactive power flows in the network
Line flows without STATCOM. For iterations = 8
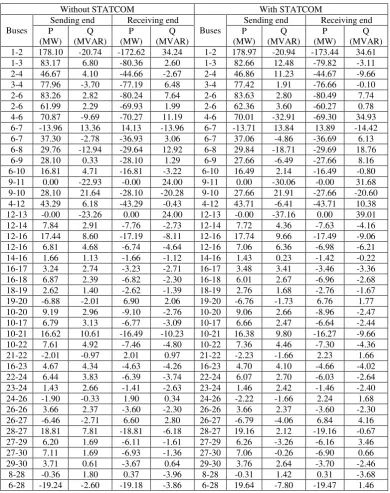
Table 1 Line flows with and without STATCOM, IEEE 30 Bus System
Without STATCOM With STATCOM
Buses
Sending end Receiving end
Buses
Sending end Receiving end P
(MW) Q (MVAR)
P (MW)
Q (MVAR)
P (MW)
Q (MVAR)
P (MW)
The real and reactive power flows in the IEEE 30 Bus system when 4 STATCOM are incorporated in the system at bus 4,7,14 and 29. The following results are obtained.
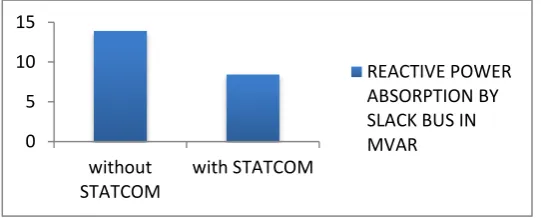
The bus 1 is considered as slack bus. It is clear from the tables 1 that the reactive power generation at the bus is reduced. The reactive power absorption at slack bus without STATCOM was 13.94 MVAR while after inclusion of STATCOM the generator is absorbing 8.46 MVAR of reactive power, this shows that the remaining reactive power is absorbed by STATCOM.
The graph below shows that the reactive power that was being absorbed by the slack bus is reduced as the excess reactive power is absorbed by the STATCOM places at that bus. STATCOM.
FIGURE 6 Comparative Reactive Power Generation at Slack Bus, IEEE 30 Bus Systems
D. RESULT
STATCOM injected powers
STATCOM in this system is injected at four places bus numbers 4, 7, 14 and 29.
STATCOM injected reactive power at Bus 4
=(-9.66 – 0.10 – 32.91 – 6.41) + STATCOM power = (7.69 +1.66) STATCOM absorbed power = 46. 38 MVAR
So the STATCOM at bus 4 is absorbing 46.38 MVAR of reactive power so as to keep the voltage ratio close to 1 p.u.
The STATCOM parameters associated with this amount of reactive power generation are VR= .9 p. u.
δ R= − 6. 66°.
STATCOM injected reactive power at Bus 7
=(-13.96 + 3.06) + STATCOM injected power = 10.9 MVAR STATCOM injected power = 1.61 MVAR
The STATCOM parameters associated with this amount of reactive power generation are VR= .9 p. u.
δ R= − 6. 66°.
STATCOM injected reactive power at Bus 14
=(-4.16 + 0.23) + STATCOM injected power = 1.6 MVAR STATCOM injected power =2.33 MVAR
The STATCOM parameters associated with this amount of reactive power generation are VR= .9 p. u.
δ R= − 6. 66°.
STATCOM injected reactive power at Bus 29
=(3.46 + 2.64) + STATCOM injected power = 0.9 MVAR STATCOM injected power = 6.90 MVAR
In this case the STATCOM is generating 6.90 MVAR of reactive power so as to keep the nodal voltage at bus close to 1 p.u. The STATCOM parameters associated with this amount of reactive power generation are
VR= .9 p. u. δ R= − 6. 66°.
0 5 10 15
without STATCOM
with STATCOM
VI.CONCLUSION
Power flow study determines the best operating condition of a Power System Network. Newton- Raphson load flow method has been used for solving the power-flow equation. To study the effect of STATCOM on power system, a modified power flow model of the STATCOM is attempted. STATCOM is placed at different locations in various bus systems and the modified load flow program is used to access the effect of STATCOM on the system. The simulation is done using MATLAB.
Load flow study of IEEE 30 is considered and it is shown that the voltage profile of the system is improved and it is shown using plots. It was also evident that the voltage magnitude of that particular bus at which STATCOM is placed is maintained at 1 p.u. The reactive power generation and absorption of the slack bus generator is reduced. The buses placed far away from the STATCOM are least effected while there was no effect of STATCOM on the real power.
REFERENCES
[1] N.G Hingorani and L.Gyugyi, Understanding FACTS Concepts and Technology of Flexible AC Transmission Systems, Piscataway:IEEE Press, 1999.
[2] Y.Zhang, B. Wu and J.Zhou, “Power injection model of STATCOM with control and operating limits for power flow and voltage stability analysis,” Electric Power System Research, vol. 76, No. 12, pp.1003-1010, August, 2006.
[3] Suman Bhowmick, Biswarup Das and Narendra kumar, “An Advanced Static Synchronous Compensator Model to Reuse Newton and Decoupled Power Flow Codes”, Electric Power Component and System, pp. 1647-1665, Nov. 2011.
[4] Enrique Acha,and Behzad Kazemtabrizi, “A New STATCOM for Power Flows Using the Newton Raphson Method” IEEE Trans. On Power Sys. Pp. 1-11, Dec. 2012.
[5] Suman Bhowmick , Biswarup Das, Narendra Kumar, “An Advanced IPFC Model to reuse Newton Power Flow Codes”, IEEE Trans. Power System , vol. 24, no.2, May,2009.
[6] Xiao Ping Zhang, “Advanced Modelling of the Multicontrol Functional Static Synchronous Series Compensator in Newton Power Flow,” IEEE Trans. Power System, vol.18 no.4, November, 2003.
[7] Laszlo Gyugyi, Kalyan K.Sen, Colin D. Schander “The Interline Power Flow Controller Concept: A New Approach to Power Flow Management in Transmission System,” IEEE Trans.Power Delivery, vol. 14, no. 3, July 1999.
[8] Laszlo Gyugyi Colin, D. Schander, Kalyan K.Sen, “Static Synchronous Series Compensator: A Solid State Approach to the Series Compensation of Transmission Lines”, IEEE Trans. Power System Vol. 12, no. 1, Jan,1997.
[9] Xiao Ping Zhang, Edmund Handschin, Maojun Mike Yao, “Modeling of the Generalized Unified Power Flow Controller(GUPFC) in a Nonlinear Interior Pointb OPF” IEEE Trans. Power System, vol. 16 No.3, Aug,2001.