An Efficient Adaptive Linear Filtering
Algorithm for Image Restoration Using
Inverse Filter
M.Hymagayathri1, A.Jaya Prakash2, T.V. Madhusudhana Rao 3
PG Student [DECS], Dept. of ECE, Thandrapaparaya Institute of Science & Technology, Bobbili, A.P, India1
Assistant Professor, Dept. of ECE, Thandrapaparaya Institute of Science & Technology, Bobbili, A.P, India2
Associate Professor, Dept. of CSE, Thandrapaparaya Institute of Science & Technology, Bobbili, A.P, India3
ABSTRACT: In image processing, an efficient method of removing noise from the images, before processing them for further analysis is a great challenge for the researchers. Image denoising occurs due to transmission channel error, camera misfocus, atmospheric turbulence, relative object camera motion etc…Such degradations are unavoidable while a scene is captured through a camera. Restoration of such image is a extremely essential in many practical applications. Image denoising involves the manipulation of the image data to produce a visually high quality image. The kind of noise removal algorithms to remove the noise depends on the type of noise that occur during transmission and capturing .To remove these types of noise we have many filters like mean filter, median ,inverse filter,weiner filter,psudeo inverse filter. No single filter can remove both type of noise. In this paper various special types of noises applying to image and investigates the result of noise reduction techniques by applying the various filter.
KEYWORDS:Image restoration model, Image noise model, Wiener filter, Pseudo Inverse filter, Inverse filter
I.INTRODUCTION
Visual information transmitted in the form of digital images is becoming a major method of communication in the modern age, but the image obtained after transmission is often corrupted with noise. The received image needs processing before it can be used in applications. Image denoising involves the manipulation of the image data to produce a visually high quality image. This paper gives us a brief idea about various image denoising methods. The numerical computation has been done using MATLAB 7.8.0.
Image denoising is often used in the field of photography or publishing where an image was somehow degrades but needs to be improved before it can be printed. For this type of application we need to know something about the degradation process in order to develop a model for it. When we have a model for the degradation process, the inverse process can be applied to the image to restore it back to the original form.
II. VARIOUS SOURCES OF NOISE IN IMAGES
Noise is introduced in the image at the time of image acquisition or transmission. Different factors may be
responsible for introduction of noise in the image. The number of pixels corrupted in the image will decide the quantification of the noise. The principal sources of noise in the digital image are:
a) The imaging sensor may be affected by environmental conditions during image acquisition. b) Insufficient light levels and sensor temperature may introduce the noise in the image. c) Interference in the transmission channel may also corrupt the image.
III.TYPES OF NOISE
Noise in image is caused by fluctuations in the brightness or colour information at the pixels. Noise is a process which distorts the acquired image and is not a part of the original image. Noise in images can occur in many
ways. During image acquisition the optical signals get converted into electrical which then gets converted to digital signal. At each process of conversion noise gets added to the image. The image can also become noisy during transmission of the image in the form of digital signals. The types of noises are:
1. Gaussian noise 2.Salt and pepper noise 3. Shot noise (Poisson noise) 4.Speckle noise
IV.IMAGE DENOISING TECHNIQUES
An image is often corrupted by noise in its acquisition and transmission. Image denoising is used to remove the additive noise while retaining as much as possible the important signal features. In the recent years there has been a fair amount of research on wavelet thresholding and threshold selection for signal de-noising[1],[2] ,because wavelet provides an appropriate basis for separation noisy signal from the image signal. The motivation is that as the wavelet transform is good at energy compaction, the small coefficient is more likely due to noise and large coefficient due to important signal features. These small coefficients can be threshold without affecting the significant features of the image.
Thresholding is a simple non-linear technique, which operates on one wavelet coefficient at a time. In its most basic form, each coefficient is threshold by comparing against threshold, if the coefficient is smaller than threshold, set to zero; otherwise it is kept or modified. Replacing the small noisy coefficients by zero and inverse wavelet transform on the result may lead to reconstruction with the essential signal characteristics and with less noise.
Other methods include filtering approach objectives of any filtering approach are: * To suppress the noise effectively in uniform regions.
*To preserve edges and other similar image characteristics. * To provide a visually natural appearance. [3]
Importance of linear and non linear denosing: Image denoising is very important task in image processing for the analysis of images. De-noising methods can be linear as well as non-linear .Where linear methods are fast enough, but they do not preserve the details of the images, whereas the non-linear methods preserve the details of the images. Broadly speaking, denoising filters can be categorized in the following categories: 1) average filter 2) order statistics filter 3) adaptive filter .
Adaptive filter:
Adaptive filters are changing the behaviour on the basis of statically characteristics of the image region, encompassed by the filter region. adaptive filters will provide good stability and efficiency due feedback of coefficients in algorithm.
Inverse filtering:
The inverse filter is a straight forward image –restoration method..If we know the exact psf model in the image degradation system and ignore the noise effect, the degraded image can be restored using the inverse filter.
= + ,[3]. ( ^( , ) = ( ( , )
( , ))
Where ( , ) is inverse fourier transform of degraded system And H (i,j) is the spectrum of psf.
Pseudo-inverse filter:
= > ≤
Wiener filter:
The purpose of the wiener filter is to filter out the noise that has corrupted a signal. This filter is based on a statistical approach. Mostly all the filters are designed for a desired frequency response. Wiener filter deal with the filtering of an image from a different view.
The goal of wiener filter is reduced the mean square error as much as possible. This filter is capable of reducing the noise and degrading function. One method that we assume we have knowledge of the spectral property of the noise and original signal. We used the linear time invariant filter which gives output similar as to the original signal as much possible.[3]
Characteristics of the wiener filter are:
a. Assumption: Signal and the additive noise are stationary linear-random processes with their known spectral characteristics.
b.Requirement: The wiener filter must be physically realizable, or it can be either causal.
c.Performance criteria: There is minimum mean-square [MSE] error. The Fourier domain of the wiener filter is
G(u,v)=H*(u,v)
The Additive Noise Power Spectrum be ( , ) and Image power spectrum be ( , ) In Fourier domain, the wiener filter is expressed as
( , ) =
∗( , )
| ( , )| ( , )
Where ( , )= ( , )
( , ) is the noise to signal ratio. This filter is acts like all pass filter.
V. RESULTS
A Test image is taken and it is subjected to point spread function to degrade the image .after wards the adaptive linear filters applied to degraded image to get the restored image .To evaluate the fidelity criteria NCC and PSNR &ISNR is computed. In this computation the regression analysis will give a better idea which method is better one to calculate the efficiency of the algorithm.
Objectative fidelity criteria: For comparing original image and restored image, we calculate the parameters:
Mean Square Error:
The MSE is the cumulative square error between the restored image and original image defined by
=
× [ ( , )− ( , )]
Where, f is the original image and g is the restored image. The dimension of the image is × . Thus MSE should be as low as possible for effective denoising.
Peak signal to noise ratio (PSNR):
PSNR is the ratio between maximum possible power of a signal and the power of distorting noise which affects the quality of its representation. It is defined:
= ×
× ∑ ∑ [ ( , )− ( , )]
Where 255( ) is the maximum signal value that exists in our original “known to be good” image. Signal to noise ratio is defined as the power ratio between a signal and the background noise.
Normalized correlation coefficient:
=
× ( , ) × ( , )
Where f(i,j) is the original image and g(i,j) is the restored image . This correlation measures the similarity between the original image and restored image
Improvement in signal to noise ratio:
Improvement in signal to noise ratio is used to test the performance of the image –restoration algorithm objectively. If f(x,y) and g(x,y) represent the original and the degraded image ,the expression of ISNR is given by.
= ∑ , [ ( , )− ( , )]
∑ , [ ( , )− ( , )]
Here, h(x,y) is the restored image .this metric can be used for simulation purposes only because the original image is assumed to be available which is not true practically.
PSUDEO INVERSE FILTER
PSF
FLOWER GOLD FISH HIBISCUS
NCC PSNR ISNR NCC PSNR ISNR NCC PSNR ISNR
ONES(9,9)/81 0.45 5.5 0.0052 0.7116 8.02 0.0059 0.6466 6.9428 0.0049
ONES(10,10)/100 0.45 5.5 0.0061 0.7116 7.92 0.0066 0.6466 6.8594 0.0056
ONES(11,11)/121 0.45 5.4 0.0069 0.7112 7.84 0.0072 0.6465 6.7437 0.0061
AVERAGE(6,6) 0.45 6.1 0.0025 0.7115 8.37 0.0032 0.6468 7.2619 0.0028
AVERAGE(7,7) 0.45 6.0 0.0033 0.7114 8.21 0.0043 0.6466 7.1873 0.0034
DISK(10) 0.45 5.2 0.021 0.7099 7.62 0.0183 0.6472 6.4323 0.0176
DISK(15) 0.45 5.3 0.0381 0.7082 7.50 0.0301 0.6479 6.2976 0.0311
MOTION(20,10) 0.45 6.0 0.0203 0.7115 8.26 0.0178 0.6467 7.4873 0.0167
MOTION(30,10) 0.45 6.0 0.0365 0.7115 8.13 0.0285 0.6472 7.1059 0.0296
MOTION(40,20) 0.45 5.8 0.0508 0.7108 8.07 0.0365 0.6478 7.0373 0.041
Table 1. Results of various Degradation models with Psudeoinverse Filter
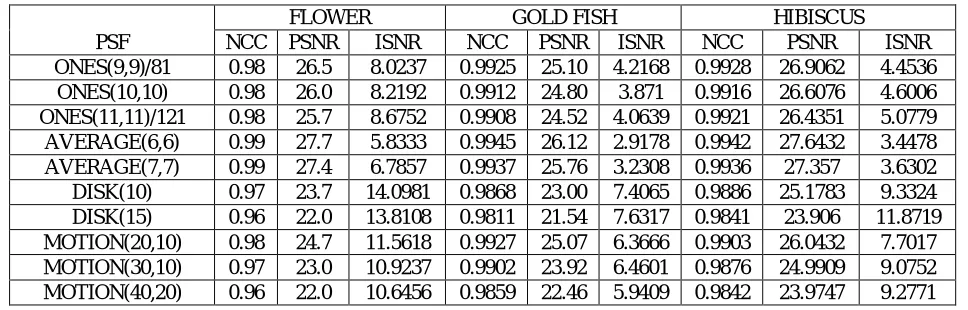
PSF
FLOWER GOLD FISH HIBISCUS NCC PSNR ISNR NCC PSNR ISNR NCC PSNR ISNR ONES(9,9)/81 0.98 26.5 8.0237 0.9925 25.10 4.2168 0.9928 26.9062 4.4536
ONES(10,10) 0.98 26.0 8.2192 0.9912 24.80 3.871 0.9916 26.6076 4.6006 ONES(11,11)/121 0.98 25.7 8.6752 0.9908 24.52 4.0639 0.9921 26.4351 5.0779 AVERAGE(6,6) 0.99 27.7 5.8333 0.9945 26.12 2.9178 0.9942 27.6432 3.4478 AVERAGE(7,7) 0.99 27.4 6.7857 0.9937 25.76 3.2308 0.9936 27.357 3.6302 DISK(10) 0.97 23.7 14.0981 0.9868 23.00 7.4065 0.9886 25.1783 9.3324 DISK(15) 0.96 22.0 13.8108 0.9811 21.54 7.6317 0.9841 23.906 11.8719 MOTION(20,10) 0.98 24.7 11.5618 0.9927 25.07 6.3666 0.9903 26.0432 7.7017 MOTION(30,10) 0.97 23.0 10.9237 0.9902 23.92 6.4601 0.9876 24.9909 9.0752 MOTION(40,20) 0.96 22.0 10.6456 0.9859 22.46 5.9409 0.9842 23.9747 9.2771
INVERSE FILTER
PSF
FLOWER GOLD FISH HIBISCUS NCC PSNR ISNR NCC PSNR ISNR NCC PSNR ISNR ONES(9,9)/81 1.00 64.6 4.19E+10 1 59.09 1.28E+11 1 63.5697 2.44E+11 ONES(10,10)/100 1.00 65.1 1.00E+05 1 56.94 1.19E+04 1 63.6066 1.05E+04 ONES(11,11)/121 1.00 63.8 5.36E+09 1 57.34 1.97E+10 1 61.6422 2.35E+10 AVERAGE(6,6) 1.00 69.3 3.89E+04 1 58.96 5.81E+03 1 67.2899 4.77E+03 AVERAGE(7,7) 1.00 67.2 2.97E+10 1 61.46 1.12E+11 1 65.0773 1.73E+11 DISK(10) 1.00 62.2 2.16E+05 1 57.55 7.77E+04 1 61.0632 1.06E+05 DISK(15) 1.00 61.5 1.97E+05 1 55.74 9.55E+04 1 60.6391 1.34E+05 MOTION(20,10) 1.00 69.2 6.56E+07 1 63.75 4.69E+08 1 68.4056 7.87E+08 MOTION(30,10) 1.00 68.8 2.02E+08 1 63.44 1.60E+08 1 67.9014 3.86E+08 MOTION(40,20) 1.00 68.4 9.60E+06 1 62.38 1.81E+07 1 66.7248 5.45E+07
Table 3. Results of various Degradation models with Inverse Filter
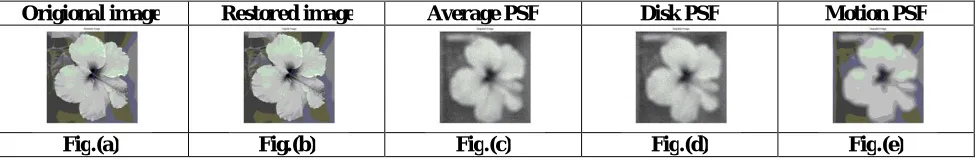
Origional image Restored image Average PSF Disk PSF Motion PSF
Fig.(a) Fig.(b) Fig.(c) Fig.(d) Fig.(e)
Table 4. figures of (a)origional image (b) restored image (c),(d),(e) Degraded images Of Different PSF's VI.CONCLUSION
In modern digital world, the electronic industries are launching the electronic gadgets with better features day by day, by providing the better services and developing the next generation networks. To avoid the band width limitations in communications, digital communications such as digital image, video processing and multimedia processing are used. The selection of right denoising algorithm plays a vital role, it is important to experiment and compare the methods. In this paper, the computational time can be reduced to 7 cpu and also improves the utilization of memory. In this paper , different types of denoising filters comparisons are discussed.
Scope of future work:
REFERENCES
[1]. Suresh kumar,papendra kumar,manoj gupta,ashok Kumar nagawatt,”performance comparison of median and wiener filter in image denoising“, international journal of computer applications(0975-8887)volume12-no.4,november2010.
[2] Parminder Kaur and Jagroop Singh. 2011. A Study Effect of Gaussian Noise on PSNR Value for Digital Images International Journal of Computer and Electrical E ngineering.Vol. 3, No.2, 1793-8163.
[3] Mrs. C. Mythili and Dr. V.Kavitha. Efficient Technique for Color Image Noise Reduction The Research bulltion of jordan V o l . I I ( I I I ) [4] Mr.Amit Agrawal and Ramesh Raskar. Optimal single image capture for motion deblurring. In Proc. IEEE Conference on Computer
Vision and Pattern Recognition, pages 2560{2567, 2009.
[5] Mr. Pawan Patidar and et al. Image De-noising by Various Filters for Different Noise in International Journal of Computer Applications (0975 – 8887) Volume 9– No.4, November 2010
[6] Charles Boncelet .”Image Noise Models”. in Alan C.Bovik. Handbook of Image and Video Processing.2005.
[7] Mr. Salem Saleh Al-amri and et al. Comparative Study of Removal Noise from Remote Sensing Image. IJCSI International Journal of Computer Science Issues, Vol. 7, Issue. 1, No. 1, January 2010 32 ISSN (Online): 169 4-0784 ISSN (Print): 1694-0814
[8] K. Dabov, A. Foi, V. Katkovnik, and K. Egiazarian, “Image denoising by sparse 3D transform-domain collaborative filtering, ” IEEE Trans. Image Process., vol. 16, no. 8, pp. 2080–2095, Aug. 2007.
[9] Aram Danielyan, Vladimir Katkovnik, and Karen Egiazarian, Senior Member, IEEE “BM3D frames and Varational Image deblurring” , Image Processing, IEEE Transactions on (Volume:21 , Issue: 4 ), ISSN: 1057-7149.
[10] D. Maheswari et. al. NOISE REMOVAL IN COMPOUND IMAGE USING MEDIAN FILTER. (IJCSE) International Journal on Computer Science and Engineering Vol. 02, No. 04, 2010, 1359-1362.