Text Classification in Asian Languages without Word Segmentation
Fuchun Peng
Xiangji Huang Dale Schuurmans Shaojun Wang
School of Computer Science, University of Waterloo, Ontario, Canada
Department of Computer Science, University of Massachusetts, Amherst, MA, USA
Department of Statistics, University of Toronto, Ontario, Canada
f3peng, jhuang, dale, sjwang @ai.uwaterloo.ca
Abstract
We present a simple approach for Asian language text classification without word segmentation, based on statistical -gram
language modeling. In particular, we ex-amine Chinese and Japanese text classi-fication. With character -gram models,
our approach avoids word segmentation. However, unlike traditional ad hoc -gram
models, the statistical language model-ing based approach has strong informa-tion theoretic basis and avoids explicit fea-ture selection procedure which potentially loses significantly amount of useful infor-mation. We systematically study the key factors in language modeling and their in-fluence on classification. Experiments on Chinese TREC and Japanese NTCIR topic detection show that the simple approach can achieve better performance compared to traditional approaches while avoiding word segmentation, which demonstrates its superiority in Asian language text clas-sification.
1 Introduction
Text classification addresses the problem of assign-ing a given passage of text (or a document) to one or more predefined classes. This is an important area of information retrieval research that has been heav-ily investigated, although most of the research activ-ity has concentrated on English text (Dumais, 1998;
Yang, 1999). Text classification in Asian languages such as Chinese and Japanese, however, is also an important (and relatively more recent) area of re-search that introduces a number of additional diffi-culties. One difficulty with Chinese and Japanese text classification is that, unlike English, Chinese and Japanese texts do not have explicit whitespace between words. This means that some form of word segmentation is normally required before fur-ther processing. However, word segmentation itself is a difficult problem in these languages. A second difficulty is that there is a lack of standard bench-mark data sets for these languages. Nevertheless, recently, there has been significant notable progress on Chinese and Japanese text classification (Aizawa, 2001; He et al., 2001).
Many standard machine learning techniques have been applied to text categorization problems, such as naive Bayes classifiers, support vector machines, linear least squares models, neural networks, and k-nearest neighbor classifiers (Sebastiani, 2002; Yang, 1999). Unfortunately, most current text classi-fiers work with word level features. However, word identification in Asian languages, such as Chinese and Japanese, is itself a hard problem. To avoid the word segmentation problems, character level
-gram models have been proposed (Cavnar and Tren-kle, 1994; Damashek, 1995). There, they used
ap-proaches do not always cope well in such circum-stances. For example, given a sufficiently large num-ber of features, the cumulative effect of uncommon features can still have an important effect on clas-sification accuracy, even though infrequent features contribute less information than common features individually. Therefore, throwing away uncommon features is usually not an appropriate strategy in this domain (Aizawa, 2001). Another problem is that feature selection normally uses indirect tests, such as or mutual information, which involve setting ar-bitrary thresholds and conducting a heuristic greedy search to find a good subset of features. Moreover, by treating text categorization as a classical classifi-cation problem, standard approaches can ignore the fact that texts are written in natural language, which means that they have many implicit regularities that can be well modeled by specific tools from natural language processing.
In this paper, we present a simple text categoriza-tion approach based on statistical -gram language
modeling to overcome the above shortcomings in a principled fashion. An advantage we exploit is that the language modeling approach does not discard low frequency features during classification, as is commonly done in traditional classification learning approaches. Also, the language modeling approach uses -gram models to capture more contextual
in-formation than standard bag-of-words approaches, and employs better smoothing techniques than stan-dard classification learning. These advantages are supported by our empirical results on Chinese and Japanese data.
2 Language Model Text Classifiers
The goal of language modeling is to predict the probability of natural word sequences; or more sim-ply, to put high probability on word sequences that actually occur (and low probability on word se-quences that never occur). Given a word sequence
to be used as a test corpus, the quality of a language model can be measured by the empirical perplexity (or entropy) on this corpus
Perplexity ! #" %$ (1)
The goal of language modeling is to obtain a small perplexity.
2.1 & -gram language modeling
The simplest and most successful basis for language modeling is the -gram model. Note that by the
chain rule of probability we can write the probability of any sequence as
' $ ' ! #" $ (2)
An -gram model approximates this probability by
assuming that the only words relevant to predicting
' ! #" $
are the previous )(
words; that is, it assumes the Markov -gram independence
as-sumption ! #" $ ! #"+*-, ." $
A straightforward maximum likelihood estimate of
-gram probabilities from a corpus is given by the
observed frequency ' ! ."+*-, #" $ / #"+*-, $ / #"+*-, #" %$(3)
where #(.) is the number of occurrences of a speci-fied gram in the training corpus. Unfortunately, us-ing grams of length up to entails estimating the
probability of0
*
events, where0 is the size of the
word vocabulary. This quickly overwhelms modern computational and data resources for even modest choices of (beyond 3 to 6). Also, because of the
heavy tailed nature of language (i.e. Zipf’s law) one is likely to encounter novel -grams that were never
witnessed during training. Therefore, some mecha-nism for assigning non-zero probability to novel
-grams is a central and unavoidable issue. One stan-dard approach to smoothing probability estimates to cope with sparse data problems (and to cope with potentially missing -grams) is to use some sort of
where 6 ' ! #"+*1, #" $ @?BADCFEHGI KJ / #"+*-, $ / #"+*-, #" $ (5)
is the discounted probability, and=
#"+*1, #" $
is a normalization constant calculated to be
= #"+*1, #" $ ( L
M1NOQPSRUTV-WHXZY\[][][RUTV^Y#M`_baUc
6 '#d ! ."+*-, #" $ ( L
M1NOQPSRUTV-WHXZY\[][][RUTV^Y#M`_baUc
6 '#d ! ."+*-, 1 #" $ (6) The discounted probability (5) can be com-puted using different smoothing approaches includ-ing Laplace smoothinclud-ing, linear smoothinclud-ing, absolute smoothing, Good-Turing smoothing and Witten-Bell smoothing (Chen and Goodman, 1998).
The language models described above use indi-vidual words as the basic unit, although one could instead consider models that use individual
char-acters as the basic unit. The remaining details
re-main the same in this case. The only difference is that the character vocabulary is always much smaller than the word vocabulary, which means that one can normally use a much higher order, , in a
charac-ter level -gram model (although the text spanned
by a character model is still usually less than that spanned by a word model). The benefits of the char-acter level model in the context of text classification are multi-fold: it avoids the need for explicit word segmentation in the case of Asian languages, and it greatly reduces the sparse data problems associated with large vocabulary models. In this paper, we ex-periment with character level models to avoid word segmentation in Chinese and Japanese.
2.2 Language models as text classifiers
Text classifiers attempt to identify attributes which distinguish documents in different categories. Such attributes may include vocabulary terms, word av-erage length, local -grams, or global syntactic and
semantic properties. Language models also attempt capture such regularities, and hence provide another natural avenue to constructing text classifiers.
Our approach to applying language models to text categorization is to use Bayesian decision theory. Assume we wish to classify a text
?
e\
1 gf
into a category
Eihkj ml E 7 7 EnopnSq
. A natural choice is to pick the category
E
that has the largest posterior probability given the text. That is,
Esr ut1vwyxzt{ |\} o~ v E ! ? $ (7)
Using Bayes rule, this can be rewritten as
E r ut1vwQxzt{ |\} o ~ v E $ ~ v ? ! E $ (8) ut1vwQxzt{ |\} o ~ v E $ f | ! #"+*1, #" $ (9) Here, ~ v ? ! E $
is the likelihood of
?
under category
E
, which can be computed by -gram language
mod-eling. The likelihood is related to perplexity by Equ. (1). The prior
~
v
E
$
can be computed from training data or can be used to incorporate more as-sumptions, such as a uniform or Dirichelet distribu-tion.
Therefore, our approach is to learn a separate back-off language model for each category, by train-ing on a data set from that category. Then, to cate-gorize a new text
?
, we supply
?
to each language model, evaluate the likelihood (or entropy) of
?
un-der the model, and pick the winning category ac-cording to Equ. (9).
The inference of an -gram based text classifier
is very similar to a naive Bayes classifier (to be dicussed below). In fact, -gram classifiers are a
straightforward generalization of naive Bayes (Peng and Schuurmans, 2003).
3 Traditional Text Classifiers
We introduce the three standard text classifiers that we will compare against below.
3.1 Naive Bayes classifiers
A simple yet effective learning algorithm for text classification is the naive Bayes classifier. In this model, a document
?
is normally represented by a vector of attributes
? # 7 7 $ . The naive Bayes model assumes that all of the attribute values `
E
. Thus, a maximum a posteriori (MAP) classifier can be constructed as follows.
Esr
ut1vwx't{
|\}
o
2
4
5
E
$:>
#
!
E
$-]
(10)
To cope with features that remain unobserved dur-ing traindur-ing, the estimate of '#
!
E
$
is usually ad-justed by Laplace smoothing
#s
!
E
$
&
|
&
|
(11)
where &
|
is the frequency of attribute in
|
,
&
|
&
|
, and
. A special case of Laplace smoothing isadd onesmoothing, obtained by setting
. We use add one smoothing in our experiments below.
3.2 Ad hoc -gram text classifiers
In this method a test document
?
and a class label
E
are both represented by vectors of -gram features,
and a distance measure between the representations of
?
and
E
is defined. The features to be used dur-ing classification are usually selected by employdur-ing heuristic methods, such as
or mutual information scoring, that involve setting cutoff thresholds and conducting a greedy search for a good feature sub-set. We refer this method as ad hoc -gram based
text classifier. The final classification decision is made according to
Esr
ut1vwx'
|}
o
l distance
?
7
E
$
q
(12)
Different distance metrics can be used in this ap-proach. We implemented a simple re-ranking dis-tance, which is sometimes referred to as the out-out-place (OOP) measure (Cavnar and Trenkle, 1994). In this method, a document is represented by an
-gram profile that contains selected -grams sorted
by decreasing frequency. For each -gram in a test
document profile, we find its counterpart in the class profile and compute the number of places its loca-tion differs. The distance between a test document and a class is computed by summing the individual out-of-place values.
3.3 Support vector machine classifiers
Given a set of & linearly separable training
exam-ples l
d
h
*
!
A
7^7
7
&
q
, where each
sample belongs to one of the two classes,
h
l
7
(
q
, the SVM approach seeks the optimal hy-perplane
d
¢¡
;
that separates the positive and negative examples with the largest margin. The problem can be formulated as solving the following quadratic programming problem (Vapnik, 1995).
minimize
!!
!!
(13) subject to
£
d
¤¡
$y¥
In our experiments below, we use the
§¦©¨«ª ¬®s¯
(Joachims, 1998) toolkit with default settings.
4 Empirical evaluation
We now present our experimental results on Chinese and Japanese text classification problems. The Chi-nese data set we used has been previously investi-gated in (He et al., 2001). The corpus is a subset of the TREC-5People’s Daily news corpus published by the Linguistic Data Consortium (LDC) in 1995. The entire TREC-5 data set contains 164,789 docu-ments on a variety of topics, including international and domestic news, sports, and culture. The corpus was originally intended for research on information retrieval. To make the data set suitable for text cat-egorization, documents were first clustered into 101 groups that shared the same headline (as indicated by an SGML tag). The six most frequent groups were selected to make a Chinese text categorization data set.
For Japanese text classification, we consider the Japanese text classification data investigated by (Aizawa, 2001). This data set was converted from the NTCIR-J1 data set originally created for Japanese text retrieval research. The conversion pro-cess is similar to Chinese data. The final text classi-fication dataset has 24 categories which are unevenly distributed.
4.1 Experimental paradigm
sets. For SVMs, we employ a standard technique of first converting the !
j
!
category classification prob-lem to !
j
!
binary classification problems.
For the experiments on Chinese data, we fol-low (He et al., 2001) and convert the problem into 6 binary classification problems. In each case, we randomly select 500 positive examples and then se-lect 500 negative examples evenly from among the remaining negative categories to form the training data. The testing set contains 100 positive docu-ments and 100 negative docudocu-ments generated in the same way. The training set and testing set do no overlap and do not contain repeated documents.
For the experiments on Japanese data, we fol-low (Aizawa, 2001) and directly experiment with a 24-class classification problem. The NTCIR data sets are unevenly distributed across categories. The training data consists of 310,355 documents dis-tributed unevenly among the categories (with a min-imum of 1,747 and maxmin-imum of 83,668 documents per category), and the testing set contains 10,000 documents unevenly distributed among categories (with a minimum of 56 and maximum of 2,696 doc-uments per category).
4.2 Measuring classification performance
In the Chinese experiments, where 6 binary classifi-cation problems are formulated, we measured classi-fication performance bymicro-averaged F-measure scores. To calculate the micro-averaged score, we formed an aggregate confusion matrix by adding up the individual confusion matrices from each cate-gory. The micro-averaged precision, recall, and F-measure can then be computed based on the aggre-gated confusion matrix.
For the Japanese experiments, we measured
over-all accuracy and the macro-averaged F-measure.
Here the precision, recall, and F-measures of each individual category can be computed based on a
!
j
!
>
!
j
! confusion matrix. Macro-averaged scores
can be computed by averaging the individual scores.
The overall accuracy is computed by dividing the
number of correctly identified documents (summing the numbers across the diagonal) by the total number of test documents.
4.3 Results on Chinese data
Table 1 gives the results of the character level lan-guage modeling approach, where rows correspond to different smoothing techniques. Columns corre-spond to different -gram order
7^7°^7±
. The entries are the micro-average F-measure. (Note that the naive Bayes result corresponds to -gram order
1 withadd onesmoothing, which is italicized in the table.) The results the ad hoc OOP classifier, and for the SVM classifier are shown in Table 2 and Table 3 respectively, where the columns labeled ”Feature #” are the number of features selected.
1 2 3 4
[image:5.612.318.534.349.423.2]Add-one 0.856 0.802 0.797 0.805 Absolute 0.856 0.868 0.867 0.868 Good-Turing 0.856 0.863 0.861 0.862 Linear 0.857 0.861 0.861 0.865 Witten-Bell 0.857 0.860 0.865 0.864
Table 1: Results of character level language model-ing classifier on Chinese data.
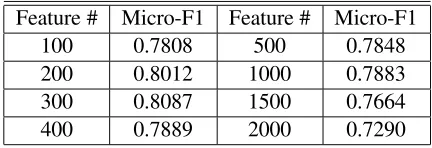
Feature # Micro-F1 Feature # Micro-F1
100 0.7808 500 0.7848
200 0.8012 1000 0.7883
300 0.8087 1500 0.7664
400 0.7889 2000 0.7290
Table 2: Results of the character level OOP classifier on Chinese data.
Feature # Micro-F1 Feature # Micro-F1
100 0.811 500 0.817
200 0.813 1000 0.817
300 0.817 1500 0.815
400 0.816 2000 0.816
Table 3: Results of the character level SVM classi-fier on Chinese data.
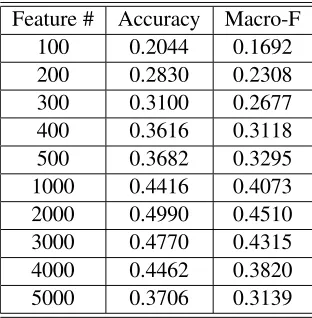
4.4 Results on Japanese data
models to avoid possible character level segmen-tation errors that might be introduced, because we lacked the knowledge to detect misalignment errors in Japanese characters. The results of byte level lan-guage modeling classifiers on the Japanese data are shown in Table 4. (Note that the naive Bayes re-sult corresponds to -gram order 2 with add one
smoothing, which is italicized in the table.) The re-sults for the OOP classifier are shown in Table 5. Note that SVM is not applied in this situation since we are conducting multiple category classification directly while SVM is designed for binary classifi-cation. However, Aizawa (Aizawa, 2001) reported a performance of abut 85% with SVMs by convert-ing the problem into a 24 binary classification prob-lem and by performing word segmentation as pre-processing.
Feature # Accuracy Macro-F
100 0.2044 0.1692
200 0.2830 0.2308
300 0.3100 0.2677
400 0.3616 0.3118
500 0.3682 0.3295
1000 0.4416 0.4073
2000 0.4990 0.4510
3000 0.4770 0.4315
4000 0.4462 0.3820
[image:6.612.107.263.264.423.2]5000 0.3706 0.3139
Table 5: Results of byte level OOP classifier on Japanese data.
5 Discussion and analysis
We now give a detailed analysis and discussion based on the above results. We first compare the language model based classifiers with other classi-fiers, and then analyze the influence of the order
of the -gram model, the influence of the
smooth-ing method, and the influence of feature selection in tradition approaches.
5.1 Comparing classifier performance
Table 6 summarizes the best results obtained by each classifier. The results for the language model (LM) classifiers are better than (or at least comparable to )
other approaches for both the Chinese and Japanese data, while avoiding word segmentation. The SVM result on Japanese data is obtained from (Aizawa, 2001) where word segmentation was performed as a preprocessing. Note that SVM classifiers do not perform as well in our Chinese text classification as they did in English text classification (Dumais, 1998), neither did they in Japanese text classifica-tion (Aizawa, 2001). The reason worths further in-vestigations.
Overall, the language modeling approach appears to demonstrate state of the art performance for Chi-nese and JapaChi-nese text classification. The reasons for the improvement appear to be three-fold: First, the language modeling approach always considers every feature during classification, and can thereby avoid an error-prone feature selection process. Sec-ond, the use of -grams in the model relaxes the
re-strictive independence assumption of naive Bayes. Third, the techniques of statistical language model-ing offer better smoothmodel-ing methods for copmodel-ing with features that are unobserved during training.
LM NB OOP SVM
Chinese Character Level
0.868 0.856 0.8087 0.817
Japanese Byte Level
0.84 0.66 0.4990 85% (Aizawa, 2001)
Table 6: Comparison of best classifier results
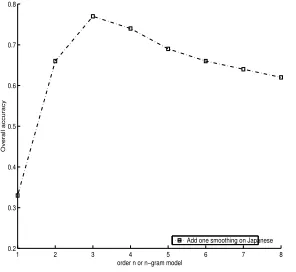
5.2 Influence of the -gram order
The order is a key factor in -gram language
mod-eling. An order that is too small will not capture
sufficient information to accurately model character dependencies. On the other hand, a context that
is too large will create sparse data problems in train-ing. In our Chinese experiments, we did not observe significant improvement when using higher order
Add-one Absolute Good-Turing Linear Witten-Bell
Accu. F-Mac Accu. F-Mac Accu. F-Mac Accu. F-Mac Accu. F-Mac
1 0.33 0.29 0.33 0.29 0.34 0.29 0.34 0.29 0.34 0.29
2 0.66 0.63 0.66 0.62 0.66 0.61 0.66 0.63 0.66 0.62
3 0.77 0.68 0.75 0.72 0.75 0.72 0.76 0.73 0.75 0.72
4 0.74 0.51 0.81 0.77 0.81 0.76 0.82 0.76 0.81 0.77
5 0.69 0.42 0.83 0.77 0.83 0.76 0.83 0.76 0.83 0.77
6 0.66 0.42 0.84 0.76 0.83 0.75 0.83 0.75 0.84 0.77
7 0.64 0.38 0.84 0.75 0.83 0.74 0.83 0.74 0.84 0.76
[image:7.612.99.512.24.166.2]8 0.62 0.31 0.83 0.74 0.83 0.73 0.83 0.73 0.84 0.76
Table 4: Results of byte level language model classifier on Japanese data.
observe an obvious increase in classification perfor-mance with higher order models (Table 4). How-ever, here too, when becomes too large, overfitting
will begin to occur, as better illustrated in Figure 1.
1 2 3 4 5 6 7 8 0.2
0.3 0.4 0.5 0.6 0.7 0.8
order n or n−gram model
Overall accuracy
[image:7.612.356.498.279.421.2]Add one smoothing on Japanese
Figure 1: Effects of order of -gram language
mod-els
5.3 Influence of smoothing techniques
Smoothing plays an key role in language model-ing. Its effect on classification is illustrated in Fig-ure 2. In both cases we have examined, add one
smoothing is obviously the worst smoothing tech-nique, since it systematically overfits much earlier than the more sophisticated smoothing techniques. The other smoothing techniques do not demonstrate a significant difference in classification accuracy on our Chinese and Japanese data, although they do show a difference in the perplexity of the language models themselves (not shown here to save space). Since our goal is to make a final decision based on
the ranking of perplexities, not just their absolute
values, a superior smoothing method in the sense of perplexity reduction does not necessarily lead to a better decision from the perspective of categoriza-tion accuracy.
1 1.5 2 2.5 3 3.5 4 0.65
0.7 0.75 0.8
0.85 Chinese Topic Detection
Accuracy
1 2 3 4 5 6 7 8 0.2
0.4 0.6 0.8
1 Japanese Topic Detection
Accuracy
order n of n−gram models
Absolute Good−Turing Linear Witten−Bell Adding−One
Figure 2: Effects of the smoothing techniques
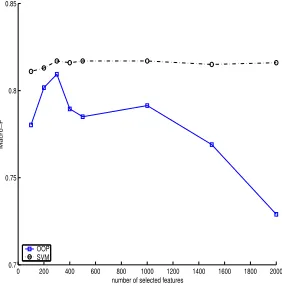
5.4 Influence of feature selection
[image:7.612.114.262.289.425.2]the importance of each individual feature is mea-sured by its contribution to the perplexity (or en-tropy) value.
0 200 400 600 800 1000 1200 1400 1600 1800 2000 0.7
0.75 0.8 0.85
number of selected features
Macro−F
[image:8.612.115.256.77.220.2]OOP SVM
Figure 3: Effects of the number of selected features
5.5 Related Work
The use of -gram models has also been extensively
investigated in information retrieval. However, un-like previous research (Cavnar and Trenkle, 1994; Damashek, 1995), where researchers have used
-grams as features for a traditional feature selection process and then deployed classifiers based on cal-culating feature-vector similarities, we consider all
-grams as features and determine their importance
implicitly by assessing their contribution to perplex-ity. In this way, we avoid an error prone feature se-lection step.
Language modeling for text classification is a rel-atively new area. In principle, any language model can be used to perform text categorization. However,
-gram models are extremely simple and have been
found to be effective in many applications. Teahan and Harper (Teahan and Harper, 2001) used a PPM (prediction by partial matching) model for text cate-gorization where they seek a model that obtains the best compression on a new document.
6 Conclusion
We have presented a simple language model based approach without word segmentation for Chinese and Japanese text classification. By comparison to three standard text classifiers, the language model-ing approach consistently demonstrates better clas-sification accuracies while avoiding word
segmen-tation and feature selection. Although straightfor-ward, the language modeling approach appears to give state of the art results for Chinese and Japanese text classification.
It has been found that word segmentation in Chi-nese text retrieval is tricky and the relationship be-tween word segmentation and retrieval performance is not monotonic (Peng et al., 2002). However, since text classification and text retrieval are two different tasks, it is not clear whether the same relationship exists in text classification context. We are currently investigating this issue and interesting findings have already been observed.
References
A. Aizawa. 2001. Linguistic Techniques to Improve the Performance of Automatic Text Categorization. Pro-ceedings NLPRS2001.
W. Cavnar and J. Trenkle. 1994. N-Gram-Based Text Categorization.Proceedings of SDAIR-94
S. Chen and J. Goodman. 1998. An Empirical Study of Smoothing Techniques for Language Modeling. TR-10-98, Harvard University
M. Damashek. 1995. Gauging Similarity with N-Grams: Language-Independent Categorization of Text? Sci-ence, 267(10), pages 843-848.
S. Dumais, J. Platt, D. Heckerman, and M. Sahami 1998. Inductive Learning Algorithms and Representations for Text Categorization.Proceedings of CIKM98
J. He, A. Tan, and C. Tan. 2001. On Machine Learning Methods for Chinese Documents Classification. Ap-plied Intelligence’s Special Issue on Text and Web Min-ing
T. Joachims. 1998. Text Categorization with Support Vector Machines: Learning with Many Relevant Fea-tures.Proceedings of the ECML-1998
F. Peng, X. Huang, D. Schuurmans, and N. Cercone. 2002. Investigating the Relationship of Word Segmen-tation Performance and Retrieval Performance in Chi-nese IR.Proceedings of COLING2002
F. Peng and D. Schuurmans. 2003. Combining Naive Bayes and N-Gram Language Models for Text Classi-fication.Proceedings of ECIR2003
F. Sebastiani. 2002. Machine Learning in Automated Text Categorization.ACM Computing Surveys, 34(1). W. Teahan and D. Harper. 2001. Using Compression-Based Language Models for Text Categorization. Pro-ceedings of LMIR2001
V. Vapnik. 1995.The Nature of Statistical Learning The-ory.Springer-Verlag.